. 2014 May 12;205(3):377-93.
doi: 10.1083/jcb.201309096. Epub 2014 May 5.

Actin scaffolding by clathrin heavy chain is required for skeletal muscle sarcomere organization

Affiliations

Actin scaffolding by clathrin heavy chain is required for skeletal muscle sarcomere organization

Stéphane Vassilopoulos et al. J Cell Biol. .

Abstract

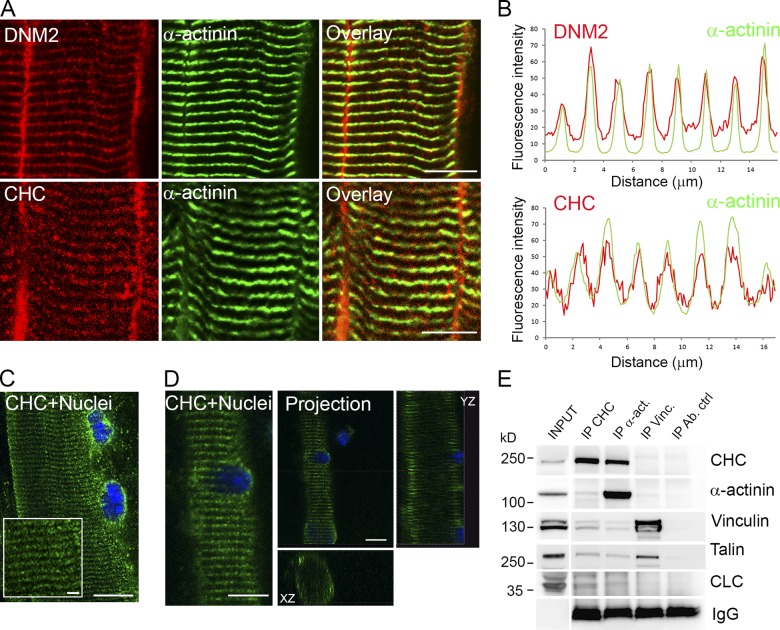
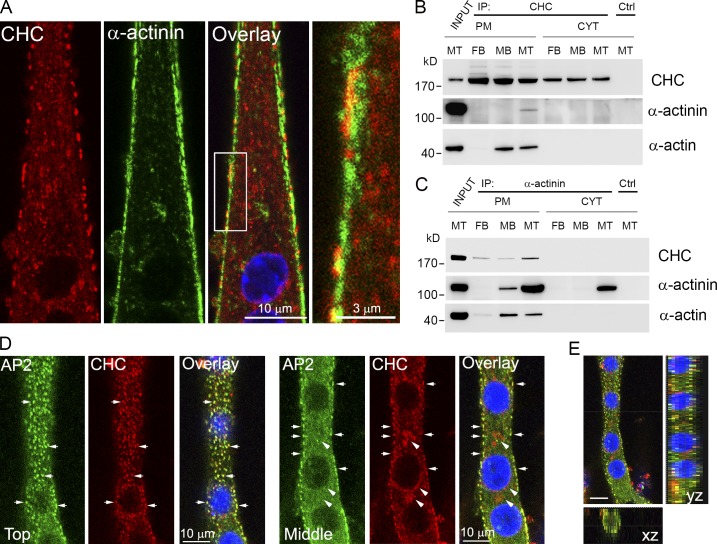
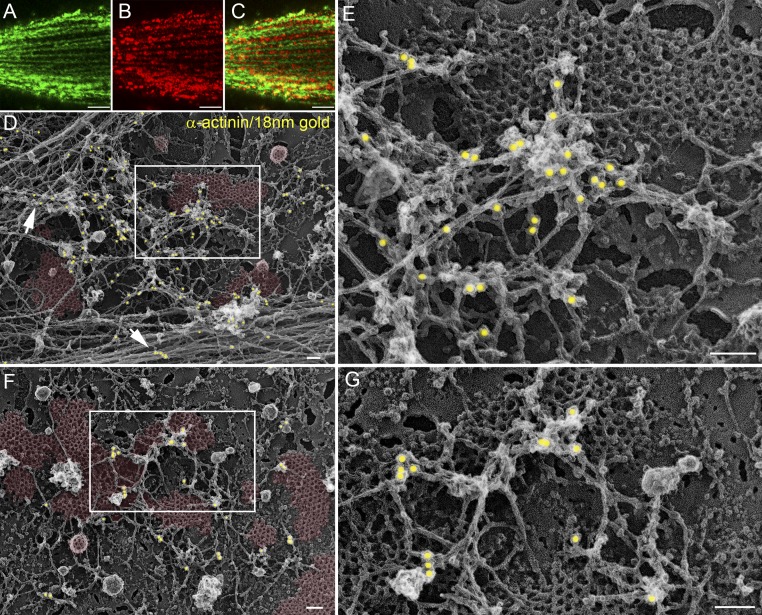
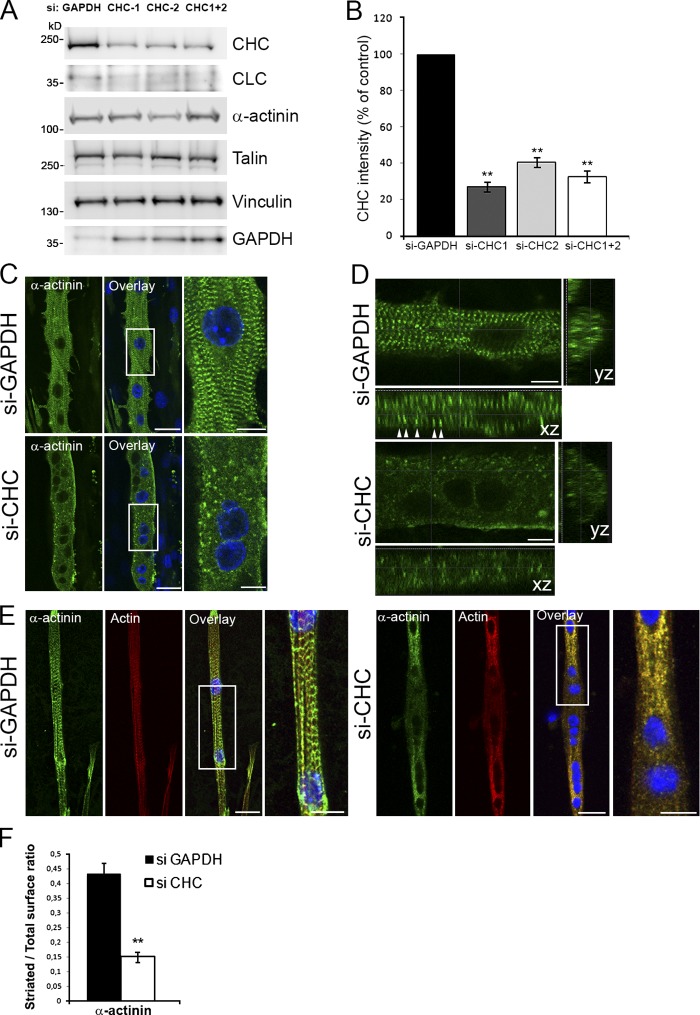
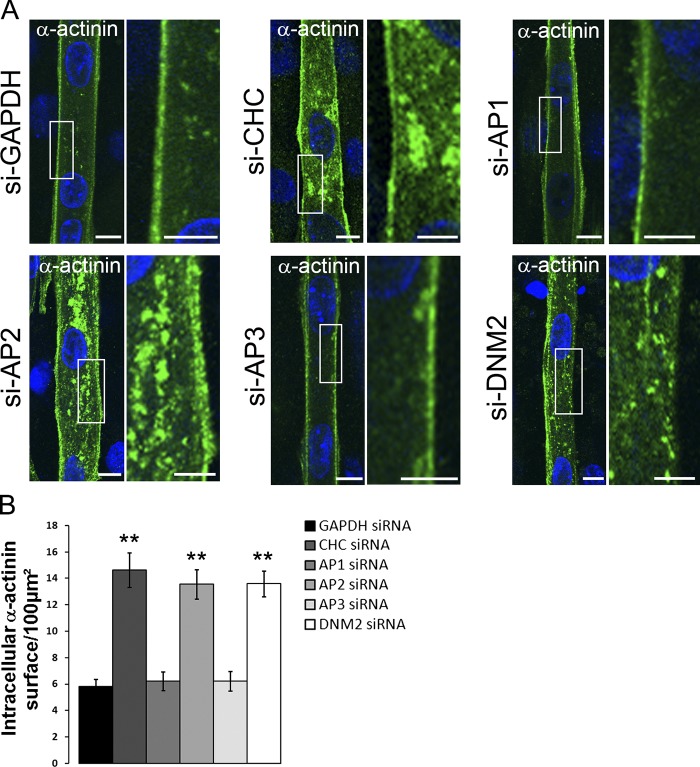
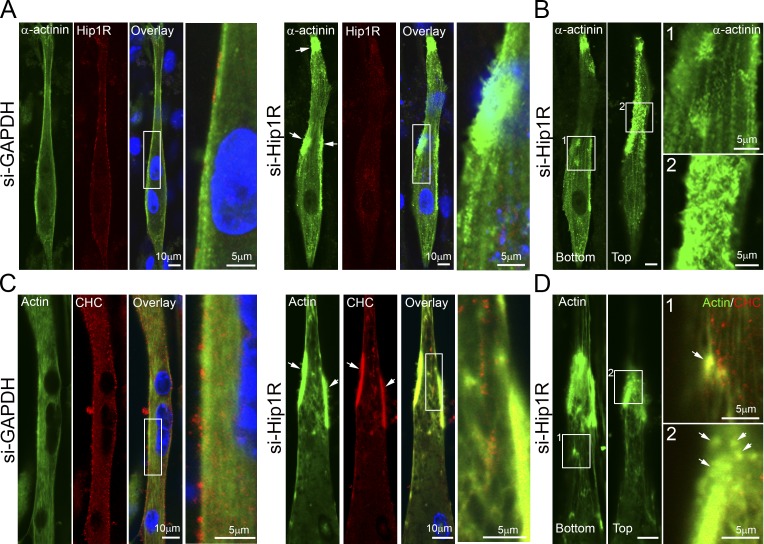
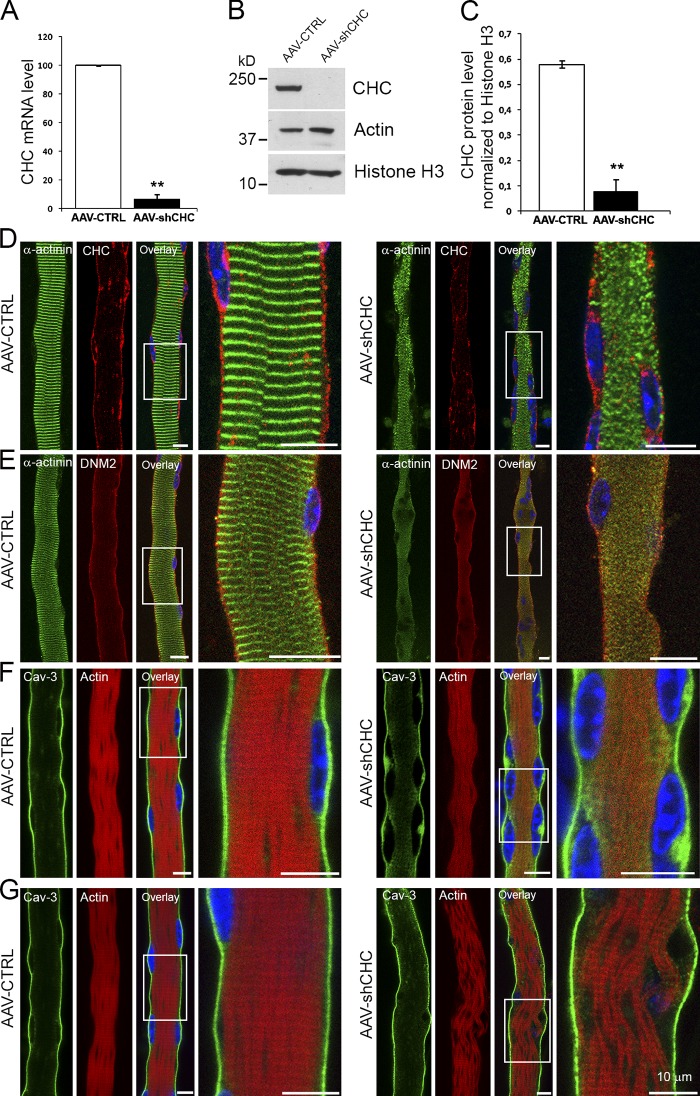
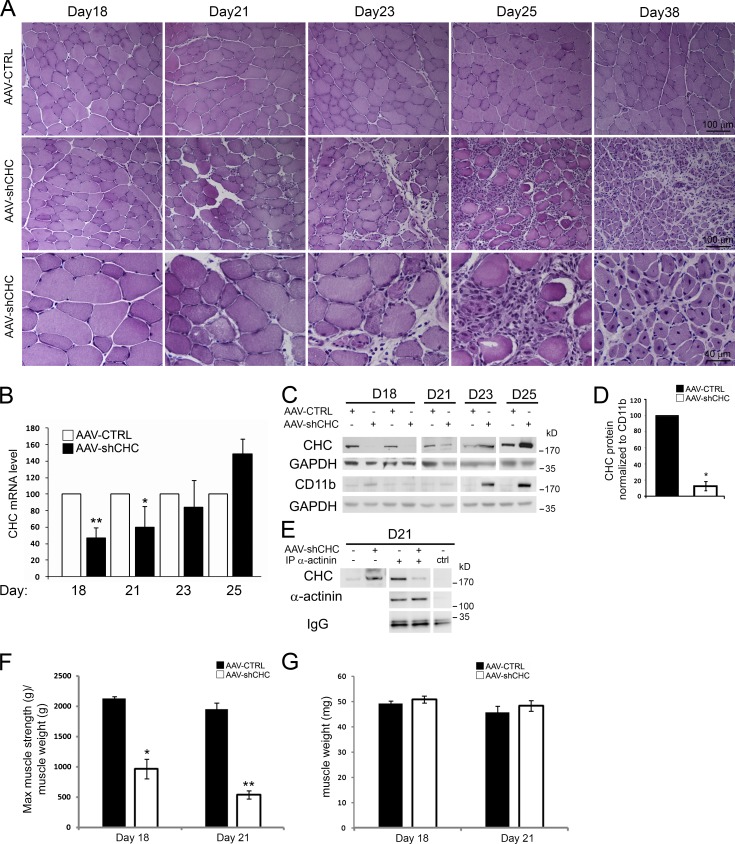
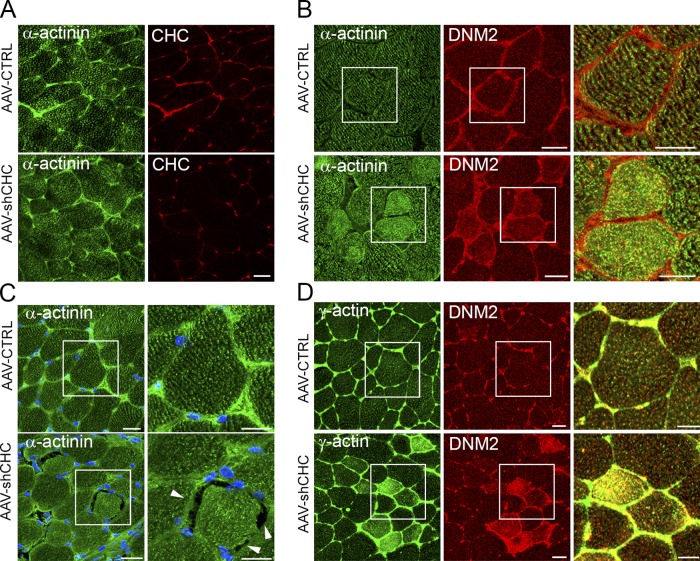
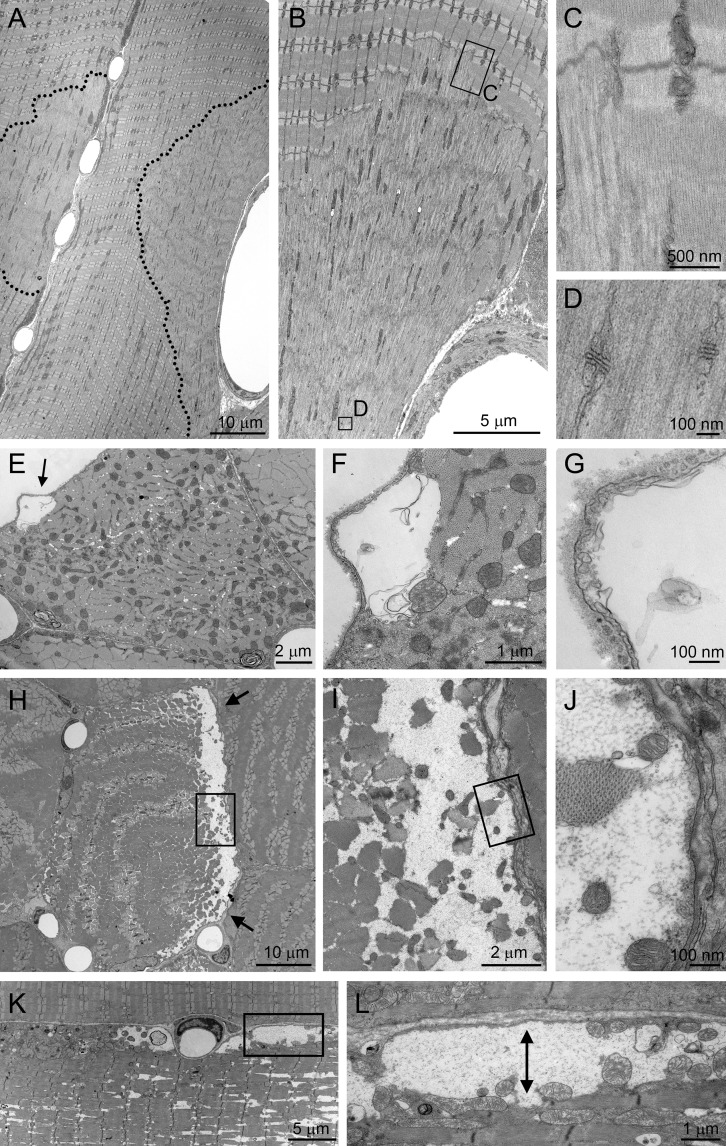
The ubiquitous clathrin heavy chain (CHC), the main component of clathrin-coated vesicles, is well characterized for its role in intracellular membrane traffic and endocytosis from the plasma membrane (PM). Here, we demonstrate that in skeletal muscle CHC regulates the formation and maintenance of PM-sarcomere attachment sites also known as costameres. We show that clathrin forms large coated lattices associated with actin filaments and the muscle-specific isoform of α-actinin at the PM of differentiated myotubes. Depletion of CHC in myotubes induced a loss of actin and α-actinin sarcomeric organization, whereas CHC depletion in vivo induced a loss of contractile force due to the detachment of sarcomeres from the PM. Our results suggest that CHC contributes to the formation and maintenance of the contractile apparatus through interactions with costameric proteins and highlight an unconventional role for CHC in skeletal muscle that may be relevant to pathophysiology of neuromuscular disorders.


Figures

Figure 1.
Figure 1.
CHC association with α-actinin2 in adult skeletal muscle. (A) Confocal sections of mouse skeletal muscle were processed for double-immunofluorescent labeling of DNM2 (red) and α-actinin (green) or CHC (red) and α-actinin (green). Bars, 10 µm. (B) The fluorescence intensity as a function of distance on the fiber was plotted for eight successive striations, and was reported on the graph for each labeling. The green curve corresponds to the green immunolabeling, and the red curve corresponds to the red labeling. (C and D) CHC localization in mouse dissociated FDB fibers. (C) Confocal sections of fibers processed for immunofluorescent labeling with the monoclonal antibody against CHC (X22, green). Bars: (main panel) 10 µm; (inset) 2 µm. (D) XZ and YZ projections of confocal optical sections illustrated in C. Bars, 10 µm. (E) Immunoblot of proteins associated with CHC, α-actinin (isoform 2), vinculin, or control immunoprecipitates from mouse muscle lysates and 1–5% lysate input. Bands for coimmunoprecipitated CHC, α-actinin (isoform 2), vinculin, talin, or CLC are indicated at the right.
Figure 2.
Figure 2.
CHC association with α-actinin2 and actin at the PM of differentiated myotubes. (A) Localization of α-actinin (green) and CHC (red) in mouse primary myotubes differentiated for 4 d. Inset in Overlay panel is displayed on the right. (B) Immunoblot analysis of proteins associated with CHC or control immunoprecipitates from subcellular fractions (plasma membrane, PM and cytosol, CYT) of 3T3 fibroblasts (FB), undifferentiated C2C12 (MB), and differentiated C2C12 cells (MT). (C) Immunoblot analysis of proteins associated with α-actinin or control immunoprecipitates from subcellular fractions (PM and CYT) of 3T3 fibroblasts (FB), undifferentiated C2C12 (MB), and differentiated C2C12 cells (MT). (D) Confocal microscopy of AP2 (green) and CHC (red) in differentiated C2C12 skeletal muscle cells. The left panel displays images from the top of the myotube and the right panel displays images from the middle of the myotube. Arrows indicate large clusters of colocalization between AP2 and CHC and arrowheads indicate intracellular clusters near the nuclei positive for CHC and negative for AP2. (E) XZ and YZ projections of serial confocal sections are shown on the overlay. Bar, 10 µm.
Figure 3.
Figure 3.
α-Actinin and actin are localized on large flat clathrin-coated plaques. (A–C) Immunofluorescent staining of α-actinin (A), CHC (B), and merged images (C) in untreated differentiated primary mouse myotubes visualized using confocal microscopy. Bars, 5 µm. (D–G) Adherent plasmalemmal sheets prepared from control primary myotubes differentiated for 4 d and labeled with α-actinin antibodies followed by secondary antibodies conjugated to 18-nm colloidal gold particles. Gold particles are pseudocolored yellow (D–G) and clathrin lattices are pseudocolored pale red (D and F). The boxed region in D and F is magnified in E and G, respectively. Note that α-actinin is found on both actin cables (D, arrows) and branched filaments lying on top of flat clathrin-coated lattices. Bars, 100 nm.
Figure 4.
Figure 4.
CHC regulates formation and organization of sarcomeres in cultured myotubes. (A) Differentiated C2C12 cells were treated with control GAPDH siRNA, two different siRNA targeting CHC, a mixture of both (CHC-1, CHC-2, CHC-1+2 indicated at the top), and cell lysates immunoblotted for proteins (indicated at the right). (B) CHC expression in cultured C2C12 myotubes treated with GAPDH or CHC siRNA. The graph depicts quantification of CHC band intensity (n = 8 for CHC-1 and n = 4 for CHC-2 and CHC1+2; data are presented as mean ± SEM; **, P < 0.01). (C) α-Actinin staining in differentiated C2C12 skeletal muscle cells treated with control GAPDH siRNA or CHC siRNA. DNA staining (DAPI blue) identifies multinucleated myotubes. The boxed region in the merged images is magnified in the insets. Bars: (main panels) 30 µm; (insets) 10 µm. (D) XZ and YZ projections of serial confocal sections. Bars, 10 µm. (E) CHC depletion on cultured primary mouse myotubes. Immunofluorescent staining of α-actinin (green) and actin (red) in differentiated primary mouse myotubes treated with control GAPDH siRNA or CHC siRNA. DNA staining (DAPI blue) identifies differentiated, multinucleated myotubes. The boxed region in the merged images is magnified in the insets. Bars: (main panels) 20 µm; (insets) 10 µm. (F) Quantification of striated vs. nonstriated surface in control (siRNA against GAPDH) or in myotubes treated with siRNA against CHC (n = 30–60 myotubes, data are presented as mean ± SEM; **, P < 0.01).
Figure 5.
Figure 5.
CHC, AP2, and DNM2 but not AP1 or AP3 depletion in cultured mouse myotubes perturbs α-actinin distribution before striations appear. (A) Differentiated C2C12 myotubes were treated with siRNA targeting proteins (indicated at the left). Immunofluorescent staining of α-actinin in myotubes treated with control siRNA against GAPDH or siRNA targeting either CHC, AP1, AP2, AP3, or DNM2. DNA staining (DAPI blue) identifies differentiated, multinucleated myotubes. The boxed region in the merged images is magnified in the insets. Bars: (main panels) 10 µm; (insets) 5 µm. (B) Quantification of α-actinin fluorescence surface as a function of total myotube surface in 4-d differentiated myotubes treated with siRNA against GAPDH, CHC, AP1, AP2, AP3, or DNM2 (n = 30–50 myotubes, data are presented as mean ± SEM; **, P < 0.01).
Figure 6.
Figure 6.
Hip1R depletion in cultured myotubes stabilizes actin and α-actinin on clathrin-coated structures. (A) Immunofluorescent staining of α-actinin (green) and Hip1R (red) in differentiated C2C12 myotubes treated with control siRNA against GAPDH or siRNA targeting Hip1R. DNA staining (DAPI blue) identifies differentiated, multinucleated myotubes. The boxed region in the merged images is magnified in the insets. Bars: (main panels) 10 µm; (insets) 5 µm. (B) α-Actinin localization in differentiated C2C12 skeletal muscle cells treated with siRNA targeting Hip1R. The left panel displays an image from the bottom of the myotube and the right panel displays an image from the top of the myotube. The boxed regions in the images are magnified in the insets 1 and 2. Bars: (main panels) 10 µm; (insets) 5 µm. (C) Immunofluorescent staining of actin and CHC in myotubes treated with control siRNA against GAPDH or siRNA targeting Hip1R. DNA staining (DAPI blue) identifies differentiated, multinucleated myotubes. The boxed region in the merged images is magnified in the insets. Bars: (main panels) 10 µm; (insets) 5 µm. (D) Actin localization in differentiated C2C12 skeletal muscle cells treated with siRNA targeting Hip1R. The left panel displays an image from the bottom of the myotube and the right panel displays an image from the top of the myotube. The boxed regions in the images are magnified in the insets (1 and 2) and include CHC staining (red). Bars: (main panels) 10 µm; (insets) 5 µm. Arrows in A, C, and D indicate large peripheral clusters of α-actinin or actin and CHC.
Figure 7.
Figure 7.
CHC is required for sarcomere maintenance in adult fibers. (A) Quantitative RT-PCR and (B) Western blot analysis of CHC levels and proteins indicated at the right in FDB fibers infected with AAV-CTRL or AAV-shCHC for 12 d in vitro. (C) Quantification of Western blot CHC band intensity (n = 3, data are presented as mean ± SEM; for A and C: **, P < 0.01). (D–G) Confocal microscopy of dissociated FDB fibers infected with AAV-CTRL or AAV-shCHC for 12 d and co-stained with antibodies against either α-actinin and CHC (D), α-actinin and DNM2 (E), or F-actin (phalloidin staining) and caveolin-3 (F and G). All bars, 10 μm.
Figure 8.
Figure 8.
CHC depletion using AAV-shCHC in vivo impairs force and causes muscle degeneration. (A) Hematoxylin and eosin staining of AAV-CTRL– or AAV-shCHC–injected muscle at day 18, 21, 23, 25, and 38 after virus injection. (B) RT-qPCR of CHC mRNA levels at different time points after AAV-CTRL or shCHC AAV injection (n = 2–9 mice, data are presented as mean ± SD; *, P < 0.05; **, P < 0.01). (C) CHC protein levels at different time points after AAV-CTRL or shCHC AAV injection. The full time-course of CD11b levels, including the D23 and D25 time points shown here, is shown in Fig. S5 A. (D) Quantification of Western blot CHC band intensity (n = 4 mice at day 18, data are presented as mean ± SEM; *, P < 0.05; Mann-Whitney U test). (E) Immunoblot analysis of proteins associated with α-actinin or control immunoprecipitates of TA muscle lysates injected with AAV expressing a control construct or AAV expressing shCHC at 21 d after injection. (F and G) Measures of the specific maximal force (F) and of the muscle weight (G) of isolated TA muscle injected with AAV expressing a control construct or AAV expressing the shCHC construct (n = 3–5 mice) at either 18 or 21 d after injection. Data are presented as means ± SEM; for F: *, P < 0.05; **, P < 0.01.
Figure 9.
Figure 9.
α-Actinin, γ-actin, and DNM2 distribution is perturbed upon in vivo CHC depletion. (A–D) Confocal microscopy on transverse sections of skeletal muscle processed for double-immunofluorescent labeling using antibodies against (A) CHC (red) and α-actinin (green) at day 18 PI; (B) α-actinin (green) and DNM2 (red); (C) α-actinin (green) and DAPI (blue); (D) and γ-actin (green) and DNM2 (red) at day 21 PI. The boxed region in the merged images is magnified in the insets. Arrowheads point at regions of the fiber where the α-actinin staining is no longer associated with the sarcolemma. Bars: (main panels) 30 µm; (insets) 20 µm.
Figure 10.
Figure 10.
Sarcomeric disorganization and detachment between sarcolemma and myofibrils upon in vivo CHC depletion. Transmission electron microscopy of longitudinal (A–D, K–L) and transverse (E–J) muscle sections from mice injected with AAV-shCHC constructs at day 18 (A–G) and day 25 PI (H–L). In A–D, the sarcomeric apparatus is disorganized in focal regions adjoining the sarcolemma (within the dotted lines in A) and presents streaming and disassembly of the Z-line. C and D are insets of the respective boxed regions in B. In E–G, small detachments between the sarcolemma and the contractile apparatus are visible at day 18 PI. At day 25 PI, large detachments are seen in both transverse (H–J) and longitudinal orientation (K–L). I is an inset of the boxed region in H; J is an inset of the boxed region in I; L is an inset of the boxed region in K. Arrows in E, H, and L indicate detachments.

References

    1. Akisaka T., Yoshida H., Suzuki R., Shimizu K., Takama K. 2003. Clathrin sheets on the protoplasmic surface of ventral membranes of osteoclasts in culture. J. Electron Microsc. (Tokyo). 52:535–543 10.1093/jmicro/52.6.535 - DOI - PubMed
    1. Ayalon G., Davis J.Q., Scotland P.B., Bennett V. 2008. An ankyrin-based mechanism for functional organization of dystrophin and dystroglycan. Cell. 135:1189–1200 10.1016/j.cell.2008.10.018 - DOI - PubMed
    1. Batchelder E.M., Yarar D. 2010. Differential requirements for clathrin-dependent endocytosis at sites of cell-substrate adhesion. Mol. Biol. Cell. 21:3070–3079 10.1091/mbc.E09-12-1044 - DOI - PMC - PubMed
    1. Belkin A.M., Zhidkova N.I., Koteliansky V.E. 1986. Localization of talin in skeletal and cardiac muscles. FEBS Lett. 200:32–36 10.1016/0014-5793(86)80505-1 - DOI - PubMed
    1. Bellve K.D., Leonard D., Standley C., Lifshitz L.M., Tuft R.A., Hayakawa A., Corvera S., Fogarty K.E. 2006. Plasma membrane domains specialized for clathrin-mediated endocytosis in primary cells. J. Biol. Chem. 281:16139–16146 10.1074/jbc.M511370200 - DOI - PubMed

Publication types

MeSH terms