. 2014 May 6:5:3739.
doi: 10.1038/ncomms4739.

High-throughput and combinatorial gene expression on a chip for metabolism-induced toxicology screening

Affiliations

High-throughput and combinatorial gene expression on a chip for metabolism-induced toxicology screening

Seok Joon Kwon et al. Nat Commun. .

Abstract

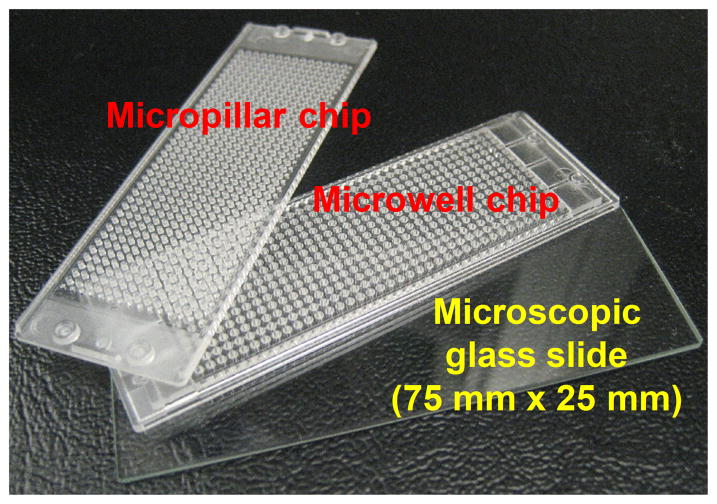
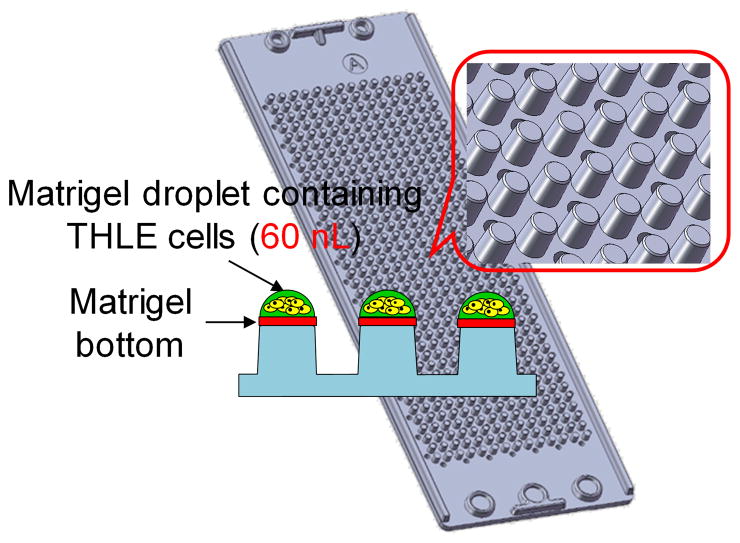
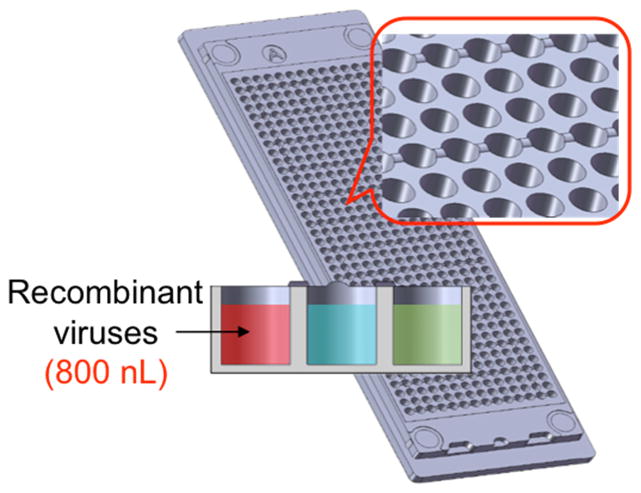
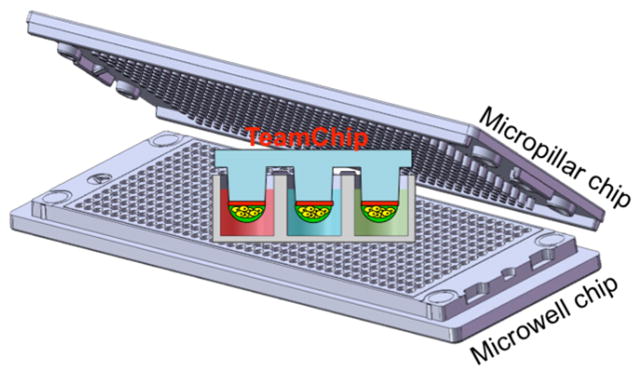
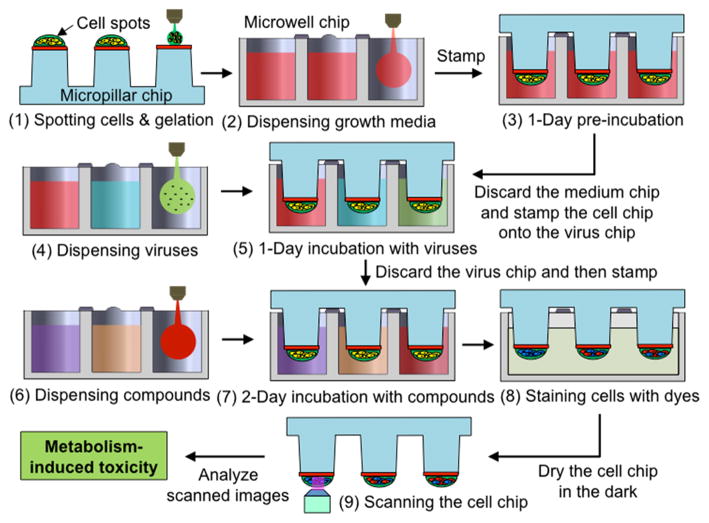
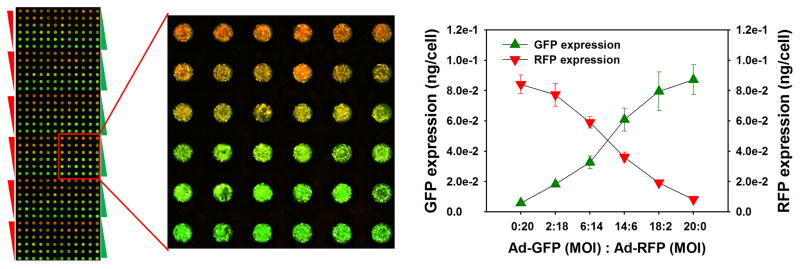
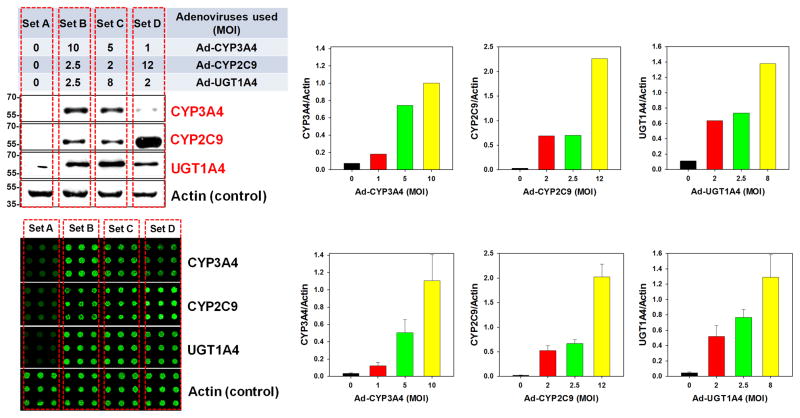
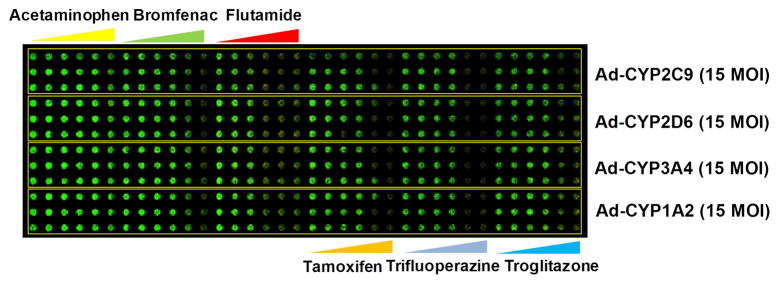
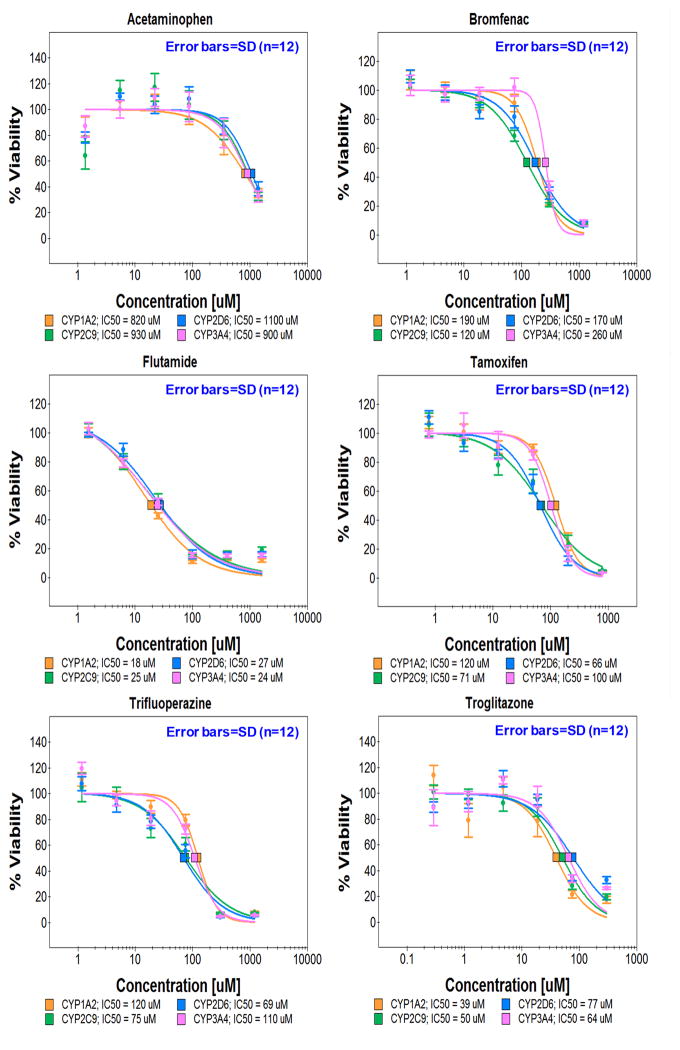
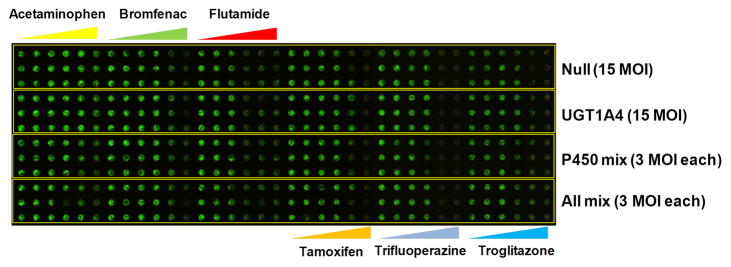
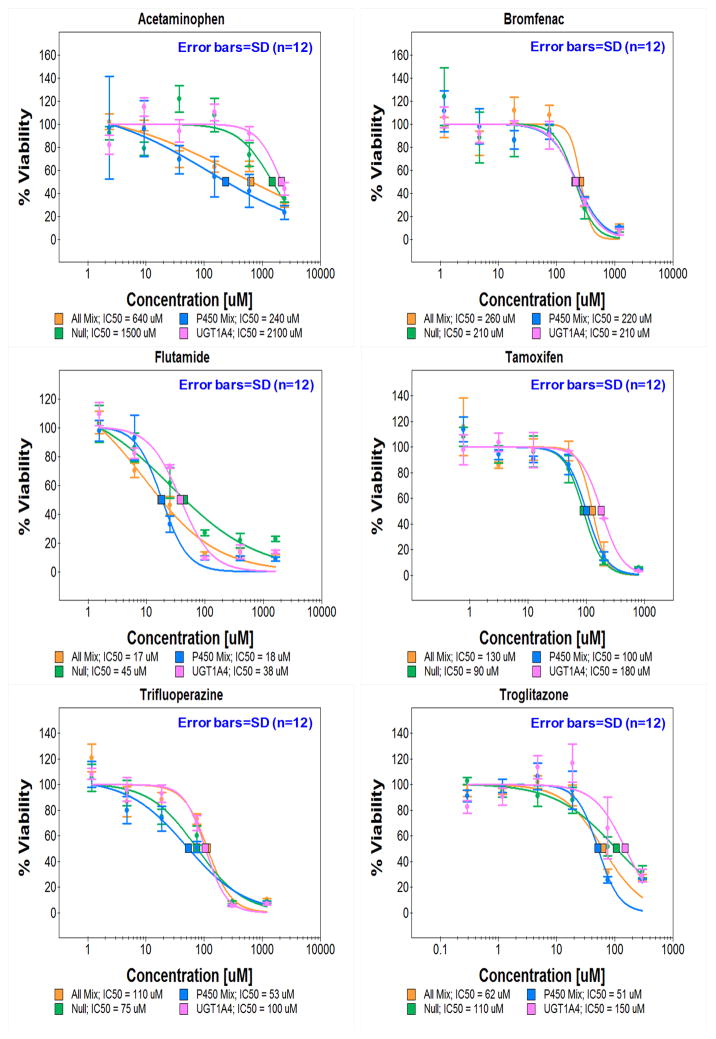
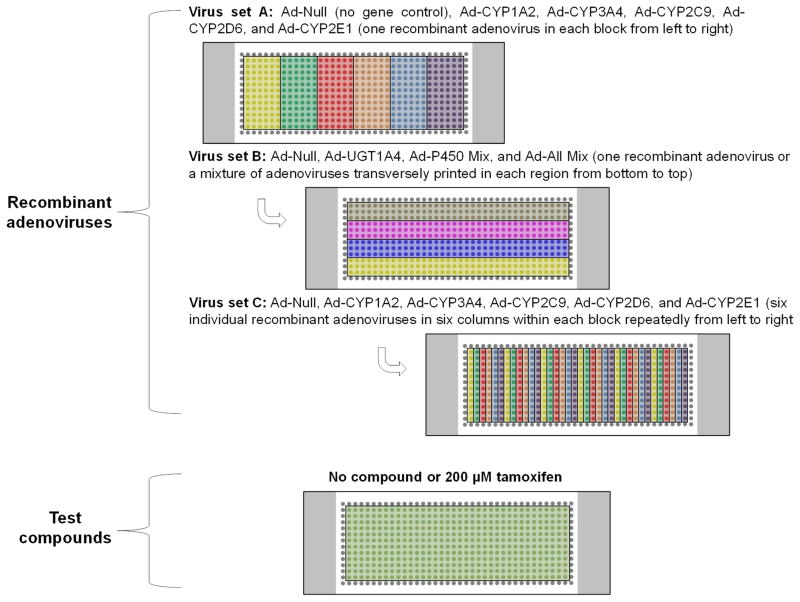
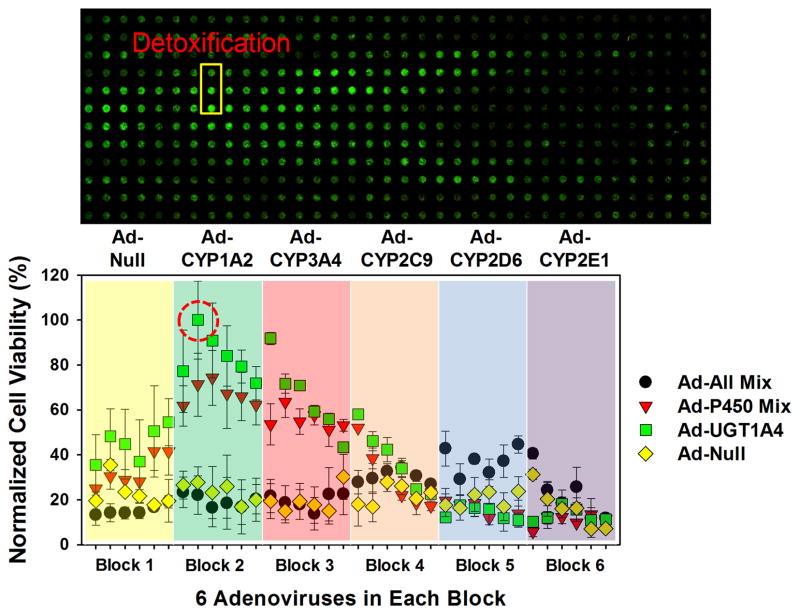
Differential expression of various drug-metabolizing enzymes (DMEs) in the human liver may cause deviations of pharmacokinetic profiles, resulting in interindividual variability of drug toxicity and/or efficacy. Here, we present the 'Transfected Enzyme and Metabolism Chip' (TeamChip), which predicts potential metabolism-induced drug or drug-candidate toxicity. The TeamChip is prepared by delivering genes into miniaturized three-dimensional cellular microarrays on a micropillar chip using recombinant adenoviruses in a complementary microwell chip. The device enables users to manipulate the expression of individual and multiple human metabolizing-enzyme genes (such as CYP3A4, CYP2D6, CYP2C9, CYP1A2, CYP2E1 and UGT1A4) in THLE-2 cell microarrays. To identify specific enzymes involved in drug detoxification, we created 84 combinations of metabolic-gene expressions in a combinatorial fashion on a single microarray. Thus, the TeamChip platform can provide critical information necessary for evaluating metabolism-induced toxicity in a high-throughput manner.


Conflict of interest statement

Competing financial interest

J.S.D. and D.S.C. are co-founders of Solidus Biosciences, Inc. All other authors declare no conflict of interest.

Figures

Figure 1
Figure 1. TeamChip schematics and photographs
(a) Micropillar/microwell chip components in relation to a standard glass microscope slide. (b) The micropillar chip containing THLE-2 cells encapsulated in matrigel droplets. (c) The microwell chip containing recombinant adenoviruses carrying genes for drug metabolizing enzymes (the red color indicates the no-virus control and the two colors represent different viruses). (d) Stamping of the micropillar/microwell chips for drug metabolizing gene expression. (e) Experimental procedure for use of the TeamChip.
Figure 2
Figure 2. Controlled expression of proteins in THLE-2 cells on the TeamChip
(a) Scanned image of the TeamChip containing THLE-2 cells co-expressing GFP and RFP (left) and the expression levels of GFP and RFP in THLE-2 cells achieved by co-transfecting different ratios of adenoviruses carrying genes for GFP (Ad-GFP) and RFP (Ad-RFP) (right). (b) Controlled expression of three drug metabolizing enzymes (CYP3A4, CYP2C9, and UGT1A4) by co-transfecting different ratios of Ad-CYP3A4, Ad-CYP2C9, and Ad-UGT1A4: (top left) Western blot analysis of THLE-2 cell monolayers co-expressing CYP3A4, CYP2C9, and UGT1A4 and (bottom left) In-cell immunofluorescence assay of THLE-2 cells co-expressing CYP3A4, CYP2C9, and UGT1A4 on the chip. Three combinations of MOIs of the three recombinant adenoviruses at a total MOI of 15 (sets B, C, and D) were used to compare the co-expression levels of the three drug-metabolizing enzymes expressed in THLE-2 cells on the TeamChip with those obtained from THLE-2 cell monolayers in 6-well plates. The bar graphs represent the co-expression levels of the three drug-metabolizing enzymes expressed in THLE-2 cell monolayers (top) and THLE-2 cells on the chip (bottom).
Figure 3
Figure 3. Effects of human DMEs expressed in THLE-2 cells on the toxicity of model compounds
(a) Toxicity of six test compounds against THLE-2 cells expressing single drug metabolizing enzymes on the TeamChip: scanned image of the chip containing THLE-2 cells exposed to adenoviruses and compounds. (b) Dose response curves for the six compounds (n = 3, replicated 4 times). (c) Toxicity of six test compounds against THLE-2 cells expressing multiple drug metabolizing enzymes on the chip: scanned image of the chip containing THLE-2 cells exposed to adenoviruses and compounds. (d) Dose response curves for the six compounds (n = 3, replicated 4 times). UGT1A4, P450 Mix, and All Mix were expressed in THLE-2 cells on the chip by exposing Ad-UGT1A4 (15 MOI), Ad-P450 Mix (3 MOI each), and Ad-All Mix (3 MOI each). Adenovirus carrying CMV promoter alone (Ad-Null, no drug metabolizing enzyme expressed) was used as a parent compound-alone control. SD means standard deviations.
Figure 4
Figure 4. Effects of ketoconazole and buthionine sulfoximine (BSO) on CYP3A4-expressing THLE-2 cells on the TeamChip
(a) Toxicity of acetaminophen against THLE-2 cells expressing CYP3A4 on the chip: (top) scanned image of the chip containing THLE-2 cells (control, 15 MOI of Ad-Null) and THLE-2 cells expressing CYP3A4 (15 MOI of Ad-CYP3A4) exposed to 5 μM of ketoconazole as well as 50 μM of BSO in the presence of varying concentrations of acetaminophen for 48 h. (b) Dose response curves for acetaminophen under different conditions (n = 3). The corresponding IC50 values are summarized in Supplementary Table 4. (c) GSH content in THLE-2 cells on the TeamChip: scanned image of the chip after staining with a thiol green dye in the intracellular GSH assay kit. (d) Quantitative analysis of GSH levels in THLE-2 cells on the TeamChip (n = 3). (e) Western blot analysis of nuclear Nrf2 levels in THLE-2 cells exposed to vehicle (0.1 % dimethyl sulfoxide) or different concentrations of acetaminophen for 12 h after transduction with Ad-Null or Ad-CYP3A4 (left). Positive control (293 cells expressing Nrf2) and negative control (293 cells with no Nrf2 expression) were used to authenticate Nrf2 expression (bottom). Actin was probed as a loading control (top right). Abbreviation: C means control (no viral transduction); AAP indicates acetaminophen. (f) Bar graph represents densitometric analysis of nuclear Nrf2 content in AAP-treated THLE-2 cells.
Figure 5
Figure 5. Effects of combinatorial expression of human drug metabolizing enzymes on the toxicity of tamoxifen
(a) Layout of the microwell chip containing 84 combinations of multiple recombinant adenoviruses (three sets of recombinant adenoviruses dispensed sequentially) to prepare the TeamChip for high-throughput gene transduction, and an additional microwell chip containing 200 μM tamoxifen for metabolism-induced toxicity screening. (b) Scanned image of THLE-2 cells expressing 84 combinations of multiple drug metabolizing enzymes on the chip exposed to 200 μM tamoxifen for 48 h (top) and normalized THLE-2 cell viability at different drug metabolizing enzyme expression levels (bottom). The viability of multiple drug metabolizing enzyme-expressing THLE-2 cells exposed to tamoxifen was normalized by the fluorescent intensity of THLE-2 cells incubated in the absence of compound. The least toxic region in the scanned image is highlighted in a yellow box, and the red circle in the graph designates normalized THLE-2 cell viability calculated from the least toxic region.

Similar articles

Cited by

References

    1. Lee MY, Dordick JS. High-throughput human metabolism and toxicity analysis. Curr Opin Biotechnol. 2006;17:619–627. - PubMed
    1. Guengerich FP. Cytochrome P450s and other enzymes in drug metabolism and toxicity. The AAPS J. 2006;8:E101–111. - PMC - PubMed
    1. Nebert DW, Bingham E. Pharmacogenomics: out of the lab and into the community. Trends Biotechnol. 2001;19:519–523. - PubMed
    1. Park BK, et al. Managing the challenge of chemically reactive metabolites in drug development. Nat Rev Drug Discov. 2011;10:292–306. - PubMed
    1. Brandon EF, Raap CD, Meijerman I, Beijnen JH, Schellens JH. An update on in vitro test methods in human hepatic drug biotransformation research: pros and cons. Toxicol Appl Pharmacol. 2003;189:233–246. - PubMed

Publication types

Substances