

Projected land-use change impacts on ecosystem services in the United States
- PMID: 24799685
- PMCID: PMC4034212
- DOI: 10.1073/pnas.1405557111
Projected land-use change impacts on ecosystem services in the United States
Abstract
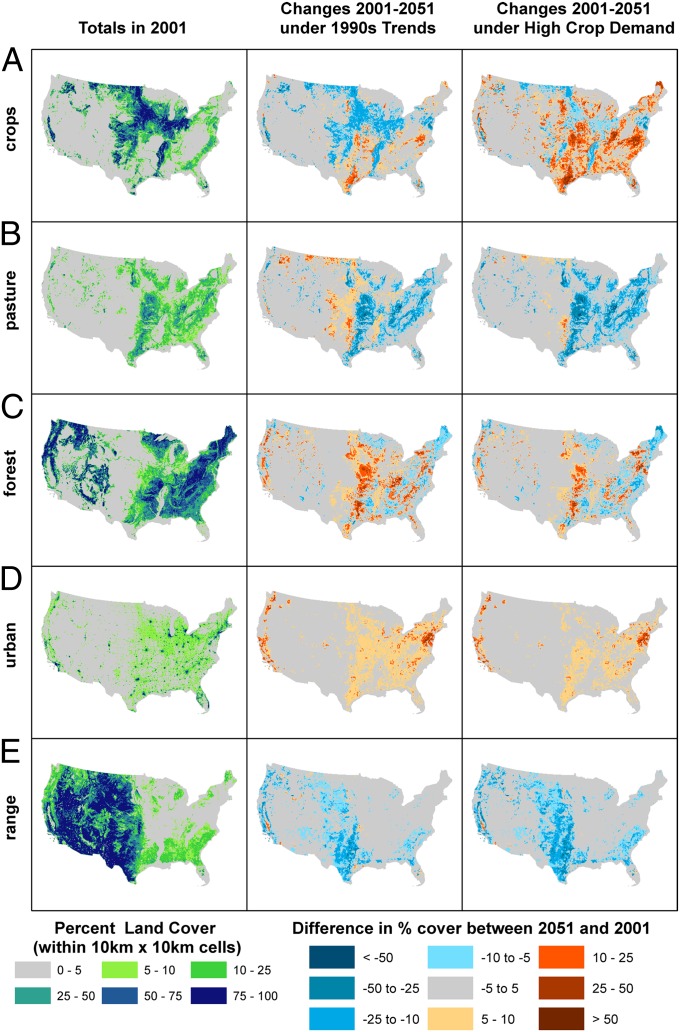
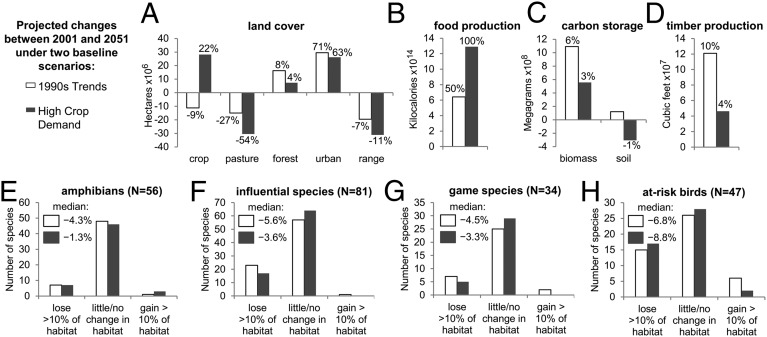
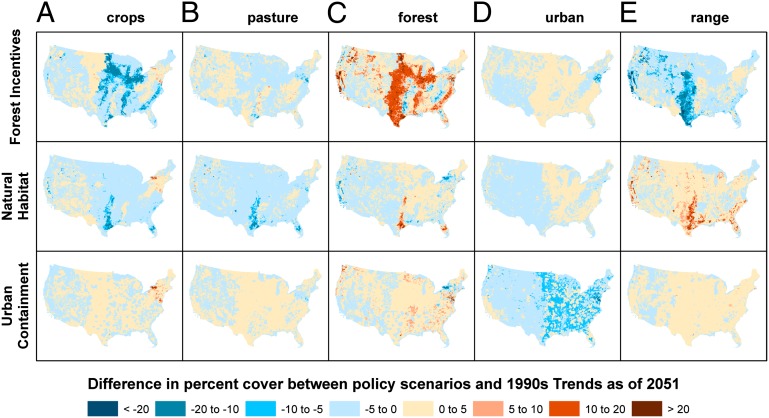
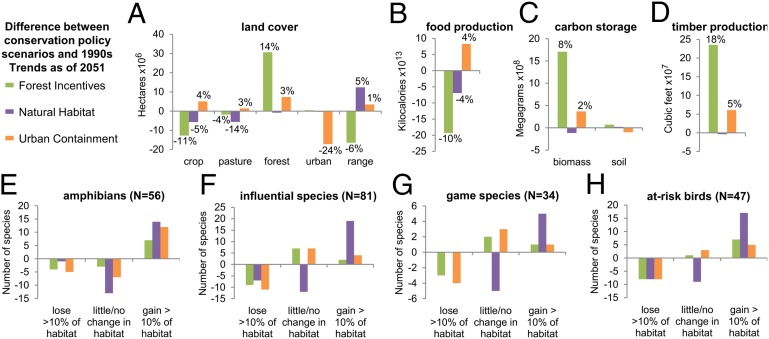
Providing food, timber, energy, housing, and other goods and services, while maintaining ecosystem functions and biodiversity that underpin their sustainable supply, is one of the great challenges of our time. Understanding the drivers of land-use change and how policies can alter land-use change will be critical to meeting this challenge. Here we project land-use change in the contiguous United States to 2051 under two plausible baseline trajectories of economic conditions to illustrate how differences in underlying market forces can have large impacts on land-use with cascading effects on ecosystem services and wildlife habitat. We project a large increase in croplands (28.2 million ha) under a scenario with high crop demand mirroring conditions starting in 2007, compared with a loss of cropland (11.2 million ha) mirroring conditions in the 1990s. Projected land-use changes result in increases in carbon storage, timber production, food production from increased yields, and >10% decreases in habitat for 25% of modeled species. We also analyze policy alternatives designed to encourage forest cover and natural landscapes and reduce urban expansion. Although these policy scenarios modify baseline land-use patterns, they do not reverse powerful underlying trends. Policy interventions need to be aggressive to significantly alter underlying land-use change trends and shift the trajectory of ecosystem service provision.
Keywords: amphibians; at-risk birds; econometric model; game species; incentives.
Conflict of interest statement
The authors declare no conflict of interest.
Figures
References
-
- Millennium Ecosystem Assessment . Ecosystems and Human Well-being Biodiversity Synthesis. Washington, DC: World Resources Inst; 2005.
-
- Nickerson C, Ebel R, Borchers A, Carriazo F. Major Land Uses in the United States, 2007. Economic Research Service, Economic Information Bulletin 89. Washington, DC: US Dept. of Agriculture; 2011.
-
- US Department of Agriculture . Summary Report: 2007 National Resources Inventory. Washington, DC: Natural Resources Conservation Service; 2009.
-
- Lubowski RN, Plantinga AJ, Stavins RN. Land-use change and carbon sinks: Econometric estimation of the carbon sequestration supply function. J Environ Econ Manage. 2006;51:135–152.
-
- Alexandratos N, Bruinsma J. World Agriculture Towards 2030/2050: The 2012 Revision. Rome: Food and Agriculture Organization; 2012.
Publication types
MeSH terms
Substances
LinkOut - more resources
Full Text Sources
Other Literature Sources
