. 2014 May 20;111(20):7456-61.
doi: 10.1073/pnas.1324118111. Epub 2014 May 5.

Rich-club organization of the newborn human brain

Affiliations

Rich-club organization of the newborn human brain

Gareth Ball et al. Proc Natl Acad Sci U S A. .

Abstract

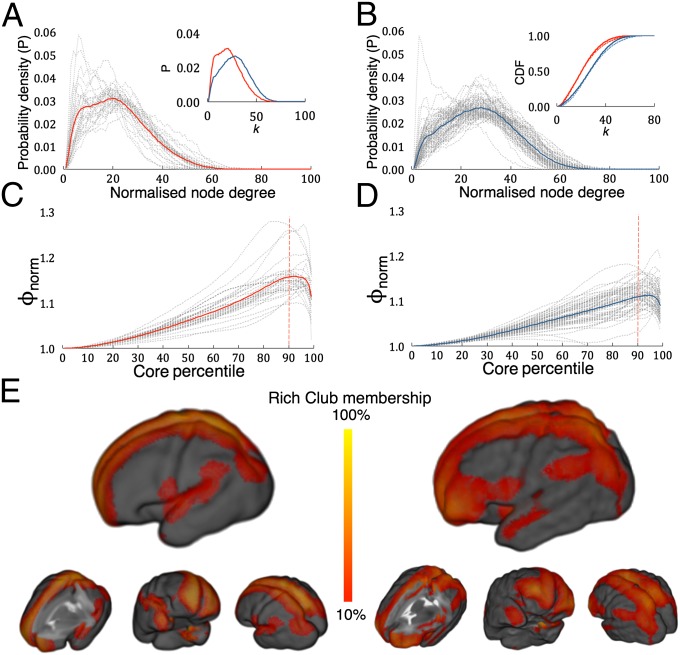
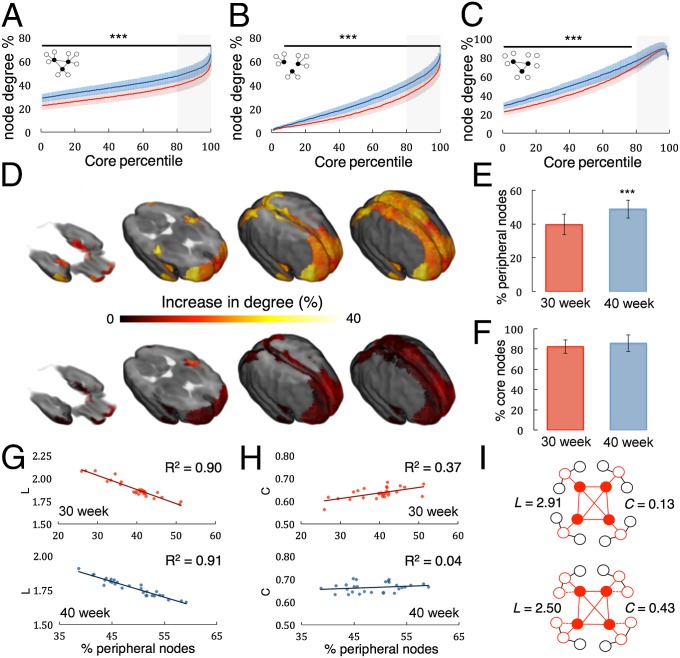
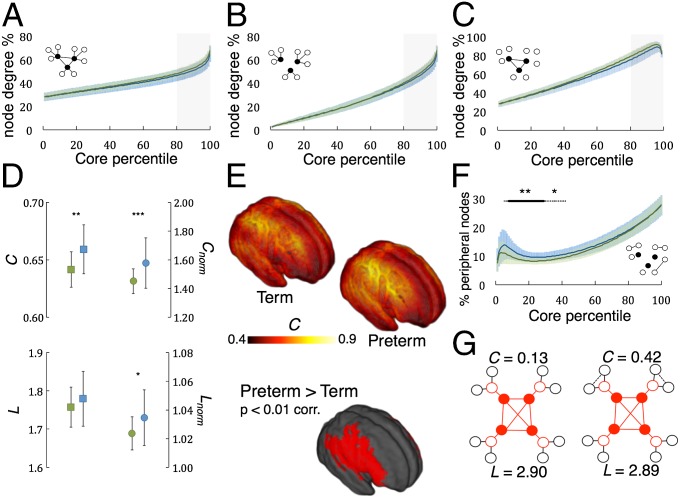
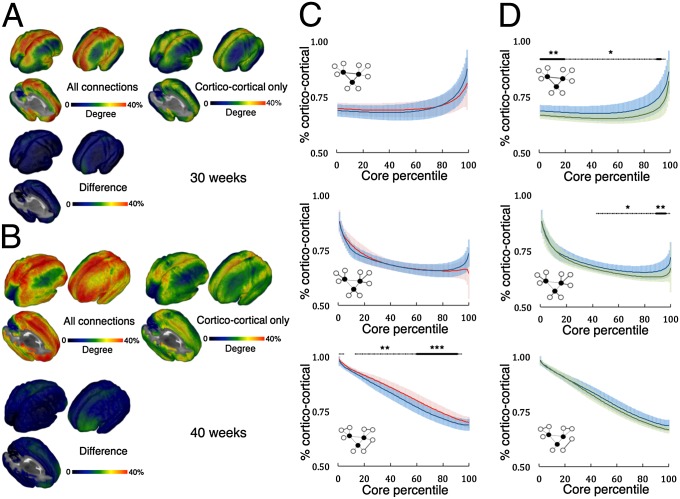
Combining diffusion magnetic resonance imaging and network analysis in the adult human brain has identified a set of highly connected cortical hubs that form a "rich club"--a high-cost, high-capacity backbone thought to enable efficient network communication. Rich-club architecture appears to be a persistent feature of the mature mammalian brain, but it is not known when this structure emerges during human development. In this longitudinal study we chart the emergence of structural organization in mid to late gestation. We demonstrate that a rich club of interconnected cortical hubs is already present by 30 wk gestation. Subsequently, until the time of normal birth, the principal development is a proliferation of connections between core hubs and the rest of the brain. We also consider the impact of environmental factors on early network development, and compare term-born neonates to preterm infants at term-equivalent age. Though rich-club organization remains intact following premature birth, we reveal significant disruptions in both in cortical-subcortical connectivity and short-distance corticocortical connections. Rich club organization is present well before the normal time of birth and may provide the fundamental structural architecture for the subsequent emergence of complex neurological functions. Premature exposure to the extrauterine environment is associated with altered network architecture and reduced network capacity, which may in part account for the high prevalence of cognitive problems in preterm infants.

Keywords: brain development; connectome; preterm birth; tractography.


Conflict of interest statement

The authors declare no conflict of interest.

Figures

Fig. 1.
Fig. 1.
Structural organization of the developing human brain. Mean degree distribution, normalized by the number of nodes in each network, at 30 wk (A, red solid line) and 40 wk (B, blue line), overlaid on individual distributions (dashed lines; n = 28 and 63, respectively). (A, Inset) Distributions at both time points. (B, Inset) Cumulative distribution plots (solid lines) and power law fits (dashed lines). (C and D) Mean normalized rich-club curves (Φnorm) and individual curves (30 wk, C; 40 wk, D). The red dashed line indicates the RC90 rich-club threshold. (E) Maps at both time points showing the membership probabilities of regions belonging to the RC90 network.
Fig. 2.
Fig. 2.
Rich-club organization during the preterm period. Average node degree of core nodes by connection type: (A) all connections, (B) feeder connections, and (C) core connections (normalized by the total number of nodes, number of peripheral nodes, and number of core nodes, respectively). Data show group mean at the 30-wk (red) and 40-wk (blue) time points (n = 28; shading indicates SD). Significant differences are shown with a black bar (post hoc paired t tests: P < 0.001). Gray shading represents the peak rich-club domain. Schematics show connections of interest in each plot. (D) Mean percent increase in node degree due to feeder connections (Upper) and core connections (Lower) in RC90 nodes are compared in E and F. Feeder connectivity of RC90 nodes is related to global network metrics L (characteristic path length) and C (clustering coefficient) at both time points (G and H). Developmental changes in rich-club connectivity are illustrated in I (filled circles are core nodes); adding feeder connections decreases L and increases C.
Fig. 3.
Fig. 3.
Rich-club organization at term-equivalent age. Average node degree of core nodes based on connection type (A) all connections, (B) feeder connections, and (C) core connections (normalized by the total number of nodes, number of peripheral nodes, and number of core nodes, respectively). Data show group mean of preterm infants at term-equivalent age (blue) and term-born controls (green) (shading indicates SD). Gray shading represents rich-club domain. (D) Mean clustering coefficient, C, and average path length, L, for each group (squares; preterm, blue; term, green), circles show normalized values (Cnorm and Lnorm; error bars show SD; *P < 0.05, **P < 0.01, ***P < 0.001 t test). (E) Group mean maps of the clustering coefficient C. Regions where C was significantly higher in the preterm group are shown below (general linear model: 5,000 permutations, P < 0.01 corrected). (F) Local connections of peripheral nodes with a varying threshold for core membership. Significant differences are shown with dashed (*P < 0.05) and solid (**P < 0.01) black lines. The illustrative network (G) shows that increasing the number of edges between peripheral nodes (dashed black lines) increases C but does not affect L.
Fig. 4.
Fig. 4.
Corticocortical connectivity in the rich club. (A and B) Group mean maps of normalized node degree for subjects scanned at the 30 wk (A; n = 28) and 40 wk (B; n = 63). Degree was calculated before (Upper Left) and after (Upper Right) excluding streamlines passing through deep gray matter. (Lower Left) Difference maps. (C) Average core node degree when considering only corticocortical connections as a proportion of node degree when all connections are considered. Core connections (Top), feeder connections (Middle), and local connections (Bottom) are shown separately. Solid lines represent group mean at the early (red) and term (blue) time points (shading represents SD). Post hoc paired t tests at each core level were performed when a main effect of age was found; significant differences are shown with dashed (**P < 0.01) and solid (***P < 0.001) black lines. (D) Comparison of corticocortical connectivity data for all infants scanned at term (blue: preterm at term, n = 46; green: term controls, n = 17). Significant differences are shown with dashed (*P < 0.05) and solid (**P < 0.01) black lines.

References

    1. Felleman DJ, Van Essen DC. Distributed hierarchical processing in the primate cerebral cortex. Cereb Cortex. 1991;1(1):1–47. - PubMed
    1. Markov NT, et al. The role of long-range connections on the specificity of the macaque interareal cortical network. Proc Natl Acad Sci USA. 2013;110(13):5187–5192. - PMC - PubMed
    1. Sporns O, Honey CJ, Kötter R. Identification and classification of hubs in brain networks. PLoS ONE. 2007;2(10):e1049. - PMC - PubMed
    1. Buckner RL, et al. Cortical hubs revealed by intrinsic functional connectivity: Mapping, assessment of stability, and relation to Alzheimer’s disease. J Neurosci. 2009;29(6):1860–1873. - PMC - PubMed
    1. Power JD, Schlaggar BL, Lessov-Schlaggar CN, Petersen SE. Evidence for hubs in human functional brain networks. Neuron. 2013;79(4):798–813. - PMC - PubMed

Publication types

LinkOut - more resources