. 2014 May 6;9(5):e95871.
doi: 10.1371/journal.pone.0095871. eCollection 2014.

Reduced gamma oscillations in a mouse model of intellectual disability: a role for impaired repetitive neurotransmission?

Affiliations

Reduced gamma oscillations in a mouse model of intellectual disability: a role for impaired repetitive neurotransmission?

Andrew D Powell et al. PLoS One. .

Abstract

Intellectual disability affects 2-3% of the population; mutations of the X-chromosome are a major cause of moderate to severe cases. The link between the molecular consequences of the mutation and impaired cognitive function remains unclear. Loss of function mutations of oligophrenin-1 (OPHN1) disrupt Rho-GTPase signalling. Here we demonstrate abnormal neurotransmission at CA3 synapses in hippocampal slices from Ophn1-/y mice, resulting from a substantial decrease in the readily releasable pool of vesicles. As a result, synaptic transmission fails at high frequencies required for oscillations associated with cognitive functions. Both spontaneous and KA-induced gamma oscillations were reduced in Ophn1-/y hippocampal slices. Spontaneous oscillations were rapidly rescued by inhibition of the downstream signalling pathway of oligophrenin-1. These findings suggest that the intellectual disability due to mutations of oligophrenin-1 results from a synaptopathy and consequent network malfunction, providing a plausible mechanism for the learning disabilities. Furthermore, they raise the prospect of drug treatments for affected individuals.


Conflict of interest statement

Competing Interests: The author currently employed by Neusentis-Pfizer Ltd (Dr. P-P Saintot) was not in their employ during the completion of this body of work. As such, Neusentis-Pfizer Ltd has had no input in the generation, analysis and presentation of the data, or intellectual property contained in this manuscript. This does not alter the authors' adherence to all the PLOS ONE policies on sharing data and materials.

Figures

Figure 1
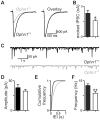
Figure 1. Inhibitory transmission is reduced in CA3 synapses.
(a) Evoked IPSCs were smaller in Ophn1 −/y (grey trace) than Ophn1 +/y (black trace) neurons. Normalisation (right panel) of the Ophn1 −/y evoked IPSC (grey trace) revealed that the kinetics of the eIPSCs were unaltered by genotype. (b) Mean evoked IPSC amplitude for an 18 V stimulus applied to mossy fibre pathway. (c) Spontaneous IPSCs were less frequent in Ophn1 −/y (grey trace) than Ophn1 +/y (black trace) neurons. Cumulative frequency plots (e) showed that spontaneous events in Ophn1 −/y neurons shifted to longer inter-event intervals (IEI, grey line), which resulted in a lower frequency of spontaneous IPSCs (f). (d) The amplitude of spontaneous IPSCs was unaltered. (p:*<0.05, **<0.01). Ophn1 +/y - filled columns, Ophn1 −/y.
Figure 2
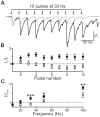
Figure 2. Reduced facilitation in response to high frequency stimulation in Ophn1 −/y neurons.
(a) Representative traces illustrating IPSC summation in response to 10 stimuli delivered at 33 Hz. The responses to first stimuli were normalised. In contrast to Ophn1 +/y neurons, Ophn1 −/y IPSCs (grey trace) showed no summation. (b) IPSC amplitude plotted against stimulus number for 33 Hz trains in Ophn1 +/y (•, n = 20) and Ophn1 −/y neurons (○, n = 14). (c) Maximal IPSC amplitude (mean of the last 5 stimuli) plotted against stimulus frequency. (p: *<0.05, **<0.01, ***<0.001).
Figure 3
Figure 3. RRP is reduced in CA3 synapses.
Evoked IPSCs recorded during a 20Ophn1 +/y (a, black trace) and Ophn1 −/y neuron (grey trace). The traces are averages of 5 sweeps. (b) The corresponding cumulative evoked IPSC amplitude plot (Ophn1+/y,•; Ophn1 −/y,○). Data between 1–2 s were fitted by linear regression and back-extrapolated to time 0 to estimate the RRP size (b, c). (c) The mean amplitude of IPSC1 was unaltered in Ophn1 −/y neurons. (d) Mean Pves was increased in Ophn1 −/y neurons, whilst the mean number of vesicles (Nsyn) forming the RRP was reduced (e) (p: **<0.01, ***<0.005).
Figure 4
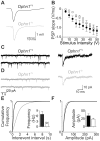
Figure 4. Ophn1 −/y slices show reduced postsynaptic potentials.
(a) Representative traces of postsynaptic potentials from Ophn1 +/y (black traces) and Ophn1 −/y (grey traces) slices. (b) Stimulus response curve of postsynaptic potentials recorded from the s. radiatum of CA3. PSP slopes were significantly smaller in Ophn1 −/y (n = 5) than in Ophn1 +/y slices (n = 12; p = 0.011, ANOVA). Representative traces of spontaneous EPSCs in Ophn1 +/y (c) and Ophn1 −/y (d). Representative individual spontaneous EPSCs are shown in the right panel. Cumulative frequency plots show that the interevent intervals (e), but not amplitude (f) of EPSCs are altered in Ophn1 /y neurons compared to Ophn1 +/y neurons. (inset) Mean frequency and amplitude of spontaneous EPSCs.
Figure 5
Figure 5. Reduced synaptic responses to high frequency stimulation in Ophn1 −/y slices are rescued by ROCK inhibition.
(a) Representative traces illustrating PSP recordings from CA3b s. radiatum in response to 10 stimuli delivered at 33 Hz. The responses to first stimuli were normalised. In contrast to Ophn1 +/y neurons, Ophn1 −/y PSPs showed no potentiation, but were rescued by superfusion with Y-27632 (10 µM; 20 minutes). (b) PSP slope plotted against stimulus number for 33 Hz trains in Ophn1 +/y slices under control conditions (black symbols) and 20 minutes after Y-27632 application (dark grey symbols, n = 11). The reduced facilitation in Ophn1 −/y slices (open symbols) was rescued by 20 minute application of Y-27632 (light grey symbols, n = 11). (c) Potentiation of PSP evoked by the 2nd stimuli was reduced in Ophn1 −/y slices and rescued by Y-27632 (right panel). (d) Synaptic depression (average PSP for pulses 8–10) was enhanced in Ophn1 −/y slices and rescued by Y-27632 (right panel).
Figure 6
Figure 6. Spontaneous gamma oscillations are reduced in Ophn1 −/y slices.
(a) Representative traces from Ophn1 +/y (black traces) and Ophn1 −/y (grey traces) slices. The power of spontaneous gamma oscillations was reduced in Ophn1 −/y slices (b). Grey shading indicates s.e.m. Normalisation (d) of the Ophn1 −/y average gamma waveform (c) revealed that the kinetics of the spontaneous gamma oscillations were unaltered by genotype.
Figure 7
Figure 7. Smaller gamma oscillations in Ophn1 −/y slices.
(a) Application of 50 nM KA induced neuronal synchrony in the gamma frequency range; the power of these oscillations increased over time (e). (b) Spectrogram illustrating the development of the dominant frequency of gamma oscillations in Ophn1 +/y (left panel) and Ophn1 −/y (right panel) slices. (c) Power spectra for Ophn1 +/y (left panel) and Ophn1 −/y (right panel) slices at t = 60 minutes. (d) The peak frequency did not differ significantly between Ophn1 +/y (•) and Ophn1 −/y (○) slices. (e) Summated power of gamma oscillations was reduced in Ophn1 −/y slices.
Figure 8
Figure 8. Gamma oscillation synchrony and coherence unchanged in Ophn1 −/y slices.
(a) Average gamma waveforms for Ophn1 +/y (black trace) and Ophn1 −/y (grey trace) slices revealed a reduced amplitude without alteration in gamma waveform kinetics (b; grey trace, normalised Ophn1 −/y). The reduced gamma power in Ophn1 −/y slices was not associated with an altered spatial distribution; (c) waveform averages phase-zeroed at the peak of the oscillation recorded from CA3c (black trace), CA3b (dotted trace), CA3a (short dashed trace) and CA1 (long dashed trace) in an Ophn1 +/y slice. (d) Cross-correlation (left panel) and phase lead (right panel) for CA regions with CA3c as the reference, data are expressed as mean±s.e.m. No differences were observed between Ophn1 +/y (filled symbols) and Ophn1 −/y (open symbols) slices.
Figure 9
Figure 9. KA-induced and spontaneous gamma oscillations are differentially affected by ROCK inhibition.
Y–27632 (10 µM) was applied for 20 minutes prior to application of KA (50 nM). (a) Oscillations recorded at 60 minutes post KA application were reduced by Y-27632 application. In contrast, spontaneous oscillations recorded prior to KA application were enhanced in Ophn1 −/y slices (b) (p: *<0.05, ***<0.005).

References

    1. Chelly J, Khelfaoui M, Francis F, Cherif B, Bienvenu T (2006) Genetics and pathophysiology of mental retardation. Eur J HumGenet 14: 701–713. - PubMed
    1. Bianchi V, Farisello P, Baldelli P, Meskenaite V, Milanese M, et al. (2009) Cognitive impairment in Gdi1 deficient mice is associated with altered synaptic vesicle pools and short-term synaptic plasticity, and can be corrected by appropriate learning training. Human Molecular Genetics 18: 105–117. - PMC - PubMed
    1. Monteggia LM, Kavalali ET (2009) Rett Syndrome and the Impact of MeCP2 Associated Transcriptional Mechanisms on Neurotransmission. Biological Psychiatry 65: 204–210. - PMC - PubMed
    1. Powell AD, Gill KK, Saintot PP, Jiruska P, Chelly J, et al. (2012) Rapid reversal of impaired inhibitory and excitatory transmission but not spine dysgenesis in a mouse model of mental retardation. Journal of Physiology 590: 763–776. - PMC - PubMed
    1. Herrmann CS, Munk MH, Engel AK (2004) Cognitive functions of gamma-band activity: memory match and utilization. Trends Cogn Sci 8: 347–355. - PubMed

Publication types

MeSH terms