. 2014 May 6;9(5):e96361.
doi: 10.1371/journal.pone.0096361. eCollection 2014.

Bone microstructure and regional distribution of osteoblast and osteoclast activity in the osteonecrotic femoral head

Affiliations

Bone microstructure and regional distribution of osteoblast and osteoclast activity in the osteonecrotic femoral head

Cheng Wang et al. PLoS One. .

Abstract

Objective: To detect and compare the bone microstructure and osteoblast and osteoclast activity in different regions of human osteonecrotic femoral heads.

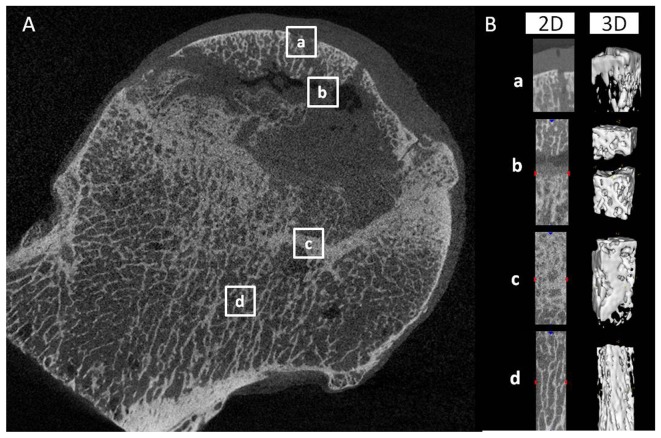
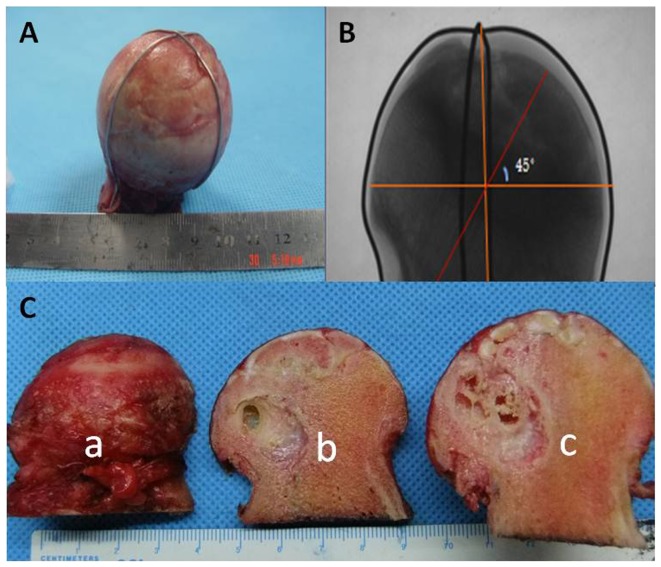
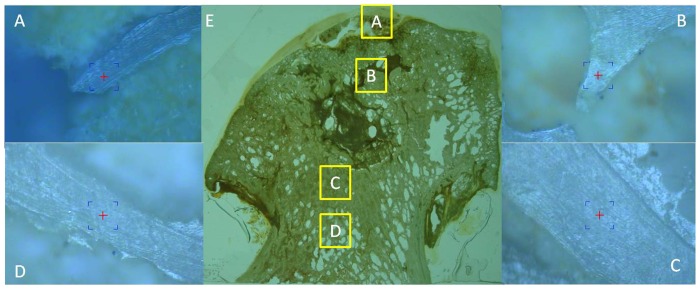
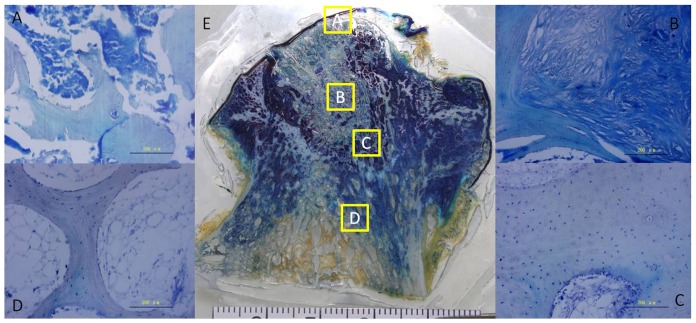
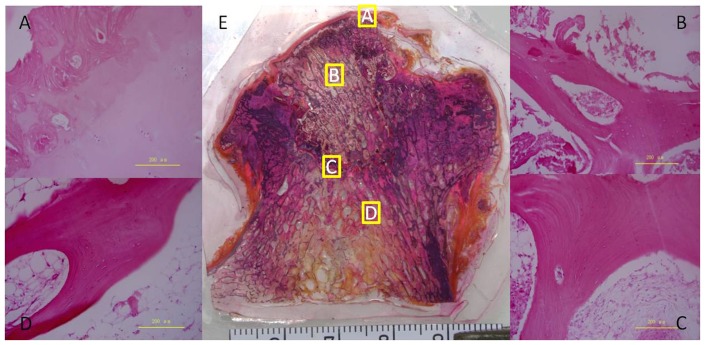
Methods: Osteonecrotic femoral heads were obtained from 10 patients (6 males, 4 females; Ficat IV) undergoing total hip arthroplasty between 2011 and 2013. The samples were divided into subchondral bone, necrotic, sclerotic, and healthy regions based on micro-computed tomography (CT) images. The bone microstructure, micromechanics, and osteoblast and osteoclast activity were assessed using micro-CT, pathology, immunohistochemistry, nanoindentation, reverse transcription polymerase chain reaction (RT-PCR), tartrate-resistant acid phosphatase staining and Western blotting.

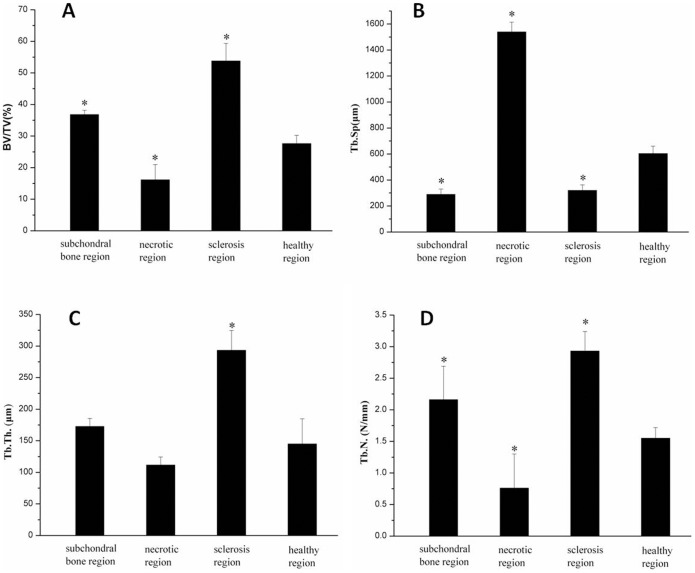
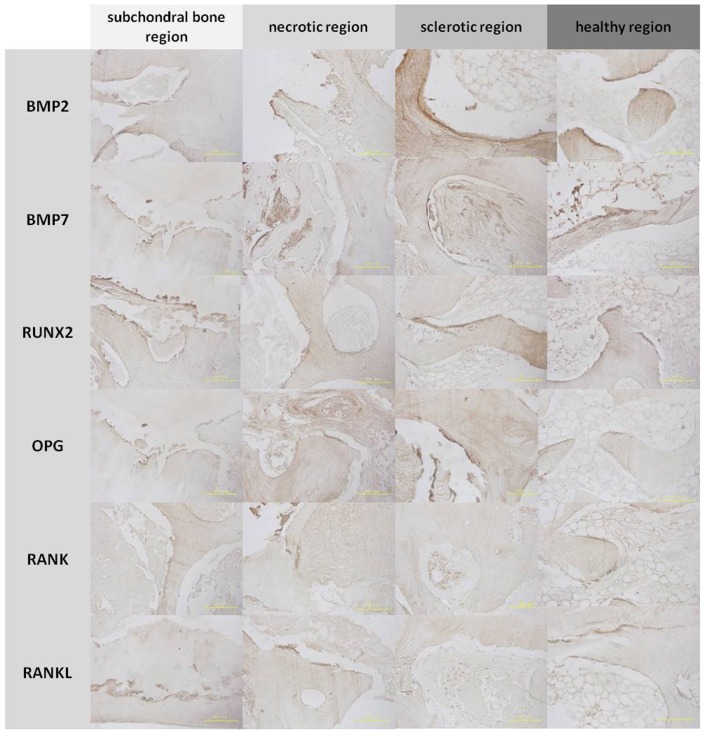
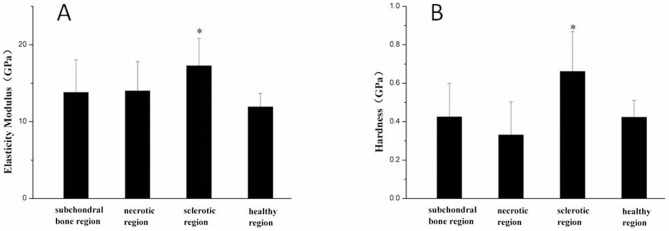
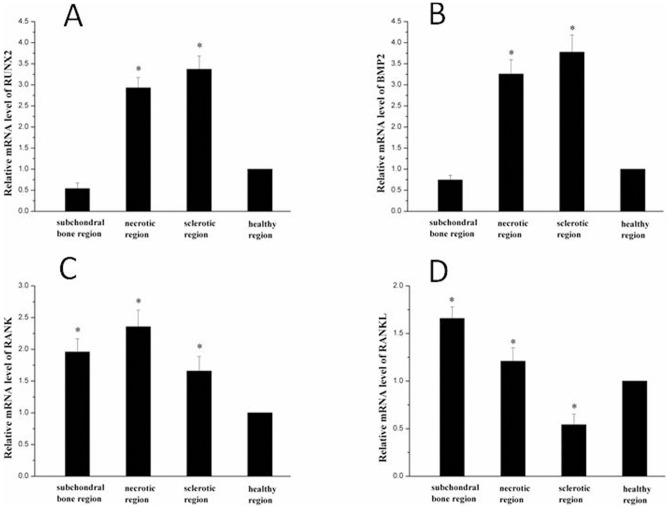
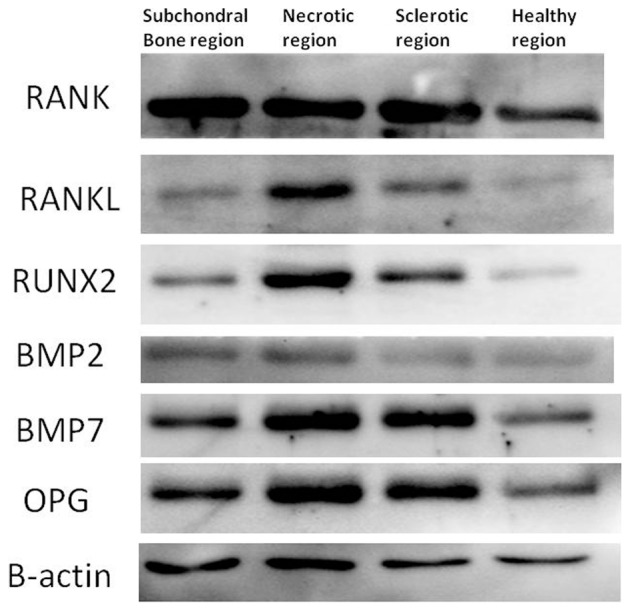
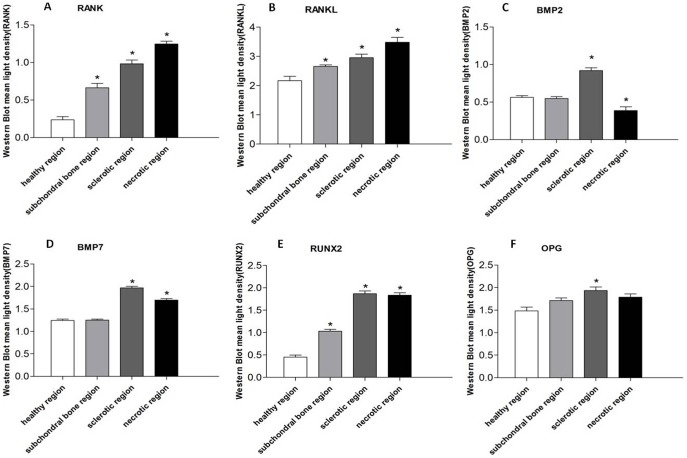
Results: (1) The spatial structure of the bone trabeculae differed markedly in the various regions of the osteonecrotic femoral heads. (2) The elastic modulus and hardness of the bone trabeculae in the healthy and necrotic regions did not differ significantly (P >0.05). (3) The subchondral bone and necrotic region were positive on TRAP staining, while the other regions were negative. (4) On immunohistochemical staining, RANK and RANKL staining intensities were increased significantly in the subchondral bone and necrotic region compared with the healthy region, while RUNX2 and BMP2 staining intensities were increased significantly in the sclerotic region compared with the necrotic region. (5) OPG, RANK, RANKL, RUNX2, BMP2, and BMP7 protein levels were greater in the necrotic and sclerotic region than in subchondral bone and the healthy region.

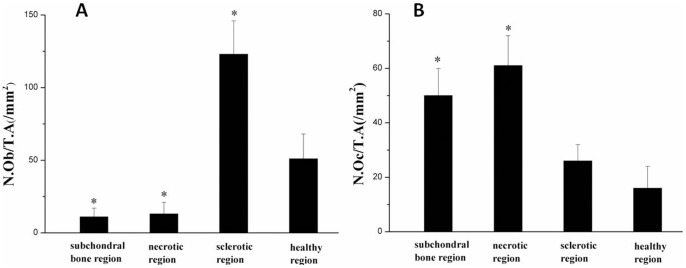
Conclusion: The micromechanical properties of bone trabeculae in the necrotic region did not differ significantly from the healthy region. During the progress of osteonecrosis, the bone structure changed markedly. Osteoclast activity increased in subchondral bone and the necrotic region while osteoblast activity increased in the sclerotic region. We speculate that the altered osteoblast and osteoclast activity leads to a reduction in macroscopic mechanical strength.


Conflict of interest statement

Competing Interests: The authors have declared that no competing interests exist.

Figures

Figure 1
Figure 1. Two-dimensional slices and three-dimensional reconstruction of micro-CT images of the femoral heads.
(A) Two-dimensional slices of micro-CT images of the subchondral bone (a), necrotic (b), sclerotic (c), and healthy(d) regions were distinguished according to bone mineral density. (B) The two-dimensional and three-dimensional reconstructed image of the white box regions.
Figure 2
Figure 2. Cutting method of the femoral heads.
The femoral heads were marked with an iron wire in the coronal plane and subjected to X-ray to confirm that all of the samples showed similar processes (A, B). The samples were divided into three parts: a for paraffin sections, b for real-time PCR and Western blotting, and c for undecalcified tissue sectioning and nanoindentation (C, D).
Figure 3
Figure 3. Indent positions in the nanoindentation test.
Non-decalcified femoral head slices (E) of 10 randomly selected points in bone trabeculae in the subchondral bone (A), necrotic (B), sclerotic (C), and healthy(D) regions.
Figure 4
Figure 4. Quantitative micro-CT measurements.
Measurements of (A) bone volume fraction (BV/TV), (B) trabecula space (Tb. Sp.), (C) trabecula thickness (Tb. Th.), (D) trabecula number (Tb. N.) in different regions. *P < 0.05 compared with healthy region.
Figure 5
Figure 5. Toluidine blue staining of undecalcified and decalcified bone tissue.
Toluidine blue staining of a paraffin section of the subchondral bone (A), necrotic (B), sclerotic (C), and healthy(D) regions. Toluidine blue staining of an undecalcified bone tissue slice of an entire section (E).
Figure 6
Figure 6. H&E staining of undecalcified and decalcified bone tissue.
HE staining of a paraffin section of the subchondral bone (A), necrotic (B), sclerotic (C), and healthy(D) regions. HE staining of an undecalcified bone tissue slice of an entire section (E).
Figure 7
Figure 7. Immunohistochemistry of bone trabeculae in the regions of the femoral head.
Bone morphogenetic protein 2 (BMP2), bone morphogenetic protein 7 (BMP7), Runt-related transcription factor 2 (RUNX2), and osteoprotegerin (OPG) were expressed in the bone matrix of trabeculae in the sclerotic and healthy regions. Receptor activator of nuclear factor-κB (RANK) and receptor activator of nuclear factor-κB ligand (RANKL) were expressed in the bone matrix of trabeculae in the subchondral bone and necrotic regions.
Figure 8
Figure 8. Histology of tartrate-resistant acid phosphatase (TRAP) staining.
Black arrows indicated TRAP-positive cells in the subchondral bone (A) and necrotic regions (B). A reduced number of ALP-positive cells was observed in the sclerotic (C) and healthy (D) regions. TRAP staining of an undecalcified bone tissue slice of an entire section (E).
Figure 9
Figure 9. Histology of alkaline phosphatase (ALP) staining.
A reduced number of ALP-positive cells were observed in the subchondral bone (A) and necrotic regions (B). Red arrows indicate ALP-positive cells in the sclerotic (C) and healthy (D) regions.
Figure 10
Figure 10. Quantitative analysis of the number of osteoblasts and osteoclasts.
(A) The number of osteoblasts per unit tissue area in the subchondral bone, necrotic, sclerotic and healthy regions (N.Ob/T.A mm2); (B) The number of osteoclasts per unit tissue area in the subchondral bone, necrotic, sclerotic and healthy regions (N.Oc/T.A mm2) * P < 0.05 compared with the healthy region.
Figure 11
Figure 11. The elastic modulus and hardness of bone trabeculae in various regions.
The elastic modulus (A) and hardness (B) in the various regions of the femoral head. *P < 0.05 compared with the healthy region.
Figure 12
Figure 12. PCR results.
The expression of RUNX2 (A) and BMP2 (C) was greatest in the sclerotic region (P< 0.05). The expression of RANKL (B) was greatest in the subchondral bone region (P < 0.05) and the expression of RANK was greatest in the necrotic region (D) (P < 0.05). *P < 0.05 compared with healthy region.
Figure 13
Figure 13. Western blot results.
The expressions of RANK, RANKL, OPG, RUNX2, BMP2, and BMP7 were greater in the subchondral bone (A),necrotic (B) and sclerotic(C) regions than healthy(D) region, and highest in the necrotic region (B).
Figure 14
Figure 14. Quantitative results of Western blot analysis for the expression of RANK, RANKL, BMP2, BMP7, RUNX2, and OPG.
The expressions of RANK (A) and RANKL (B) were higher in the sclerotic region compared to the healthy region, and highest in the necrotic region (P < 0.05). The expressions of BMP2 (C), BMP7 (D), RUNX2 (E), and OPG (F) were higher in the necrotic region compared to the healthy region and highest in the sclerotic region (P < 0.05). *P < 0.05 compared to the healthy region.

References

    1. Amanatullah DF, Strauss EJ, Di Cesare PE (2011) Current management options for osteonecrosis of the femoral head: part 1, diagnosis and nonoperative management. Am J Orthop (Belle Mead NJ) 40: E186–192. - PubMed
    1. Amanatullah DF, Strauss EJ, Di Cesare PE (2011) Current management options for osteonecrosis of the femoral head: part II, operative management. Am J Orthop (Belle Mead NJ) 40: E216–225. - PubMed
    1. Lee SH, Rho J, Jeong D, Sul JY, Kim T, et al. (2006) v-ATPase V0 subunit d2-deficient mice exhibit impaired osteoclast fusion and increased bone formation. Nat Med 12: 1403–1409. - PubMed
    1. Kubota K, Sakikawa C, Katsumata M, Nakamura T, Wakabayashi K (2002) Platelet-derived growth factor BB secreted from osteoclasts acts as an osteoblastogenesis inhibitory factor. J Bone Miner Res 17: 257–265. - PubMed
    1. Ammann P, Badoud I, Barraud S, Dayer R, Rizzoli R (2007) Strontium ranelate treatment improves trabecular and cortical intrinsic bone tissue quality, a determinant of bone strength. J Bone Miner Res 22: 1419–1425. - PubMed

Publication types

MeSH terms

Substances

LinkOut - more resources