

The role of environmental heterogeneity in meta-analysis of gene-environment interactions with quantitative traits
- PMID: 24801060
- PMCID: PMC4108593
- DOI: 10.1002/gepi.21810
The role of environmental heterogeneity in meta-analysis of gene-environment interactions with quantitative traits
Abstract
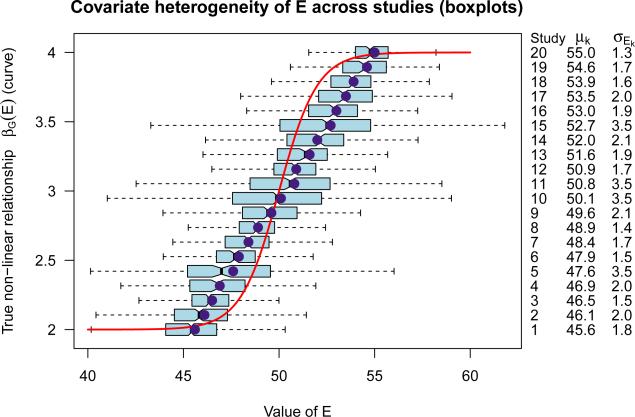
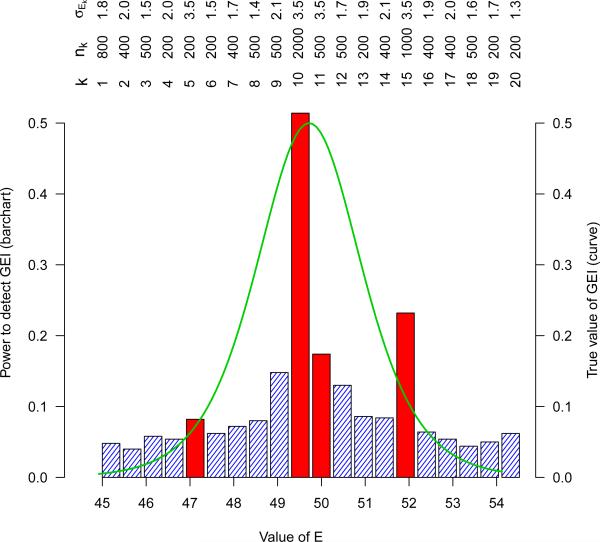
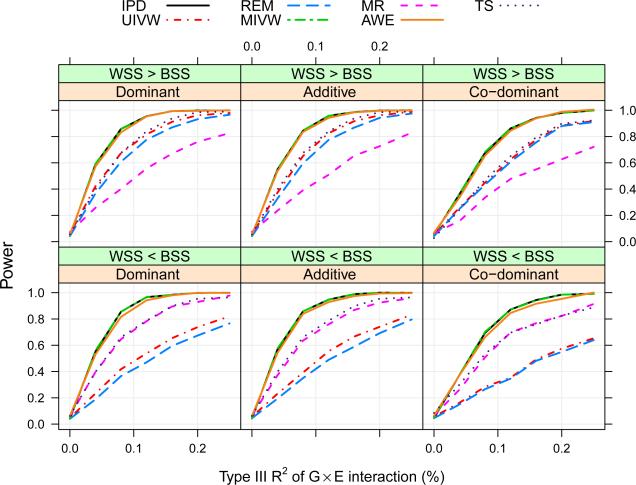
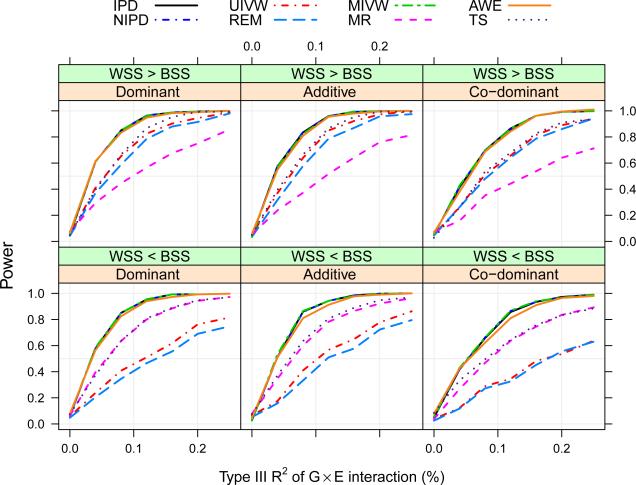
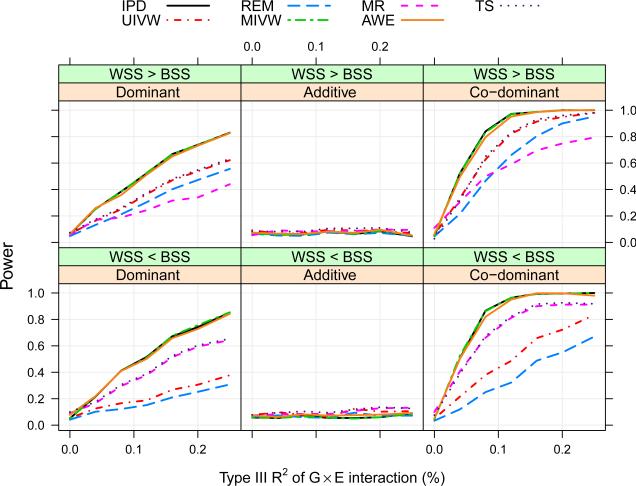
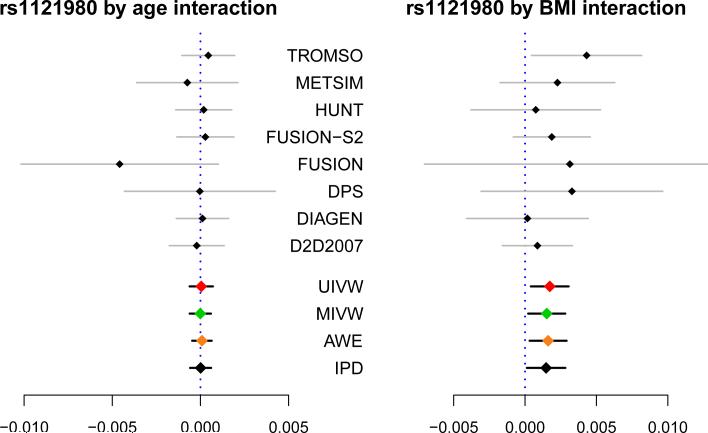
With challenges in data harmonization and environmental heterogeneity across various data sources, meta-analysis of gene-environment interaction studies can often involve subtle statistical issues. In this paper, we study the effect of environmental covariate heterogeneity (within and between cohorts) on two approaches for fixed-effect meta-analysis: the standard inverse-variance weighted meta-analysis and a meta-regression approach. Akin to the results in Simmonds and Higgins (), we obtain analytic efficiency results for both methods under certain assumptions. The relative efficiency of the two methods depends on the ratio of within versus between cohort variability of the environmental covariate. We propose to use an adaptively weighted estimator (AWE), between meta-analysis and meta-regression, for the interaction parameter. The AWE retains full efficiency of the joint analysis using individual level data under certain natural assumptions. Lin and Zeng (2010a, b) showed that a multivariate inverse-variance weighted estimator retains full efficiency as joint analysis using individual level data, if the estimates with full covariance matrices for all the common parameters are pooled across all studies. We show consistency of our work with Lin and Zeng (2010a, b). Without sacrificing much efficiency, the AWE uses only univariate summary statistics from each study, and bypasses issues with sharing individual level data or full covariance matrices across studies. We compare the performance of the methods both analytically and numerically. The methods are illustrated through meta-analysis of interaction between Single Nucleotide Polymorphisms in FTO gene and body mass index on high-density lipoprotein cholesterol data from a set of eight studies of type 2 diabetes.
Keywords: adaptively weighted estimator; covariate heterogeneity; gene-environment interaction; individual patient data; meta-analysis; meta-regression; power calculation.
© 2014 WILEY PERIODICALS, INC.
Figures
Similar articles
-
Subset-Based Analysis Using Gene-Environment Interactions for Discovery of Genetic Associations across Multiple Studies or Phenotypes.Hum Hered. 2018;83(6):283-314. doi: 10.1159/000496867. Epub 2019 May 27. Hum Hered. 2018. PMID: 31132756 Free PMC article.
-
Meta-analysis of gene-environment interaction exploiting gene-environment independence across multiple case-control studies.Stat Med. 2017 Oct 30;36(24):3895-3909. doi: 10.1002/sim.7398. Epub 2017 Jul 25. Stat Med. 2017. PMID: 28744888 Free PMC article.
-
Associations of the FTO rs9939609 and the MC4R rs17782313 polymorphisms with type 2 diabetes are modulated by diet, being higher when adherence to the Mediterranean diet pattern is low.Cardiovasc Diabetol. 2012 Nov 6;11:137. doi: 10.1186/1475-2840-11-137. Cardiovasc Diabetol. 2012. PMID: 23130628 Free PMC article. Clinical Trial.
-
Lack of associations between the FTO polymorphisms and gestational diabetes: A meta-analysis and trial sequential analysis.Gene. 2018 Nov 30;677:169-175. doi: 10.1016/j.gene.2018.07.064. Epub 2018 Jul 26. Gene. 2018. PMID: 30055308 Review.
-
Detecting genetic effects on phenotype variability to capture gene-by-environment interactions: a systematic method comparison.G3 (Bethesda). 2024 Apr 3;14(4):jkae022. doi: 10.1093/g3journal/jkae022. G3 (Bethesda). 2024. PMID: 38289865 Free PMC article. Review.
Cited by
-
Subset-Based Analysis Using Gene-Environment Interactions for Discovery of Genetic Associations across Multiple Studies or Phenotypes.Hum Hered. 2018;83(6):283-314. doi: 10.1159/000496867. Epub 2019 May 27. Hum Hered. 2018. PMID: 31132756 Free PMC article.
-
Opportunities and Challenges for Environmental Exposure Assessment in Population-Based Studies.Cancer Epidemiol Biomarkers Prev. 2017 Sep;26(9):1370-1380. doi: 10.1158/1055-9965.EPI-17-0459. Epub 2017 Jul 14. Cancer Epidemiol Biomarkers Prev. 2017. PMID: 28710076 Free PMC article. Review.
-
Meta-analysis of gene-environment interaction exploiting gene-environment independence across multiple case-control studies.Stat Med. 2017 Oct 30;36(24):3895-3909. doi: 10.1002/sim.7398. Epub 2017 Jul 25. Stat Med. 2017. PMID: 28744888 Free PMC article.
-
Interaction between β-hexachlorocyclohexane and ADIPOQ genotypes contributes to the risk of type 2 diabetes mellitus in East Chinese adults.Sci Rep. 2016 Nov 24;6:37769. doi: 10.1038/srep37769. Sci Rep. 2016. PMID: 27883041 Free PMC article.
-
Meta-analysis of Complex Diseases at Gene Level with Generalized Functional Linear Models.Genetics. 2016 Feb;202(2):457-70. doi: 10.1534/genetics.115.180869. Epub 2015 Dec 29. Genetics. 2016. PMID: 26715663 Free PMC article.
References
-
- Berlin JA, Santanna J, Schmid CH, et al. Individual patient-versus group-level data meta-regressions for the investigation of treatment effect modifiers: Ecological bias rears its ugly head. Statistics in Medicine. 2002;21:371–387. - PubMed
-
- Borenstein M, Hedges LV, Higgins J, et al. A basic introduction to fixed-effect and random-effects models for meta-analysis. Research Synthesis Methods. 2010;1:97–111. - PubMed
-
- Chatterjee N, Carroll RJ. Semiparametric maximum likelihood estimation exploiting gene-environment independence in case-control studies. Biometrika. 2005;92:399–418.
-
- Cochran W. The combination of estimates from different experiments. Biometrics. 1954;10:101–129.
Publication types
MeSH terms
Substances
Grants and funding
LinkOut - more resources
Full Text Sources
Other Literature Sources
Medical
