. 2014 Jul 1;592(13):2785-97.
doi: 10.1113/jphysiol.2014.272518. Epub 2014 May 6.

Rhodopsin in the rod surface membrane regenerates more rapidly than bulk rhodopsin in the disc membranes in vivo

Affiliations

Rhodopsin in the rod surface membrane regenerates more rapidly than bulk rhodopsin in the disc membranes in vivo

Christopher Kessler et al. J Physiol. .

Abstract

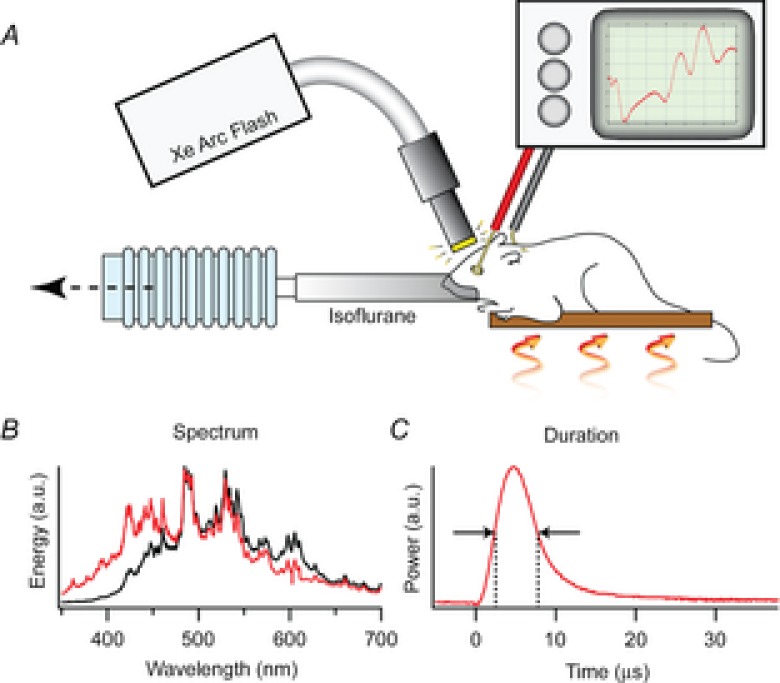
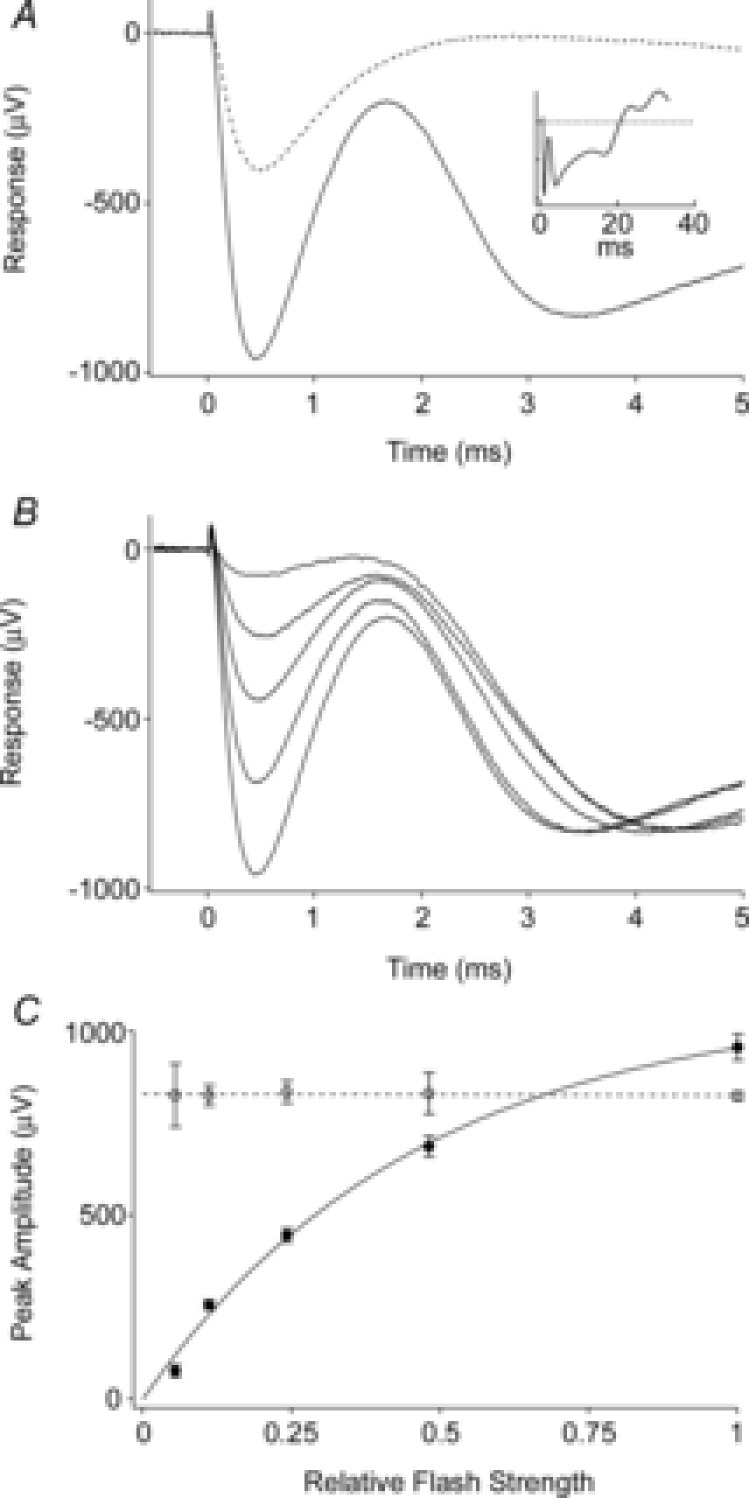
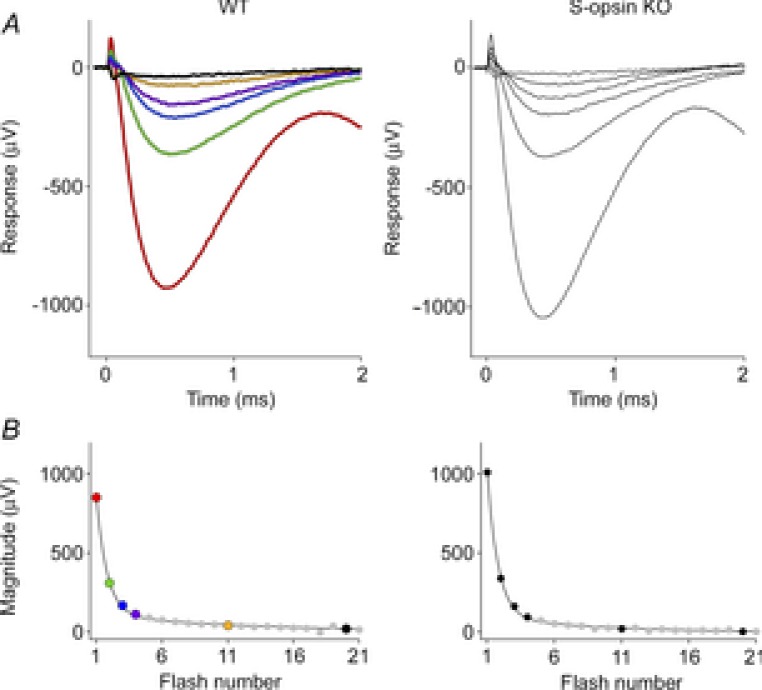
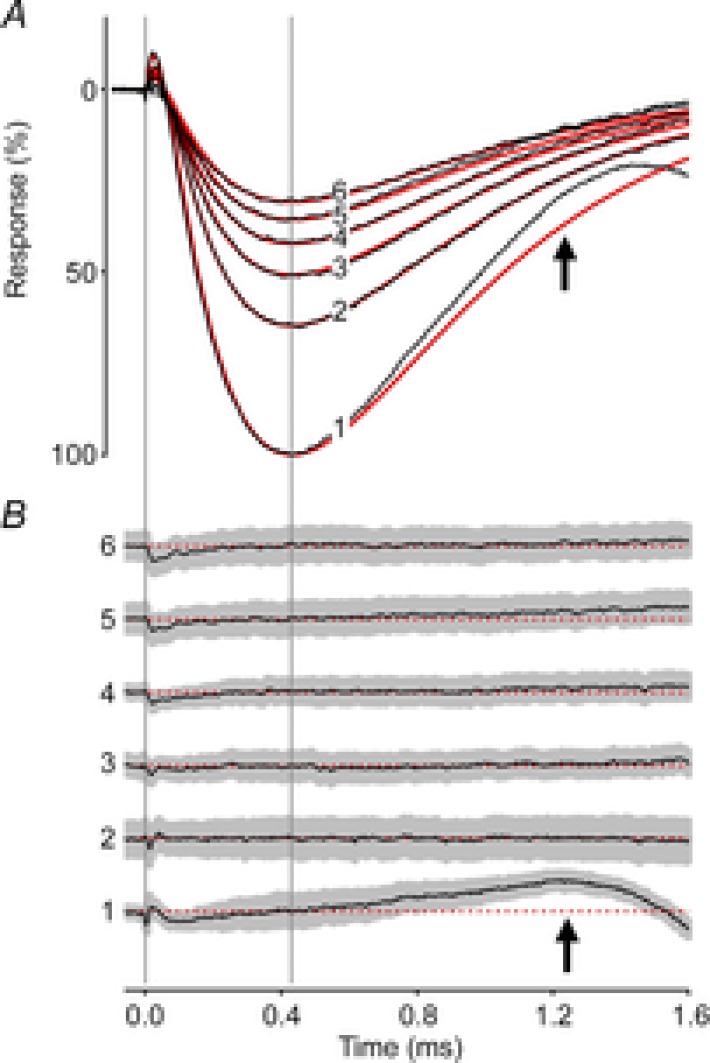
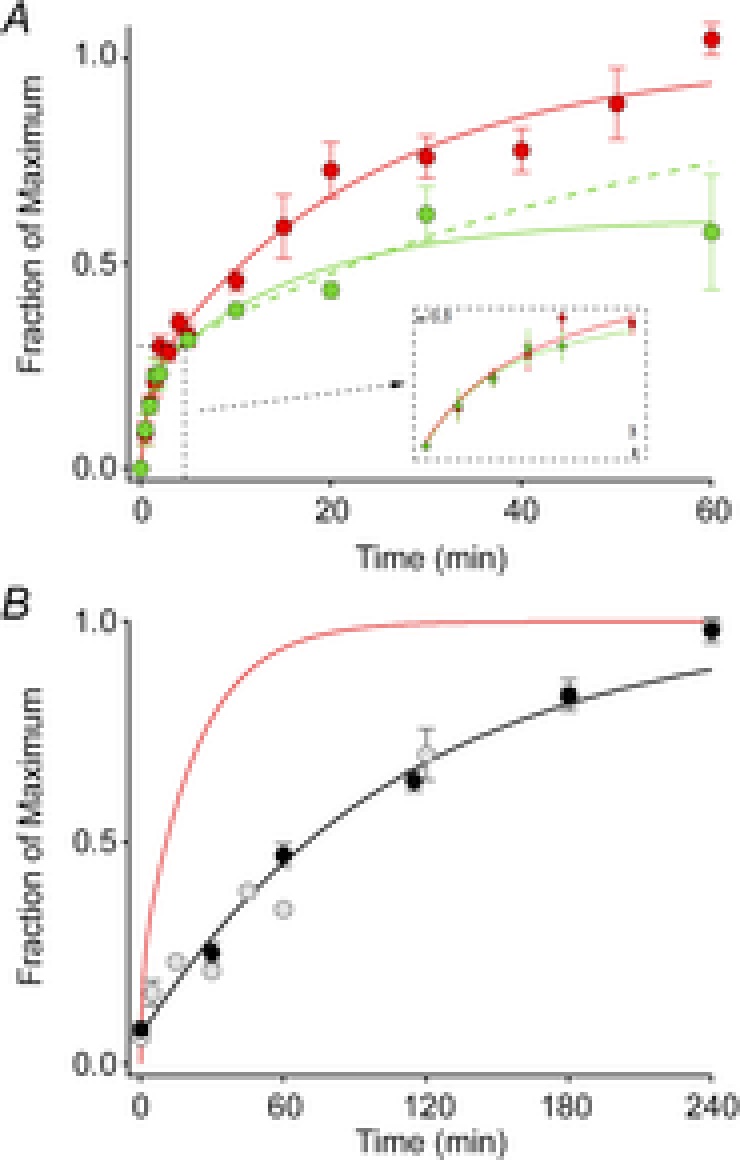
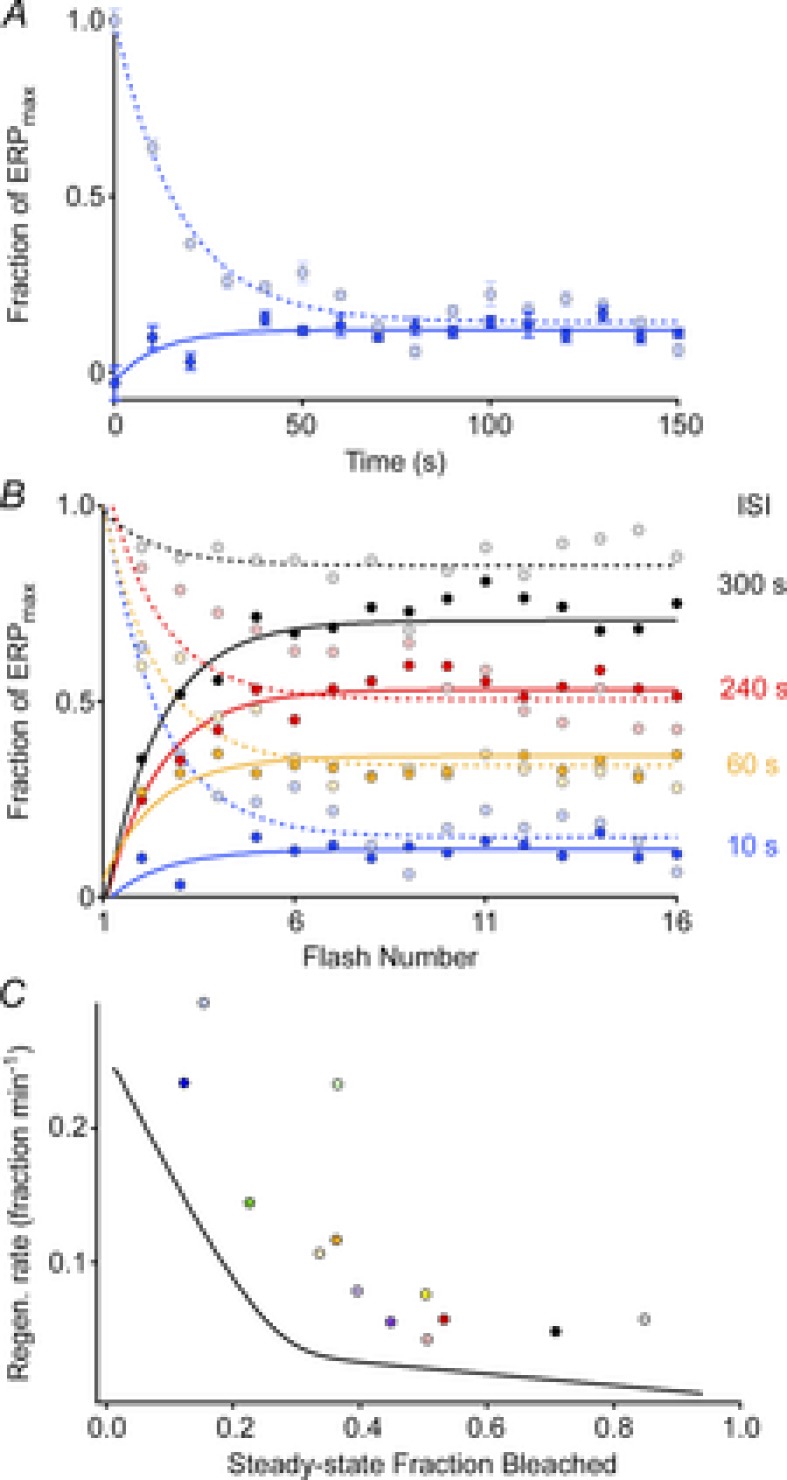
Sustained vertebrate vision requires that opsin chromophores isomerized by light to the all-trans form be replaced with 11-cis retinal to regenerate the visual pigment. We have characterized the early receptor potential (ERP), a component of the electroretinogram arising from photoisomerization-induced charge displacements in plasma membrane visual pigment, and used it to measure pigment bleaching and regeneration in living mice. The mouse ERP was characterized by an outward 'R2' charge displacement with a time constant of 215 μs that discharged through a membrane with an apparent time constant of ∼0.6 ms. After complete bleaching of rhodopsin, the ERP recovered in two phases. The initial, faster phase had a time constant of ∼1 min, accounted for ∼20% of the total, and was not dependent on the level of expression of the retinal pigment epithelium isomerase, Rpe65. The slower, complementary phase had a time constant of 23 min in wild-type (WT) mice (C57Bl/6) and was substantially slowed in Rpe65(+/-) mice. Comparison of the ERPs of a mouse line expressing 150% of the normal level of cone M-opsin with those of WT mice revealed that M-opsin contributed 26% of the total WT ERP in these experiments, with the remaining 74% arising from rhodopsin. Thus, the fast regenerating fraction (20%) corresponds approximately to the fraction of the total ERP independently estimated to arise from M-opsin. Because both phases of the ERP recover substantially faster than previous measurements of bulk rhodopsin regeneration in living mice, we conclude that delivery of the highly hydrophobic 11-cis retinal to the interior of rod photoreceptors appears to be retarded by transit across the cytoplasmic gap between plasma and disc membranes.


Figures

Figure 1
Figure 1. Description of the ERG apparatus and flash unit
A, the mouse was anaesthetized with 1.5% isoflurane delivered through a tube fitting snugly around its nose and held on an adjustable, heated platform. Light from a xenon flash unit was delivered to the eye by a 5 mm diameter fibre optic positioned ∼1 mm from the corneal surface and normal to its centre of curvature. ERGs are recorded via a differential amplifier connected to a platinum ring corneal electrode and a reference electrode inserted subcutaneously into the forehead (Methods). B, spectral profiles of light delivered through the glass fibre optic bundle (black trace) and a liquid guide (red trace), measured with an Ocean Optics Inc (830 Douglas Ave, Dunedin, FL 34698) USB 2000 spectrometer with 0.3 nm resolution. C, the time course of the flash measured with Thorlabs Inc (56 Sparta Ave, Newton, NJ 07860) FDS010 photodiode with 1 ns rise time.
Figure 2
Figure 2. Properties of the mouse ERP
A, average ERG recorded in response to the first (continuous trace) and the second (dashed trace) of a pair of unattenuated flashes delivered 100 ms apart through the liquid light guide. The initial corneal-negative deflection, complete in ∼2 ms, is the ERP; it is followed in the first response by the corneal-negative a-wave, which does not recover between flashes. The amplitude of the second ERP is smaller, consistent with the first flash bleaching a significant fraction of the underlying pigment. Inset shows the first response on a longer time base. Each trace is the average from 5 experiments. B, average responses to first flashes that were attenuated incrementally by factors of ∼2. The initial ERP amplitudes varied with flash strength, while the a-wave amplitudes did not. Each trace is the average of 2–5 responses from separate experiments. C, initial ERP amplitude varied with flash strength. Average peak amplitudes of the ERP (filled circles) and a-waves (open circles) derived from the experiments of B. Each point is the mean ± SEM. (Phenylephrine was used in these experiments.)
Figure 3
Figure 3. ERP serial bleaching of wild-type mice, and mice lacking cone S-opsin
A, the two upper panels show the first 2 ms of ERGs obtained in response to the first six of a series of unattenuated flashes delivered through the liquid light guide at 30 Hz. Both WT and S-opsin knockout (KO) data are averaged traces (n = 5 and 3, respectively). The amplitudes of the ERPs in response to the first flash were 924 ± 30 and 1042 ± 28 μV (mean ± SEM, P < 0.005), and 809 ± 27 and 813 ± 22 μV for the initial a-waves of the WT and the S-opsin KO, respectively. B, the lower panels plot the amplitude of the ERP as a function of the number of the flash in the series. The parameters of the best-fitting double-geometric depletion model (eqn (5)) are as follows: for the WT, A = 0.87, PA = 0.70, PB = 0.07; for the S-opsin KO, A = 0.90, PA = 0.71, PB = 0.11.
Figure 4
Figure 4. Invariant kinetics of the mouse ERP
A, the first 6 ERPs from a series of unattenuated flashes (30 Hz), averaged over 160 experiments (black traces). The red traces are the best-fitting version of a theoretical model (Hodgkin & O'Bryan, ; Methods, eqn (2)) with parameter values τR1 = 46 μs, τR2 = 215 μs and τm = 570 μs. B, residual differences between the data and theory traces in A plotted along with the 95% confidence interval (grey region). The difference traces have been arbitrarily offset vertically from one another, but are plotted at the same scale as in A, and are identified at left with the corresponding numbers. The dashed red lines indicate the zero difference levels. A single set of kinetics parameters fitted the sequential responses well; the deviation of the initial ERP from the model (black arrows) is consistent with a shorter membrane time constant governing the ERP response to the first flash (see text).
Figure 5
Figure 5. Time course of recovery of the ERP after a full bleach
A, ERP recovery. Each point represents the mean (± SEM) maximal ERP amplitude following a full bleach (600 unattenuated flashes, 30 Hz) and variable periods of dark adaptation. The red filled circles plot the data of WT mice (n = 6–13), while the green filled circles show the data of Rpe65+/− mice (n = 3–5). The continuous curves fitted to the data are double-exponential rises (eqn (4), Methods) with C1 = 0.21, τ1 = 0.94 and τ2 = 23.3 min for the data of WT mice, and C1 = 0.21, τ1 = 0.84 min and τ2 = 16.4 min for those of the Rpe65+/− mice. The recovery of the Rpe65+/− mice achieved only 61% recovery at 60 min, and the precise time course of the recovery, while clearly slowed, is poorly determined. Assuming (as established by experiments on subsequent days) full recovery, we forced the regeneration to asymptote to unity, yielding the dashed green curve, with parameters C1 = 0.25, τ1 = 0.84 min and τ2 = 56 min. The inset shows the initial 3 min of recovery on an expanded time base. B, comparison of the ERP recovery (red trace, copied from A) with the regeneration of total rhodopsin of C57Bl/6 mice after a full bleach, replotted from two independent studies (pale symbols, Wenzel et al. ; black symbols and rate-limited regeneration time course from Lyubarsky et al. 2005). For the a-wave recoveries the same initial bleach protocol was used as in Fig. 3 (600 flashes, 30 Hz), but the subsequent test flash was attenuated 16-fold (ND = 1.2), and delivered every 2 min; flashes of this strength saturated the a-wave amplitude in the dark-adapted mouse. (All experiments in this figure were done with flashes delivered by the glass fibre optic light guide.)
Figure 6
Figure 6. ERP regeneration rates measured in a steady-state, periodic flash protocol
A, ERP amplitude plotted as a function of flash number in experiments in which the unattenuated flash was delivered every 10 s, beginning either from a fully bleached state (dark blue filled circles) or beginning in the dark-adapted state (light blue filled circles); each point plots the mean (± SEM) from 3–4 experiments. B, results of experiments following the same protocol as in A, but with various interstimulus intervals (ISIs). Each point plots the mean from 3–4 experiments. All experiments used the glass fibre optic for light delivery. C, rates of regeneration (symbols) extracted from the final, steady-state levels in panel B using the same colour scheme (Methods, eqn (4), with fB = 0.32; cf Table 1) plotted as a function of the steady-state fraction bleached, taken to be 1 – (ERPss/ERPmax). (Data from 3 sets of experiments with ISIs of 30 s, 120 s and 180 s, which were not included in panel B, have been included in panel C). The continuous black curve plots the instantaneous rate of regeneration at each level P(t) of the regeneration of the ERP following a full bleach, obtained as the derivative of the smooth curve fitted to the regeneration data (WT data) of Fig. 5A.

Similar articles

Cited by

References

    1. Ala-Laurila P, Cornwall MC, Crouch RK, Kono M. The action of 11-cis-retinol on cone opsins and intact cone photoreceptors. J Biol Chem. 2009;284:16492–16500. - PMC - PubMed
    1. Azuma K, Azuma M, Sickel W. Regeneration of rhodopsin in frog rod outer segments. J Physiol. 1977;271:747–759. - PMC - PubMed
    1. Brown KT, Murakami M. A new receptor potential of the monkey retina with no detectable latency. Nature. 1964;201:626–628. - PubMed
    1. Carter-Dawson LD, LaVail MM. Rods and cones in the mouse retina. I. Structural analysis using light and electron microscopy. J Comp Neurol. 1979;188:245–262. - PubMed
    1. Cideciyan AV, Haeseleer F, Fariss RN, Aleman TS, Jang GF, Verlinde CL, Marmor MF, Jacobson SG, Palczewski K. Rod and cone visual cycle consequences of a null mutation in the 11-cis-retinol dehydrogenase gene in man. Vis Neurosci. 2000;17:667–678. - PMC - PubMed

Publication types

LinkOut - more resources