. 2014 Jan;31(1):57-84.
doi: 10.1017/S0952523813000461.

A synaptic signature for ON- and OFF-center parasol ganglion cells of the primate retina

Affiliations

A synaptic signature for ON- and OFF-center parasol ganglion cells of the primate retina

Joanna D Crook et al. Vis Neurosci. 2014 Jan.

Abstract

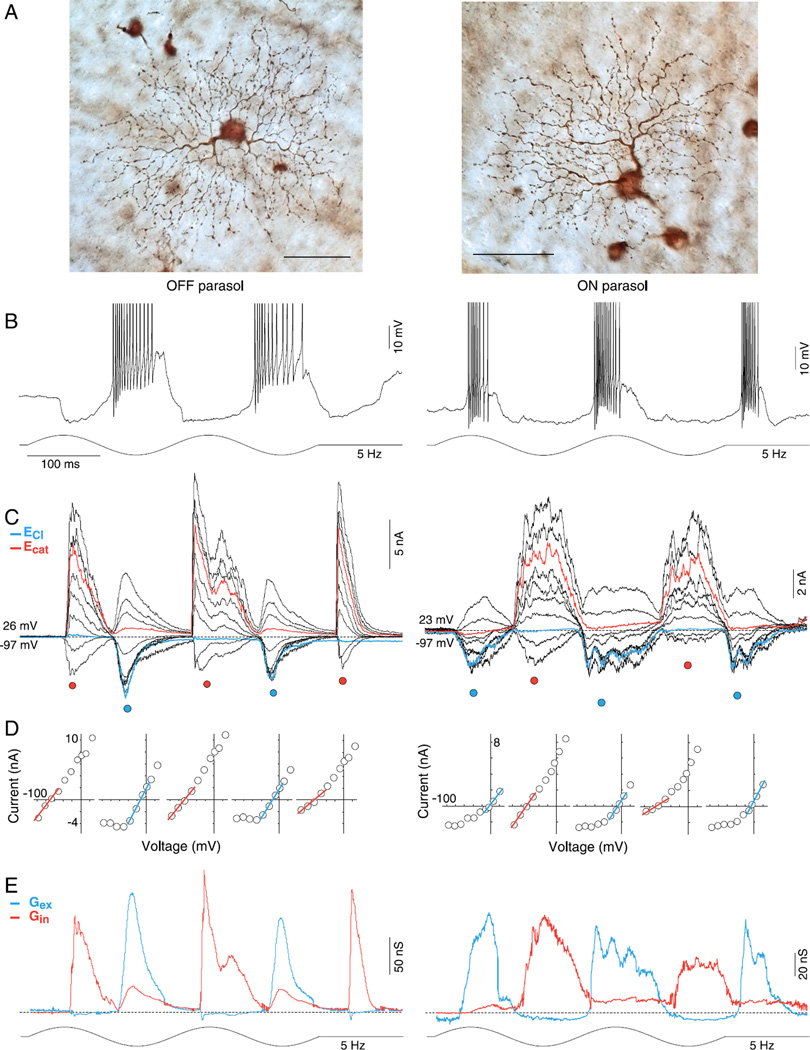
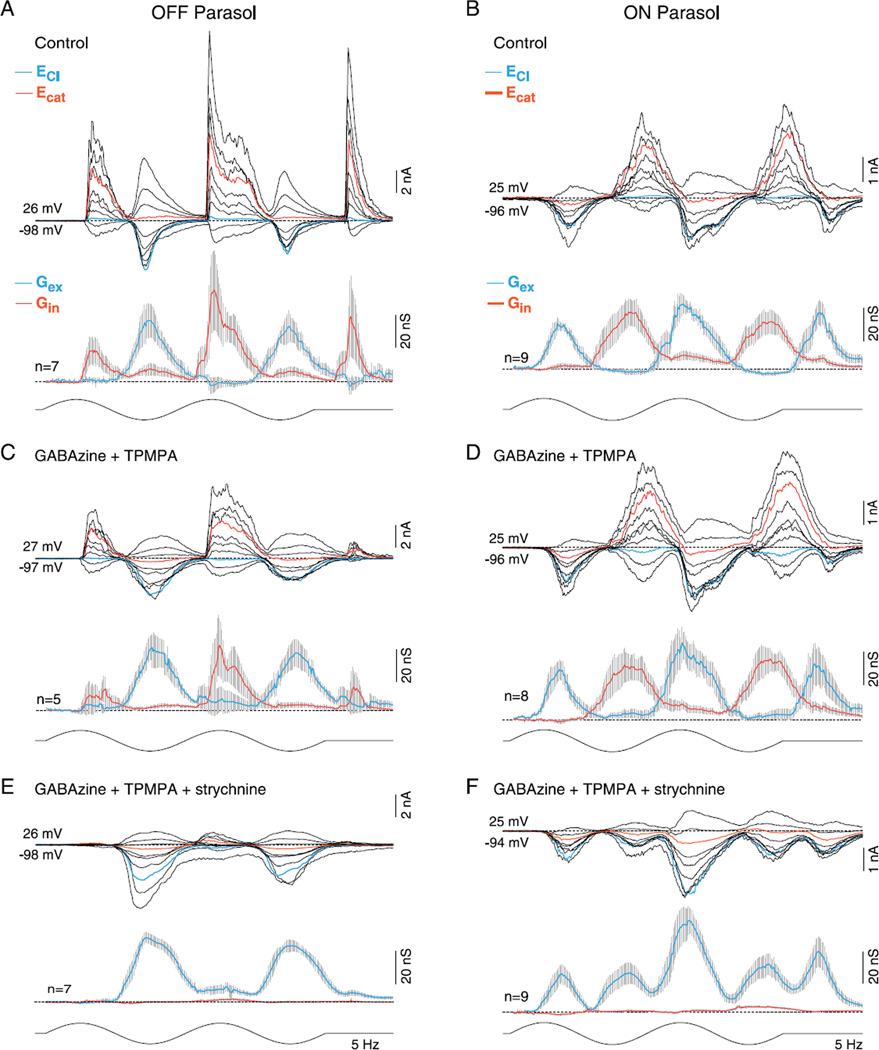
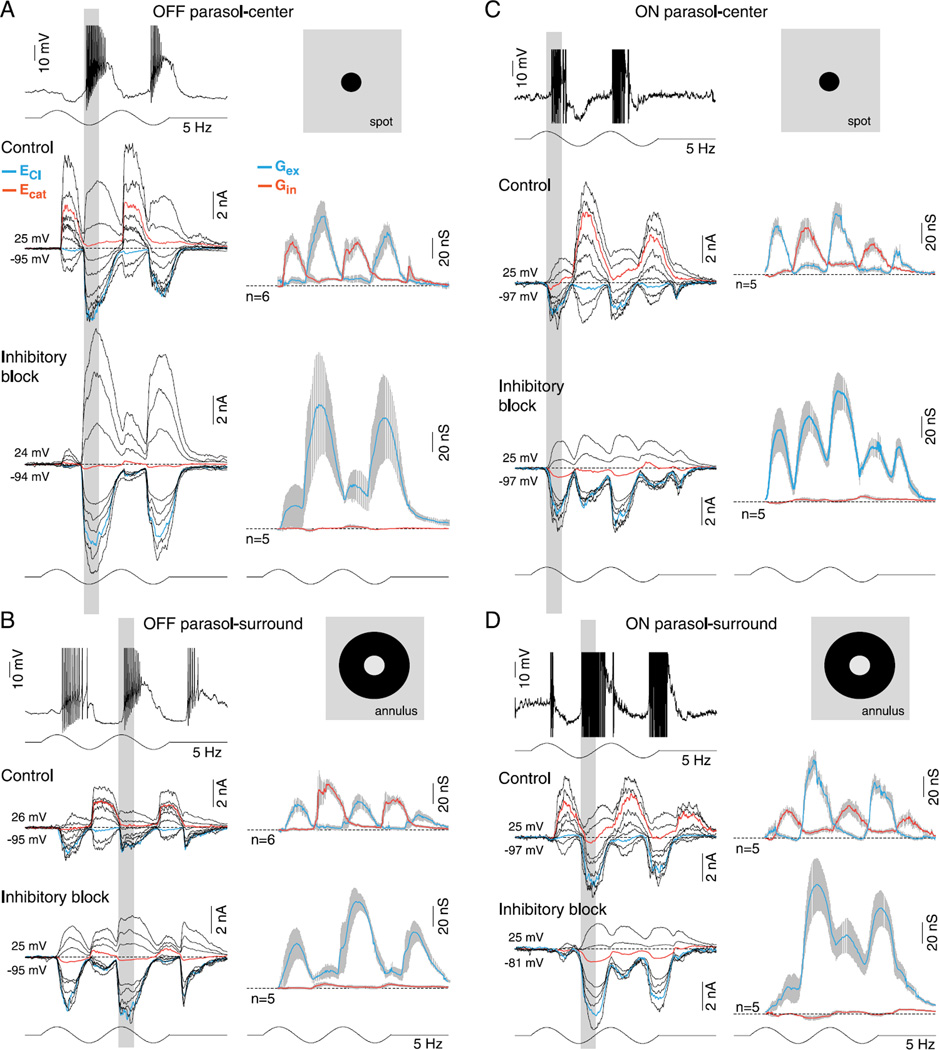
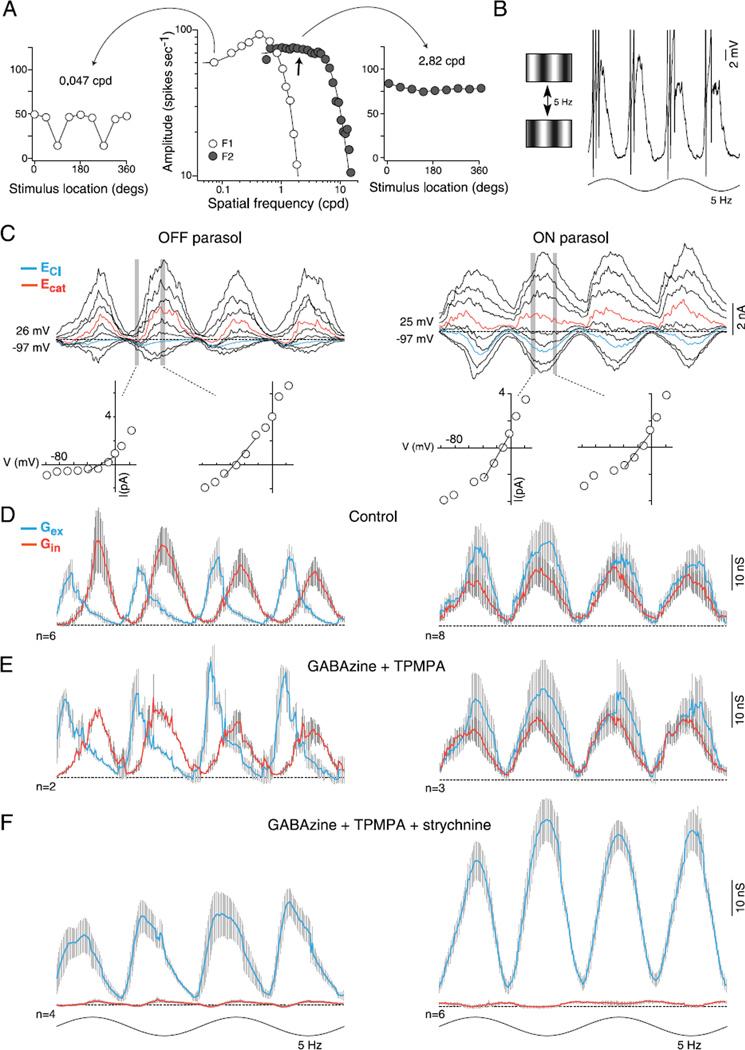
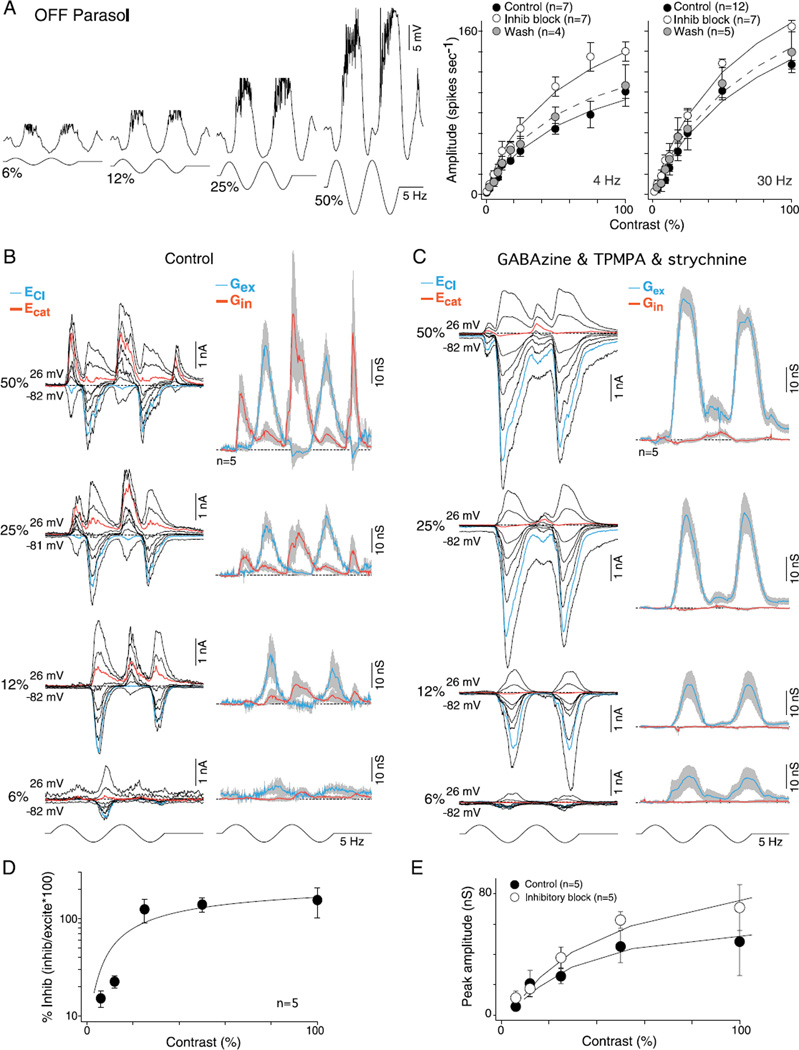
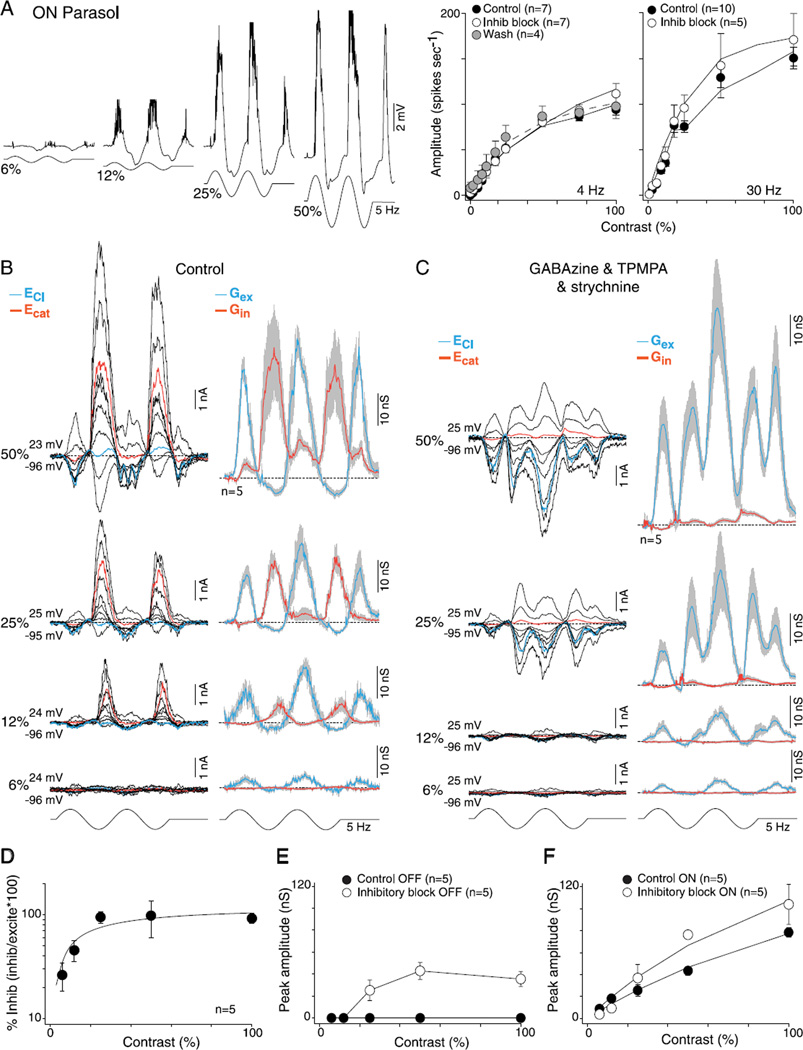
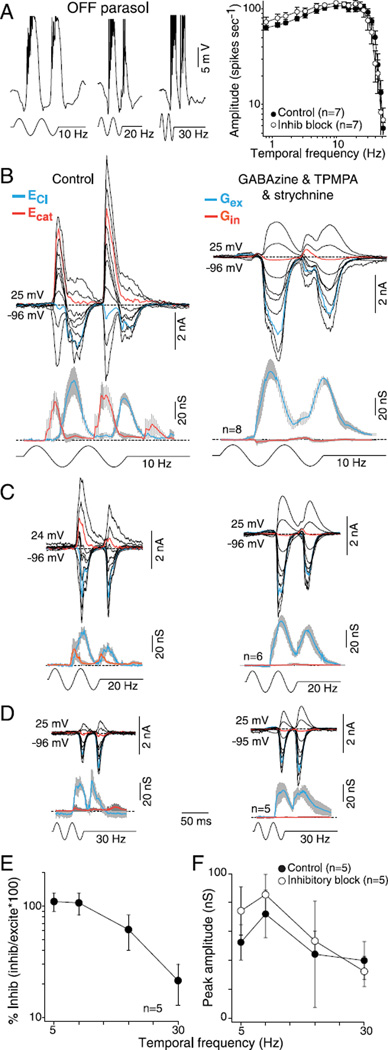
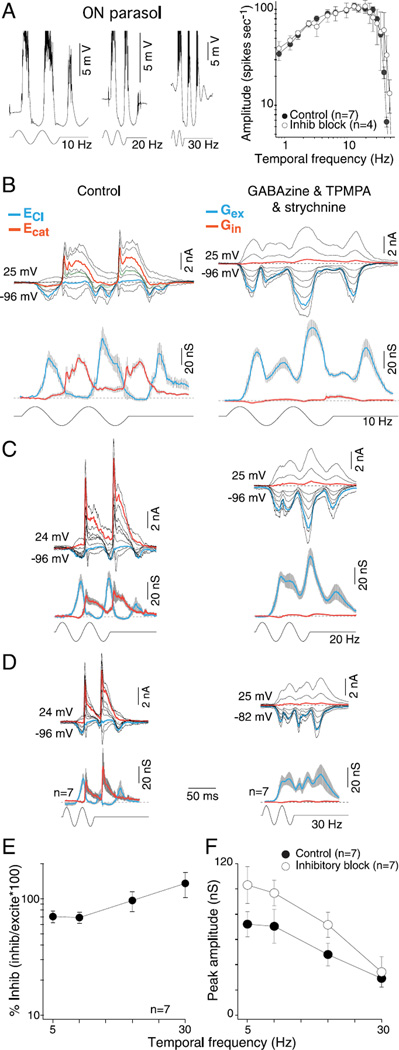
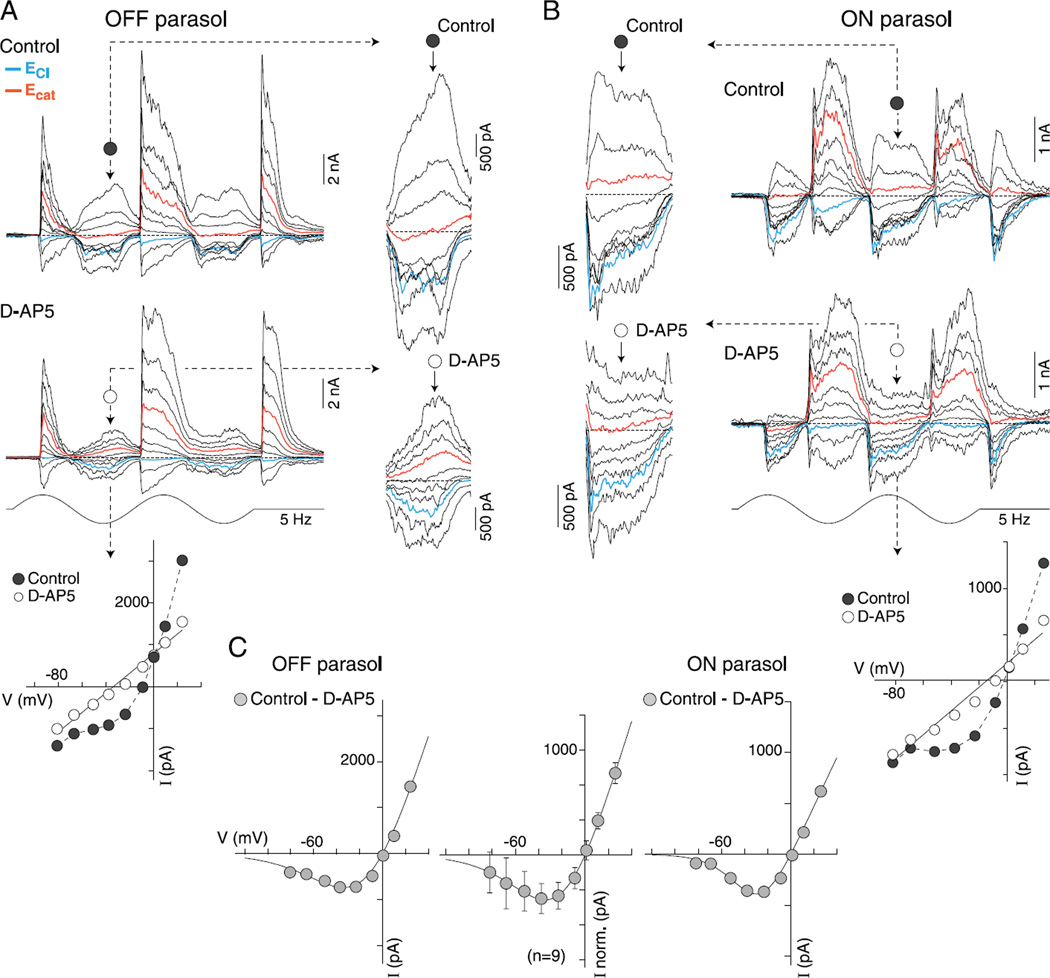
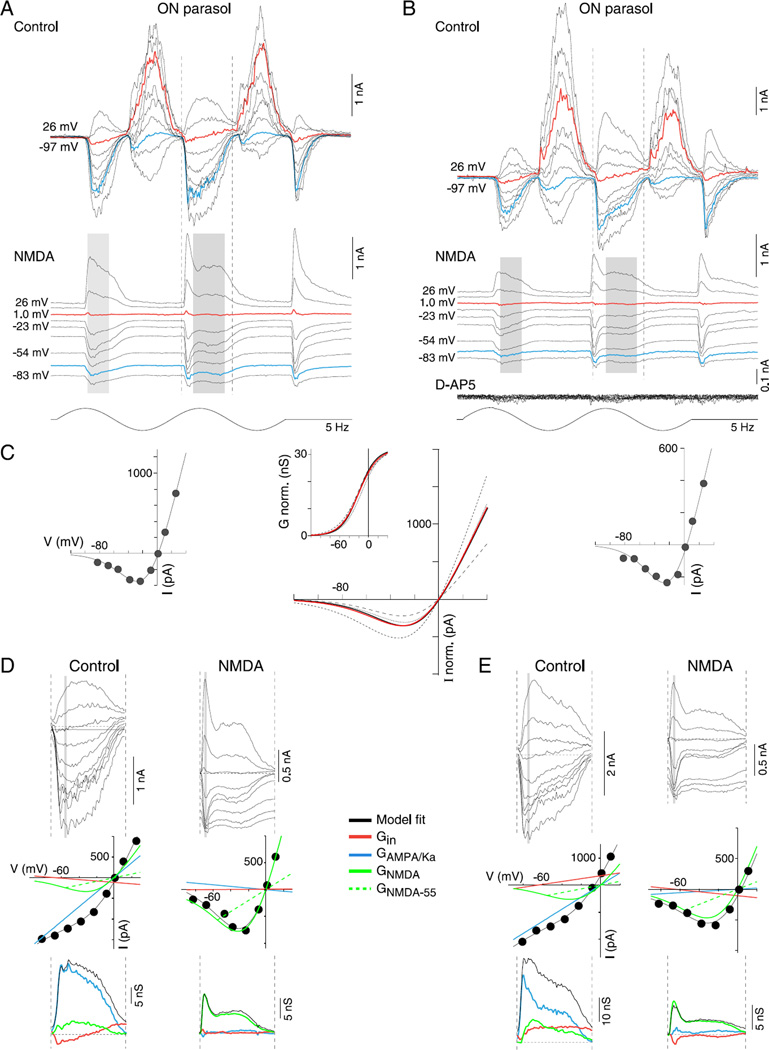
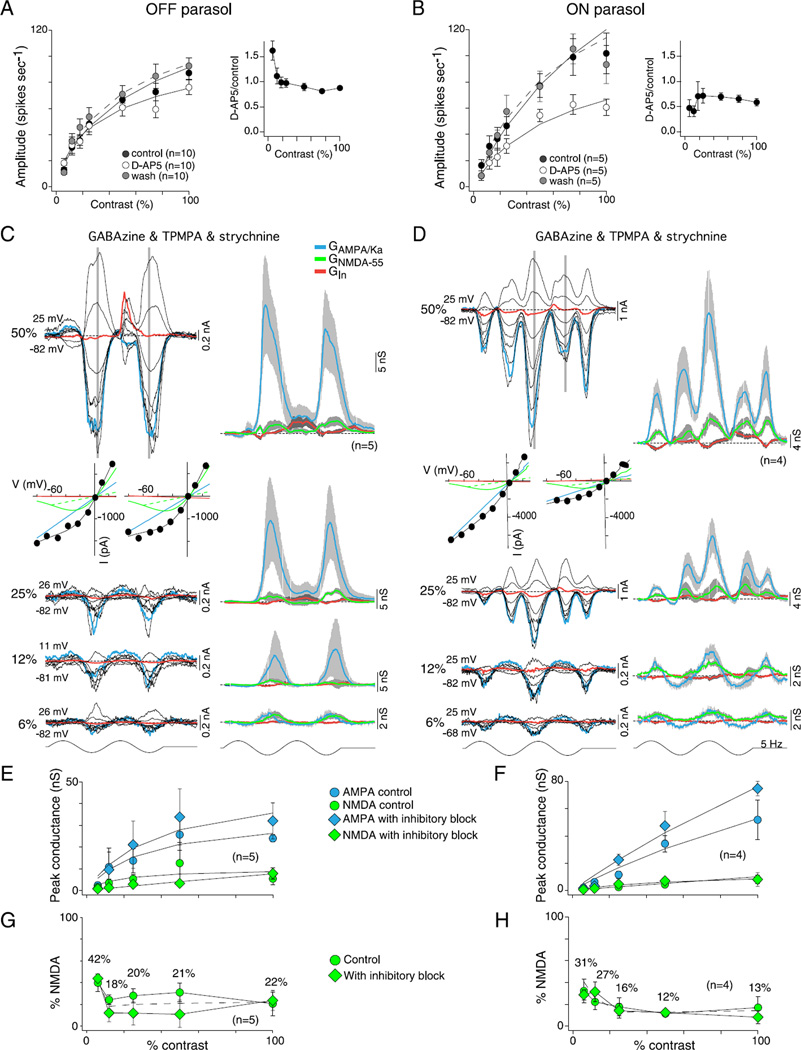
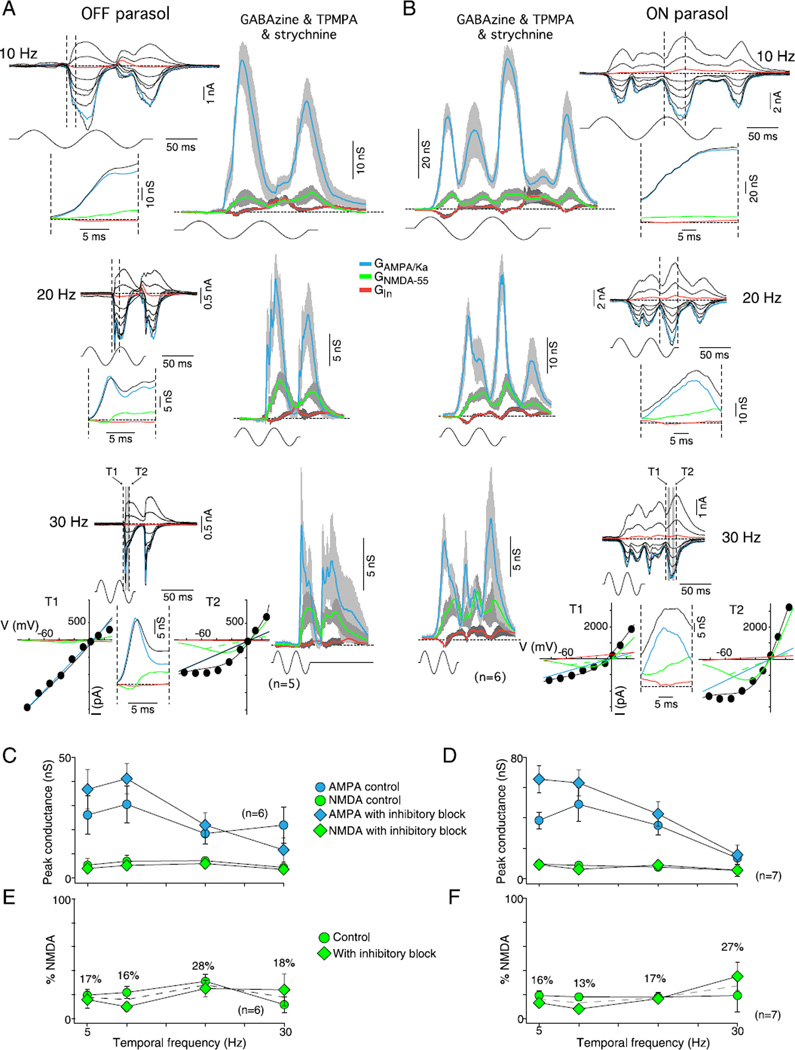
In the primate retina, parasol ganglion cells contribute to the primary visual pathway via the magnocellular division of the lateral geniculate nucleus, display ON and OFF concentric receptive field structure, nonlinear spatial summation, and high achromatic temporal-contrast sensitivity. Parasol cells may be homologous to the alpha-Y cells of nonprimate mammals where evidence suggests that N-methyl-D-aspartate (NMDA) receptor-mediated synaptic excitation as well as glycinergic disinhibition play critical roles in contrast sensitivity, acting asymmetrically in OFF- but not ON-pathways. Here, light-evoked synaptic currents were recorded in the macaque monkey retina in vitro to examine the circuitry underlying parasol cell receptive field properties. Synaptic excitation in both ON and OFF types was mediated by NMDA as well as α-amino-3-hydroxy-5-methyl-4-isoxazolepropionic acid (AMPA)/kainate glutamate receptors. The NMDA-mediated current-voltage relationship suggested high Mg2+ affinity such that at physiological potentials, NMDA receptors contributed ∼20% of the total excitatory conductance evoked by moderate stimulus contrasts and temporal frequencies. Postsynaptic inhibition in both ON and OFF cells was dominated by a large glycinergic "crossover" conductance, with a relatively small contribution from GABAergic feedforward inhibition. However, crossover inhibition was largely rectified, greatly diminished at low stimulus contrasts, and did not contribute, via disinhibition, to contrast sensitivity. In addition, attenuation of GABAergic and glycinergic synaptic inhibition left center-surround and Y-type receptive field structure and high temporal sensitivity fundamentally intact and clearly derived from modulation of excitatory bipolar cell output. Thus, the characteristic spatial and temporal-contrast sensitivity of the primate parasol cell arises presynaptically and is governed primarily by modulation of the large AMPA/kainate receptor-mediated excitatory conductance. Moreover, the negative feedback responsible for the receptive field surround must derive from a nonGABAergic mechanism.


Figures

Fig. 1
Fig. 1
OFF and ON parasol cell light-evoked excitatory and crossover inhibitory synaptic conductances are largely rectified. (A) Dendritic morphology of OFF (left panel) and ON (right panel) parasol cells in the near retinal periphery (~5 mm eccentric from fovea). OFF and ON cells have relatively large somas and moderately branched, spine-laden dendritic trees that permit reliable targeting and identification in the in vitro retina. Scale bar = 50 µm (B) Intracellular voltage response (current clamp mode) from OFF (left) and ON (right) parasol cells to a large stimulus field (1-mm diameter 100% contrast, sinusoidally modulated at 5 Hz, two stimulus cycles shown; effective quanta ~1.1 × 10⁵ photons/s/µm2). The membrane potential depolarizes (spikes have been partially clipped to permit enlargement of membrane potential) and hyperpolarizes in-phase with light decrement and increment respectively for the OFF cell, and conversely for the ON cell. (C) Family of light-evoked postsynaptic currents for an OFF (left) and ON (right) parasol cell in response to the same stimulus as shown in B for ten holding potentials ranging from approximately −90 to +40 mV at ~15 mV intervals. Currents evoked near the chloride (−65 mV) and cation (0 mV) equilibrium potentials are indicated in blue and red, respectively. (D) Current-voltage (I–V) plots for time points at peak increment and decrement of stimulus indicated by red- and blue-filled circles below the current traces in (B). Reversal potential and slope were determined from linear fits (red and blue lines) to data points around the reversal potential. (E) Excitatory (blue) and inhibitory (red) synaptic conductances derived from slope and reversal potential of linear fits to I—Vs at 1.5-ms intervals across two stimulus cycles (see Materials and methods for details). Note that for both ON and OFF parasol cells, a rectified excitatory conductance underlies membrane depolarization during spiking phase of the light response and a very large and similarly rectified inhibitory conductance (“crossover inhibition”) is present during the hyperpolarizing response phase.
Fig. 2
Fig. 2
Effect of GABAA, GABAC, and glycine receptor antagonists on light-evoked synaptic conductances in OFF- and ON-center parasol cells. (A and B) Upper traces: family of light evoked synaptic currents for an OFF- (A) and ON-center (B) parasol cell; stimulus 50% contrast; other conventions as given in Fig. 1. Lower traces: mean (gray shading indicates s.e.), excitatory (blue), and inhibitory (red) synaptic conductances; conventions as given in Fig. 1. (C and D), as in (A and B) after bath application of GABAA (GABAzine; 5 µM) and GABAC (TPMPA; 50 µM) receptor antagonists. There were no significant changes in the contribution of the feedforward inhibition (control vs. block of GABAA and GABAC receptors: OFF cells 9 ± 4 vs. 2 ± 1 nS and ON cells 8 ± 2 vs. 10 ± 3 nS), crossover inhibition (OFF cells 61 ± 23 vs. 47 ± 18 nS and ON cells 35 ± 7 vs. 37 ± 6 nS) or the excitatory conductance (OFF cells 41 ± 9 vs. 46 ± 7 nS and ON cells 40 ± 5 vs. 47 ± 9 nS). (E and F) As in (C and D) after addition of glycine receptor antagonist to bath (strychnine, 1 µM). Strychnine abolishes all crossover inhibition, significantly increases the existing excitatory response (control vs. GABA plus glycine receptor block: OFF cells, 41 ± 9 vs. 60 ± 5 and ON cells, 40 ± 5 vs. 58 ± 8 nS), and unmasks a small and large crossover excitatory conductance in OFF (13 ± 4 nS) and ON parasol cells (28 ± 5 nS), respectively.
Fig. 3
Fig. 3
Synaptic inhibition is not required for center–surround antagonism in OFF- and ON-center parasol cells. (A-D) Current and voltage clamp recordings from OFF- and ON-center parasol cells in response to a spot (A, C; 100-µm diameter) or annulus (B, D; 100-µm inner diameter) modulated at 5 Hz, 100% contrast, as indicated by the spot and annulus inset icons (effective quanta ~2.5 × 10⁵ photons/s/µm2). Current clamp intracellular recording (A, D, top traces) shows that spike discharge and membrane potential modulation in response to spot versus annuli are ~180 out of phase (indicted by the vertical gray-shaded bars), demonstrating strong center–surround antagonism in both ON and OFF cells. (A and C) Middle traces, family of light-evoked synaptic currents for an OFF- (A) and ON-center (C) cell in response to a spot; mean (gray shading, s.e.), excitatory (Gex, blue), and inhibitory (Gin, red) conductances for sample number indicated are shown to the right of current family. (A and C) Lower traces, synaptic currents, and conductances after application of GABAA (GABAzine, 5 µM), GABAC (TPMPA, 50 µM), and glycine (strychnine, 1 µM) receptor antagonists. OFF parasol cell peak excitation increased from 69 ± 14 to 124 ± 53 nS and ON parasol cell peak excitation from 62 ± 11 to 107 ± 20 nS. (B and D) Middle and lower traces as in (A), (C) but responses to a surround isolating annulus are shown for the same sample of cells. Note that both the excitatory and inhibitory conductances reverse phase in response to stimulation with spot versus annulus (as indicated by the gray-shaded vertical bars). Note also that for both ON and OFF cells, the surround-mediated excitatory conductance persists and increases in amplitude after the block of synaptic inhibition. Total excitation is increased in both OFF-center (31 ± 7 vs. 89 ± 14 nS) and ON-center cells (80 ± 9 vs. 122 ± 25 nS) after the block of synaptic inhibition, with the addition of crossover excitation (see Fig. 2) especially evident in the ON parasol cell.
Fig. 4
Fig. 4
Synaptic inhibition is not required for the parasol cell frequency-doubled response to stimuli of high spatial frequency (the “Y-cell signature”). (A) Middle, spatial frequency tuning of an OFF parasol cell; open circles plot spike discharge in response to drifting grating varied in spatial frequency (cpd, cycles/deg of visual angle), and modulated sinusoidally in contrast (5 Hz, 50% contrast; first harmonic amplitude, F1). F1 response is fit with a difference-of-Gaussians center–surround receptive field model (center diameter = 111 µm). Filled circles plot second harmonic (“frequency-doubled,” F2) amplitude to stationary gratings that reverse in contrast (5 Hz, 50% contrast). F2 response is fit with a single Gaussian (center diameter = 31 µm). Either side of the spatial tuning curves are F1 (left) and F2 (right) responses to contrast-reversing gratings of 0.047 cpd (left) and 2.82 cpd (right) as a function of the location of the stimulus relative to the receptive field center (degrees). At 0.047 cpd, F1 dominates and is sensitive to the location of the stimulus (90 and 270 deg), whereas to a finer spatial frequency (2.82 cpd, right), F2 dominates regardless of the location of the stimulus. (B) Left, cartoon of the contrast reversing grating stimulus. Right, intracellular current clamp recording of an OFF cell near the peak of the F2 spatial frequency response (arrow in the middle plot in A). Membrane potential deeply modulates at twice the stimulus frequency. (C) Family of frequency-doubled synaptic currents evoked to contrast reversing gratings at the peak of the spatial frequency response for an OFF (left) and ON parasol cell (right). I—V plots at two time points indicated by vertical gray bars shown below synaptic currents. (D) Average excitatory (Gex, blue) and inhibitory (Gin, red) synaptic conductances for 6 OFF- (left) and 8 ON- (right) center cells. (E) Addition of GABAA (GABAzine, 5 µM) and GABAC (TPMPA, 50 µM) receptor antagonists; average conductance as indicated in (C). OFF cell peak of the excitatory conductance increased from 17 ± 2 to 28 ± 2 nS while peak crossover inhibition showed little change (20 ± 3 to 17 ± 1 nS). ON parasol cells: the peak excitation (22 ± 3 to 25 ± 4 nS) and inhibition (16 ± 2 to 18 ± 1) showed little change. (F) Addition of the glycine receptor antagonist strychnine (1 µM) eliminates the inhibitory synaptic conductance; frequency doubled synaptic excitation is preserved and total excitation is increased in both OFF- (25 ± 2 nS) and ON-center cells (48 ± 3 nS).
Fig. 5
Fig. 5
Contrast sensitivity of excitatory and inhibitory conductances for OFF-center parasol cells: high sensitivity is mediated by synaptic excitation. (A) Left, intracellular voltage recording of an OFF-parasol to 6, 12, 25, and 50% sinusoidal contrast modulation (5 Hz, 1-mm field diameter). Membrane potential depolarizes during OFF-phase and hyperpolarizes during ON-phase (spikes removed for illustrative purposes). Right, plots of spike rate as a function of stimulus contrast (first harmonic amplitude) for 4- and 30-Hz stimulus temporal frequencies before (solid circles) and after application of GABAA (GABAzine, 5 µM) and GABAC (TPMPA, 50 µM) and glycine (strychnine; 1 µM) receptor antagonists (open circles). Solid lines are Naka-Rushton fits (4Hz: control se = 0.8, inhibitory block se = 1.0, and wash se = 0.8; 30 Hz: control se = 2.3, inhibitory block se = 1.7, and wash se = 2.0; see Materials and methods). Contrast gain values increase for the 4-Hz responses (control 2.7 ± 1.2, inhibitory block 4.7 ± 3.0, and wash 2.8 ± 0.6) and 30-Hz responses (control 3.3 ± 1.3, inhibitory block 4.6 ± 1.9, and wash 3.7 ± 1.9). (B) Left, family of light-evoked synaptic currents (stimulus as in A) for a single OFF-parasol at 6, 12, 25, and 50% contrast. Right, average excitatory (blue) and inhibitory (red) synaptic conductances for five cells (conventions as in Figs. 2 and 3). (C) Data shown as in (B) after the block of GABAergic and glycinergic inhibition, as in (A); excitatory conductances persist at all contrasts and increase in amplitude. (D) Plot of peak mean inhibitory conductance relative to excitatory conductance [peak inhibition/peak (excitation + inhibition)]. Percent of synaptic inhibition was calculated on a cell-by-cell basis. Inhibition is greatly reduced relative to excitation at lower contrasts. Solid line is a Naka-Rushton fit (se = 11.4). (E) Peak excitatory conductances before (solid circles) and after (open circles) the addition of GABA and glycine receptor antagonists plotted as a function of contrast. Solid lines are Naka-Rushton fits (control se = 1.8 and inhibitory block se = 2.0). Contrast gain increases from 1.4 ± 0.3 to 2.5 ± 0.6.
Fig. 6
Fig. 6
Contrast sensitivity of excitatory and inhibitory conductances for ON-center parasol cells: high sensitivity is mediated by synaptic excitation. (A) Left, intracellular voltage recording of an ON-parasol to 6, 12, 25, and 50% sinusoidal contrast modulation (5 Hz, 1-mm field diameter). Membrane potential depolarizes during ON-phase and hyperpolarizes during OFF-phase (spikes removed for illustrative purposes). Right, plots of spike rate as a function of stimulus contrast (first harmonic amplitude) for 4- and 30-Hz stimulus temporal frequencies before (solid circles) and after (open circles) application of GABAA (GABAzine, 5 µM) and GABAC (TPMPA, 50 µM) and glycine (strychnine, 1 µM) receptor antagonists. Solid lines are Naka–Rushton fits (4Hz: control se = 1.4, inhibitory block se = 0.9, and wash se = 1.4; 30 Hz: control se = 3.1 and inhibitory block se = 4.7). Contrast gain values increase for the 4-Hz (control 2.7 ± 0.7, inhibitory block 2.9 ± 1.3, and wash 4.3 ± 1.8) and 30-Hz responses (control 4.0 ± 1.1 and inhibitory block 5.8 ± 2.3). (B) Left, family of light-evoked synaptic currents (stimulus as in A) for a single ON-parasol at 6, 12, 25, and 50% contrast. Right, average excitatory (blue) and inhibitory (red) synaptic conductances for five cells (other conventions as in Figs. 2 – 5). (C) Data shown as in (B) after the block of GABAergic and glycinergic inhibition, as in (A). Excitatory conductances persist at all contrasts and increase in amplitude. (D) Plot of the peak mean inhibitory conductance relative to excitatory conductance [peak inhibition/peak (excitation + inhibition)]. Percent of synaptic inhibition was calculated on a cell-by-cell basis. Inhibition is greatly reduced relative to excitation at lower contrasts. Solid line is a Naka–Rushton fit (se = 5.9). (E) Peak unmasked excitation before (solid circles) and after (open circles) the addition of GABA and glycine receptor antagonists plotted as a function of contrast. Solid lines connect the data points. (F) Peak ON excitatory conductances before (solid circles) and after (open circles) the addition of GABA and glycine receptor antagonists plotted as a function of contrast. Solid lines are Naka–Rushton fits (control se = 1.4 and inhibitory block se =3.3). Contrast gain increases from 1.4 ± 0.2 to 2.0 ± 0.4.
Fig. 7
Fig. 7
Temporal tuning of excitatory and inhibitory conductances for OFF-center parasol cells: high sensitivity is mediated by synaptic excitation. (A) Left, intracellular voltage recording of an OFF-parasol to 10-, 20-, and 30-Hz temporal frequency modulation (50% contrast, 1-mm stimulus diameter). Membrane potential depolarizes during OFF-phase and hyper-polarizes during ON-phase after a latency to a stimulus onset of ~35 ms (spikes removed for illustrative purposes). Right, a plot of spike rate as a function of stimulus temporal frequency (50% contrast; 1-mm stimulus diameter; first harmonic amplitude) before (solid circles) and after (open circles) application of GABAA (GABAzine, 5 µM) and GABAC (TPMPA, 50 µM) and glycine (strychnine; 1 µM) receptor antagonists. (BD) Family of stimulus-evoked synaptic currents to 10 Hz (B), 20 Hz (C) and 30 Hz (D) temporal modulation before (upper left) and after (upper right) the addition of GABAzine, TPMPA, and strychnine. Lower left and right, mean excitatory (blue) and inhibitory (red) synaptic conductances derived from sample number indicated for each associated stimulus condition. (E) Plot of percentage peak crossover inhibitory relative to excitatory conductance [peak inhibition/peak (excitation + inhibition)] as a function of temporal frequency. Percent of synaptic inhibition was calculated on a cell-by-cell basis. Crossover inhibition declines with increasing temporal frequency and is largely absent at 30 Hz, the highest temporal frequency measured. (F) Average peak OFF conductances before (solid circles) and after (open circles) the block of synaptic inhibition plotted as a function of temporal frequency.
Fig. 8
Fig. 8
Temporal tuning of excitatory and inhibitory conductances for ON-center parasol cells: high sensitivity is mediated by synaptic excitation. (A) Left, intracellular voltage recording of an ON-parasol to 10-, 20-, and 30-Hz temporal frequency modulation (50% contrast, 1-mm stimulus diameter). Membrane potential depolarizes during ON-phase and hyperpolarizes during OFF-phase after a latency to stimulus onset of ~35 ms (spikes removed for illustrative purposes). Right, plots of spike rate as a function of stimulus temporal frequency (50% contrast; 1-mm stimulus diameter; first harmonic amplitude) before (solid circles) and after (open circles) application of GABAA(GABAzine, 5 µM) and GABAC (TPMPA, 50 µM) and glycine (strychnine; 1 µM) receptor antagonists. (B–D) Family of stimulus-evoked synaptic currents to 10 Hz (B), 20 Hz (C), and 30 Hz (D) temporal modulation before (upper left) and after (upper right) the addition of GABAzine, TPMPA, and strychnine. Lower left and right, mean excitatory (blue) and inhibitory (red) synaptic conductances derived from sample number indicated for each associated stimulus condition. (E) Plot of percentage peak inhibitory conductance relative to excitatory conductance [peak inhibition/peak (excitation + inhibition)] as a function of temporal frequency. Percent of synaptic inhibition was calculated on a cell-by-cell basis. Crossover inhibitory conductance is maintained and increases relative to excitatory conductance with increasing temporal frequency. (F) Average peak ON conductances before (solid circles) and after (open circles) the block of synaptic inhibition plotted as a function of temporal frequency.
Fig. 9
Fig. 9
Application of D-AP5 linearizes the current-voltage relationship of excitatory synaptic currents and reveals similar NMDA receptor-mediated synaptic currents in both OFF and ON parasol cells. (A and B) Family of light-evoked synaptic currents (5 Hz, 2 stimulus cycles, 50% contrast, 1-mm stimulus diameter, effective quanta ~1.1 × 10⁵photons/s/µm2) from an OFF- (A) and an ON-center (B) parasol before (control, upper trace family) and after (lower trace family) application of NMDA receptor antagonist, D-AP5 (50 µM). Insets (indicated by dotted arrows) show enlargement of excitatory response phase (decrement for OFF cells, increment for ON cells) for all traces currents near ECl and Ecat indicated in blue and red, respectively. Nonlinearity at negative holding potentials is evident in traces and is greatly reduced after D-AP5 application. Plots below traces show I–V relationship in control (filled circles) and after D-AP5 (open circles) at a time point indicated by a dotted arrow. (C) Plot of subtraction of D-AP5 from control I–V gives an estimate of NMDA-mediated I–V relationship for the OFF (left plot) and ON (right plot) cell examples. Plot at center shows average I–V for 9 parasol cells (6 OFF and 3 ON cells; error bars ± s.d.). Data for the individual and averaged I–V s are least squares fit with a function that describes the voltage dependence of the NMDA receptor conductance (KMg = 3.5 mM and Vδ = 22 mV; see Materials and methods for details).
Fig. 10
Fig. 10
Isolation of NMDA receptor-mediated conductance in ON-center parasol cells. (A and B) Family of light-evoked synaptic currents (stimulus as in Fig. 9) from two ON-center parasol cells before (top current families, control, A, B), and after (lower current families, NMDA) the combined application of AMPA/kainate glutamate receptor antagonists NBQX (10 µM) and UBP 310 (10 µM) and the GABAA, GABAC, and glycine receptor antagonists (GABAzine, 5 µM; TPMPA, 50 µM, and strychnine, 1 µM, respectively). NMDA receptor-mediated postsynaptic currents were abolished with additional application of NMDA receptor antagonist D-AP5 (50 µM; lower traces in B, D-AP5). (C) I–V plots on left and right show mean IV relationship for NMDA-mediated currents over the time indicated by the gray shading in (A and B) (IV plots generated at 1-ms intervals) for each of the ON parasol cells; the line fit to this data describes the voltage dependence of the NMDA conductance (as in Fig. 9; see Materials and methods, eqn. 1). Middle IV plot in C shows isolated mean NMDA IV curves for four ON cells (black solid and dotted lines), normalized by their NMDA-mediated conductances. The red line plots the IV with the mean fit parameters for KMg (3.3 mM ± 0.6; error bars ± s.d.) and Vδ (19.5 ± 1.7 mV; error bars ± s.d.). The inset to the middle panel plots NMDA conductance (nS) normalized to 30 nS as a function of physiological voltage (V) for each of the IVs (black solid and dotted lines) and the average (red line). For this dataset, half maximal NMDA conductance = −20 m V. (D and E) Application of the NMDA conductance model shown in C to resolve AMPA/Ka and NMDA conductances during the excitatory phase of the control ON cell light-evoked currents shown in (A and B). (D) Top, family of synaptic currents from (A) for control and NMDA currents across time points indicated by the corresponding vertical dotted lines in (A). Middle, IV relationship at time point indicated by the gray vertical bar shown for the control and NMDA currents; the black line is the fit of a model (see Materials and methods for details) that sums a linear inhibitory (red line), excitatory (blue line), and nonlinear NMDA IV relationship (green lines). Green dotted lines indicate NMDA chord conductance at −55 mV. Bottom, total excitatory (black line), AMPA/Ka, (GAMPA/Ka blue lines), NMDA (GNMDA-55, green lines), and total inhibitory (Gin, red lines) conductances calculated over time course bounded by the dotted lines in (A). (E) Current families, IV relationships and conductances as described for (D), but applied to control and NMDA receptor-mediated current for ON cell shown in (B).
Fig. 11
Fig. 11
Contribution of NMDA receptors to OFF and ON parasol cells contrast sensitivity. (A and B) Effect of D-AP5 (50 µM), a selective NMDA receptor antagonist, on spike discharge in response to variation in stimulus contrast (1-mm field diameter) for OFF (A) and ON (B) parasol cells. Plots show spike response amplitude as a function of contrast for control (solid circles), D-AP5 application (open circles) and wash of D-AP5 (gray circles). Solid lines are Naka–Rushton fits (OFF control se = 0.8, D-AP5 se = 0.5, and wash se = 1.8; ON control se = 2.1, D-AP5 se = 1.9, and wash se = 3.8). Contrast gain values were not significantly altered by D-AP5 in OFF (control 3.6 ± 1.0, D-AP5 4.7 ± 1.1, and wash 3.1 ± 0.4) or ON cells (control 2.8 ± 0.5, D-AP5 2.1 ± 0.4, and wash 3.1 ± 0.4). Inset plots to the right of (A and B) show fractional change in spike rate relative to control values; OFF cells showed a smaller reduction in spike rate than ON cells and also showed a paradoxical increase in spike rate relative to control at the lowest stimulus contrasts. (C and D) Resolution of AMPA/Ka and NMDA conductances at 6, 12, 25, and 50% stimulus contrast during the block of synaptic inhibition (GABAA, GABAC, and glycine receptor block as described in Fig. 5 and 6) for OFF (B) and ON (F) parasol cells. Families of light-evoked post-synaptic currents shown on the left; derived AMPA/Ka, NMDA and inhibitory conductances shown on the right using the model described in Fig. 10 (see also Materials and methods); IV plots for the 50% responses shown below current traces. (E and F) Plots of peak GAMPA/Ka and GNMDA-55 calculated from control data (circles) and data collected after the block of synaptic inhibition (diamonds) as a function of contrast for OFF (C) and ON (G) parasol cells. Solid lines are Naka–Rushton fits (OFF cells: control AMPA se = 1.4 and NMDA se = 1.4, and inhibitory block AMPA se = 2.0 and NMDA se< 0.3; ON cells: control AMPA se = 1.1 and NMDA se = 0.2 and inhibitory block AMPA se = 2.2 and NMDA se = 0.2). GAMPA/Ka shows steep contrast gain and saturation (OFF cells: contrast gain was 1.6 ± 0.9 for control and 1.3 ± 0.7 with inhibition blocked; ON cells: contrast gain was 0.7 ± 0.1 for control and 1.2 ± 0.2 with inhibition blocked). GNMDA-55 shows a shallow contrast gain without saturation (OFF cells: contrast gain was 0.5 ± 0.2 for control and 0.2 ± 0.0 with inhibition blocked; ON cells: contrast gain was 0.2 ± 0.0 for control and 0.3 ± 0.1 with inhibition blocked). The block of synaptic inhibition increases GAMPA/Ka conductance but has no significant effect on the GNMDA. (G and H) Plot of percentage GNMDA-55 [peak NMDA conductance/(peak total excitatory conductance + peak NMDA conductance)] as a function of contrast for OFF (G) and ON (H) cells calculated from control data (circles) and data collected after the block of inhibition (diamonds). The dotted line indicates the average. As stimulus contrast decreases, the NMDA contribution increases.
Fig. 12
Fig. 12
Effect of stimulus temporal frequency on AMPA/kainate and NMDA conductances in OFF and ON parasol cells. (A and B) Synaptic current families and derived GAMPA/Ka and GNMDA-55 (conventions as in Fig. 11) for OFF (A) and ON (B) parasol cells at 10 Hz (top), 20 Hz (middle), and 30 Hz (bottom) stimulus temporal frequencies (50 and 100% stimulus contrast, 1-mm stimulus field diameter; effective quanta ~1.1 × 10⁵ photons/s/µm2) after application of GABAA (GABAzine, 5 µM) and GABAC (TPMPA, 50 µM), and glycine (strychnine, 1 µM) receptor antagonists. Insets below each current family show the GAMPA/Ka and GNMDA-55 over the stimulus-evoked conductance change indicated by the dotted lines in current traces. At 20 and 30 Hz, the OFF cells clearly show a pure GAMPA/Ka fast transient and delayed smaller GNMDA, as illustrated by the IV plots either side of the 30-Hz conductances, respectively. IV time points (T1 and T2) are indicated by gray boxes in the 30-Hz current traces. The frequency doubling makes it difficult to see the distinction in the ON cells. (C and D) Plots of peak GAMPA/Ka and GNMDA at four stimulus temporal frequencies for OFF (C) and ON (D) parasol cells calculated from control data (circles) and data collected after the block of inhibition (diamonds). The larger GAMPA/Ka peaks at mid-temporal frequencies and declines at higher frequencies, ~47% decrease for the OFF parasols (16% drop for control vs. 68% for inhibitory block) and ~72% drop for the ON parasols (65% drop for control vs. 76% for inhibitory block) mirroring the temporal frequency tuning observed in the ON and OFF cell spike discharge (Figs. 7A and 8A). By contrast, GNMDA remains small and unchanged (6 ± 1 nS for OFF cells and 8 ± 1 nS for ON cells) for both control and inhibitory block conditions. (E and F) Plots of percentage GNMDA-55 [peak NMDA conductance/(peak total excitatory conductance + peak NMDA conductance)] as a function of temporal frequency for OFF (E) and ON (F) cells calculated from control data (circles) and data collected after the block of inhibition (diamonds). GNMDA contributed on average ~18% for both control and inhibitory block conditions for both OFF (20 ± 3%) and ON parasol cells (15 ± 1%). The dotted line indicates the average.

References

    1. Abbott CJ, Percival KA, Martin PR, Grunert U. Amacrine and bipolar inputs to midget and parasol ganglion cells in marmoset retina. Visual Neuroscience. 2012;29:157–168. - PubMed
    1. Ascher P, Nowak L. The role of divalent cations in the N-methyl-D-aspartate responses of mouse central neurones in culture. The Journal of Physiology. 1988;399:247–266. - PMC - PubMed
    1. Borg-Graham LJ. The computation of directional selectivity in the retina occurs presynaptic to the ganglion cell. Nature Nueroscience. 2001;4:176–183. - PubMed
    1. Boos R, Muller F, Wassle H. Actions of excitatory amino acids on brisk ganglion cells in the cat retina. Journal of Neurophysiology. 1990;64:1368–1379. - PubMed
    1. Bormann J, Hamill OP, Sakmann B. Mechanism of anion permeation through channels gated by glycine and gamma-aminobutyric acid in mouse cultured spinal neurones. The Journal of Physiology. 1987;385:243–286. - PMC - PubMed

Publication types

MeSH terms

Substances

LinkOut - more resources