

Impaired insulin signaling affects renal organic anion transporter 3 (Oat3) function in streptozotocin-induced diabetic rats
- PMID: 24801871
- PMCID: PMC4011703
- DOI: 10.1371/journal.pone.0096236
Impaired insulin signaling affects renal organic anion transporter 3 (Oat3) function in streptozotocin-induced diabetic rats
Retraction in
-
Retraction: Impaired Insulin Signaling Affects Renal Organic Anion Transporter 3 (Oat3) Function in Streptozotocin-Induced Diabetic Rats.PLoS One. 2018 Aug 21;13(8):e0202898. doi: 10.1371/journal.pone.0202898. eCollection 2018. PLoS One. 2018. PMID: 30130374 Free PMC article. No abstract available.
Abstract
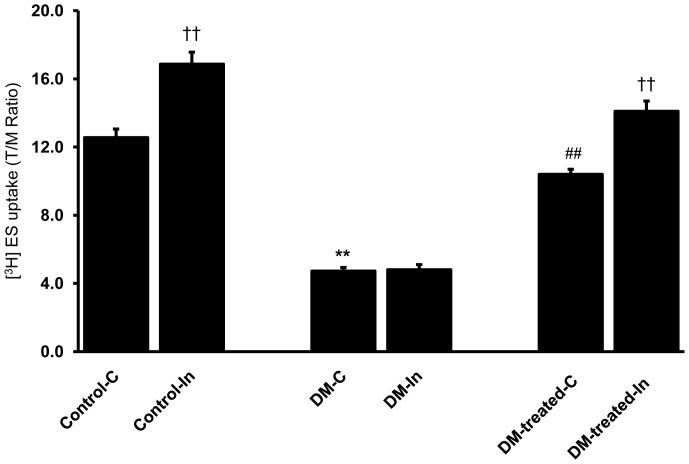
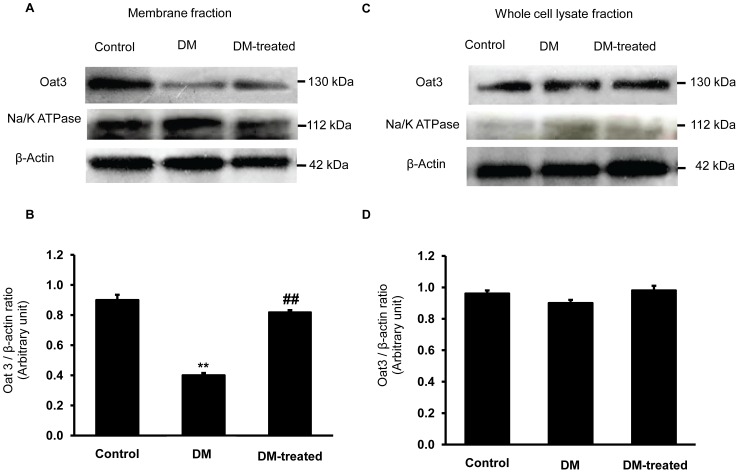
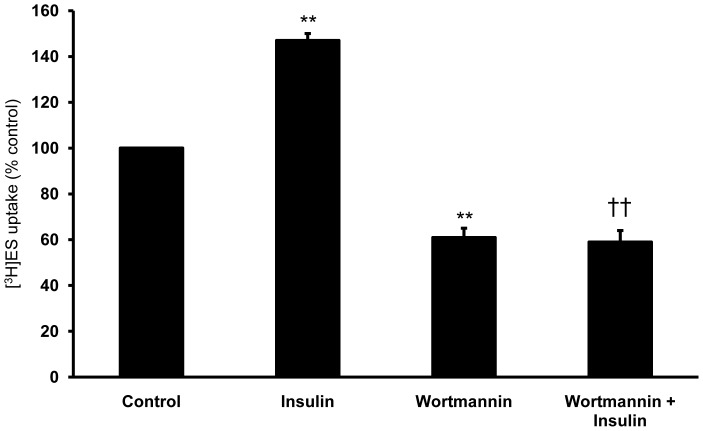
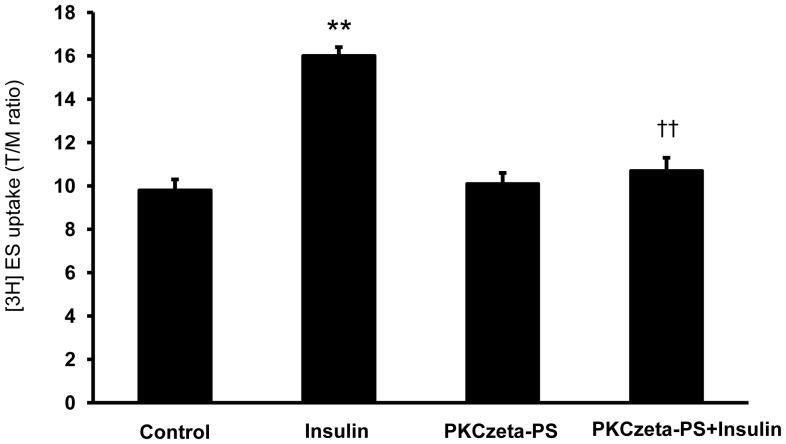
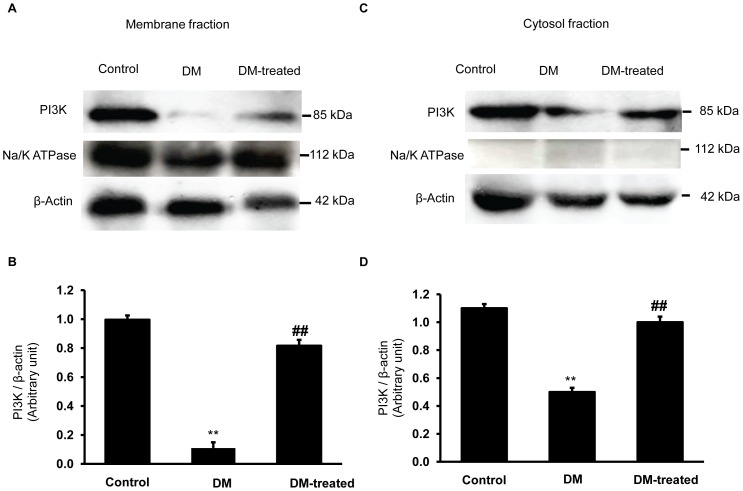
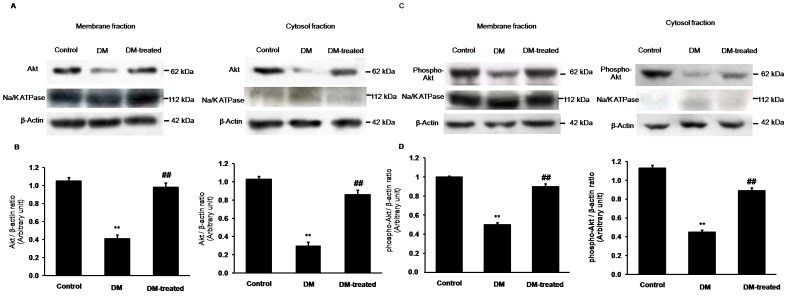
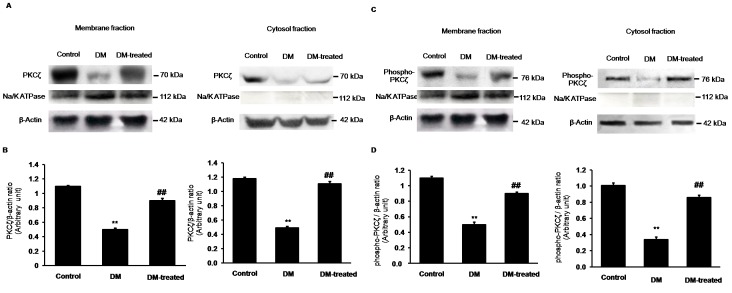
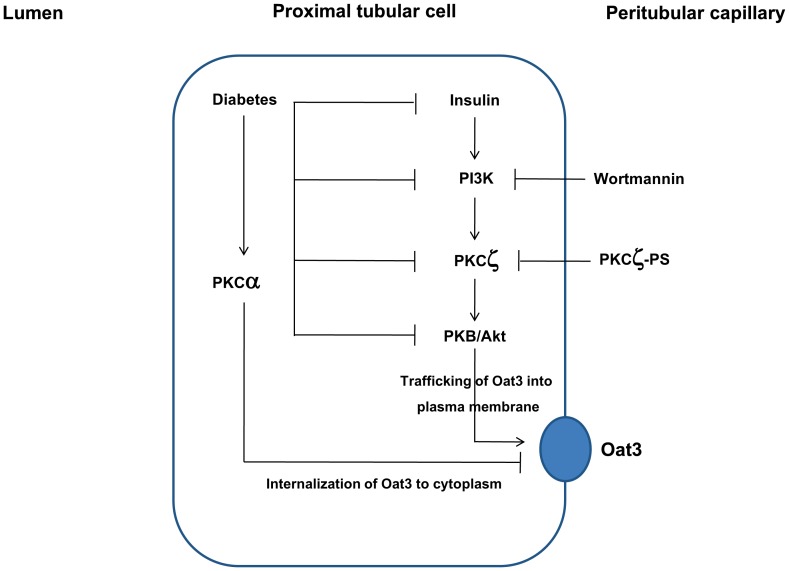
Organic anion transporter 3 (Oat3) is a major renal Oats expressed in the basolateral membrane of renal proximal tubule cells. We have recently reported decreases in renal Oat3 function and expression in diabetic rats and these changes were recovered after insulin treatment for four weeks. However, the mechanisms by which insulin restored these changes have not been elucidated. In this study, we hypothesized that insulin signaling mediators might play a crucial role in the regulation of renal Oat3 function. Experimental diabetic rats were induced by a single intraperitoneal injection of streptozotocin (65 mg/kg). One week after injection, animals showing blood glucose above 250 mg/dL were considered to be diabetic and used for the experiment in which insulin-treated diabetic rats were subcutaneously injected daily with insulin for four weeks. Estrone sulfate (ES) uptake into renal cortical slices was examined to reflect the renal Oat3 function. The results showed that pre-incubation with insulin for 30 min (short term) stimulated [3H]ES uptake into the renal cortical slices of normal control rats. In the untreated diabetic rats, pre-incubation with insulin for 30 min failed to stimulate renal Oat3 activity. The unresponsiveness of renal Oat3 activity to insulin in the untreated diabetic rats suggests the impairment of insulin signaling. Indeed, pre-incubation with phosphoinositide 3-kinase (PI3K) and protein kinase C zeta (PKCζ) inhibitors inhibited insulin-stimulated renal Oat3 activity. In addition, the expressions of PI3K, Akt and PKCζ in the renal cortex of diabetic rats were markedly decreased. Prolonged insulin treatment in diabetic rats restored these alterations toward normal levels. Our data suggest that the decreases in both function and expression of renal Oat3 in diabetes are associated with an impairment of renal insulin-induced Akt/PKB activation through PI3K/PKCζ/Akt/PKB signaling pathway.
Conflict of interest statement
Figures
Similar articles
-
The additive effects of atorvastatin and insulin on renal function and renal organic anion transporter 3 function in diabetic rats.Sci Rep. 2017 Oct 19;7(1):13532. doi: 10.1038/s41598-017-13206-5. Sci Rep. 2017. PMID: 29051569 Free PMC article.
-
Decreased renal organic anion transporter 3 expression in type 1 diabetic rats.Am J Med Sci. 2014 Mar;347(3):221-7. doi: 10.1097/MAJ.0b013e3182831740. Am J Med Sci. 2014. PMID: 23470271
-
Antioxidant and renoprotective effects of Spirogyra neglecta (Hassall) Kützing extract in experimental type 2 diabetic rats.Biomed Res Int. 2013;2013:820786. doi: 10.1155/2013/820786. Epub 2013 Jun 3. Biomed Res Int. 2013. PMID: 23862157 Free PMC article.
-
Antidiabetic and renoprotective effects of Cladophora glomerata Kützing extract in experimental type 2 diabetic rats: a potential nutraceutical product for diabetic nephropathy.J Diabetes Res. 2015;2015:320167. doi: 10.1155/2015/320167. Epub 2015 Mar 26. J Diabetes Res. 2015. PMID: 25883984 Free PMC article.
-
The molecular and cellular physiology of basolateral organic anion transport in mammalian renal tubules.Biochim Biophys Acta. 2003 Dec 30;1618(2):185-93. doi: 10.1016/j.bbamem.2003.08.015. Biochim Biophys Acta. 2003. PMID: 14729155 Review.
Cited by
-
Retraction: Impaired Insulin Signaling Affects Renal Organic Anion Transporter 3 (Oat3) Function in Streptozotocin-Induced Diabetic Rats.PLoS One. 2018 Aug 21;13(8):e0202898. doi: 10.1371/journal.pone.0202898. eCollection 2018. PLoS One. 2018. PMID: 30130374 Free PMC article. No abstract available.
-
Peptide Hormone Insulin Regulates Function, Expression, and SUMOylation of Organic Anion Transporter 3.AAPS J. 2021 Mar 11;23(2):41. doi: 10.1208/s12248-021-00575-z. AAPS J. 2021. PMID: 33709304 Free PMC article.
-
Increment of Lysosomal Biogenesis by Combined Extracts of Gum Arabic, Parsley, and Corn Silk: A Reparative Mechanism in Mice Renal Cells.Evid Based Complement Alternat Med. 2020 Jul 11;2020:8631258. doi: 10.1155/2020/8631258. eCollection 2020. Evid Based Complement Alternat Med. 2020. PMID: 32733590 Free PMC article.
-
Angiotensin II induces apoptosis of cardiac microvascular endothelial cells via regulating PTP1B/PI3K/Akt pathway.In Vitro Cell Dev Biol Anim. 2019 Dec;55(10):801-811. doi: 10.1007/s11626-019-00395-8. Epub 2019 Sep 9. In Vitro Cell Dev Biol Anim. 2019. PMID: 31502193
-
The additive effects of atorvastatin and insulin on renal function and renal organic anion transporter 3 function in diabetic rats.Sci Rep. 2017 Oct 19;7(1):13532. doi: 10.1038/s41598-017-13206-5. Sci Rep. 2017. PMID: 29051569 Free PMC article.
References
-
- Inui K, Okuda M (1998) Cellular and molecular mechanisms of renal tubular secretion of organic anions and cations. Clin Exp Nephrol 2: 100–108.
-
- Inui KI, Masuda S, Saito H (2000) Cellular and molecular aspects of drug transport in the kidney. Kidney Int 58: 944–958. - PubMed
-
- Sweet DH, Chan LM, Walden R, Yang XP, Miller DS, et al. (2003) Organic anion transporter 3 (Slc22a8) is a dicarboxylate exchanger indirectly coupled to the Na+ gradient. Am J Physiol Renal Physiol 284: F763–F769. - PubMed
-
- Sekine T, Cha SH, Endou H (2000) The multispecific organic anion transporter (OAT) family. Pflugers Arch 440(3): 337–350. - PubMed
-
- VanWert AL, Michael R, Gionfriddoa MR, Sweet DH (2010) Organic Anion Transporters: Discovery, Pharmacology, Regulation and Roles in Pathophysiology. Biopharm Drug Dispos 31: 1–71. - PubMed
Publication types
MeSH terms
Substances
LinkOut - more resources
Full Text Sources
Other Literature Sources
Medical
Miscellaneous
