

Objective assessment of fall risk in Parkinson's disease using a body-fixed sensor worn for 3 days
- PMID: 24801889
- PMCID: PMC4011791
- DOI: 10.1371/journal.pone.0096675
Objective assessment of fall risk in Parkinson's disease using a body-fixed sensor worn for 3 days
Abstract
Background: Patients with Parkinson's disease (PD) suffer from a high fall risk. Previous approaches for evaluating fall risk are based on self-report or testing at a given time point and may, therefore, be insufficient to optimally capture fall risk. We tested, for the first time, whether metrics derived from 3 day continuous recordings are associated with fall risk in PD.
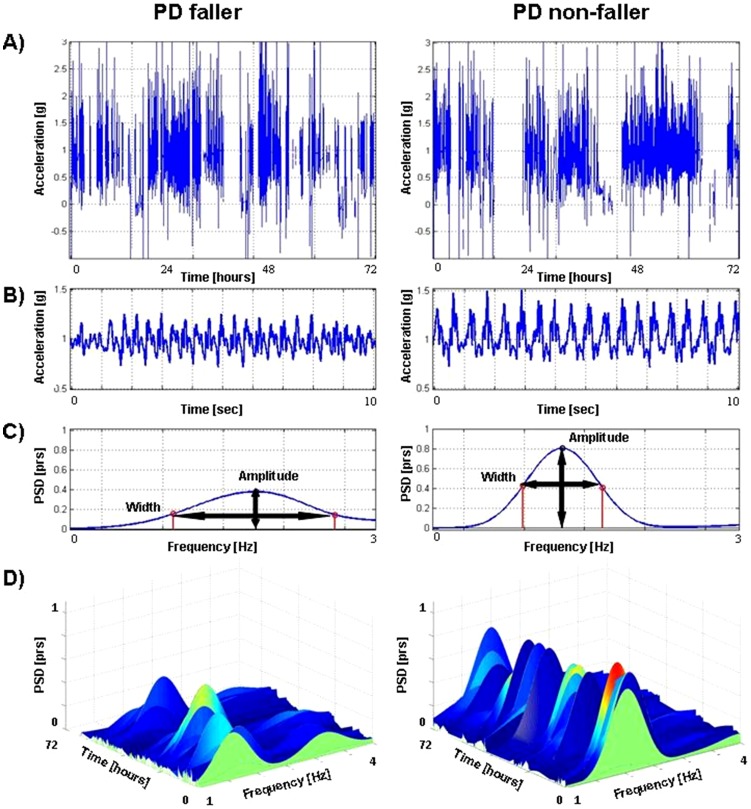
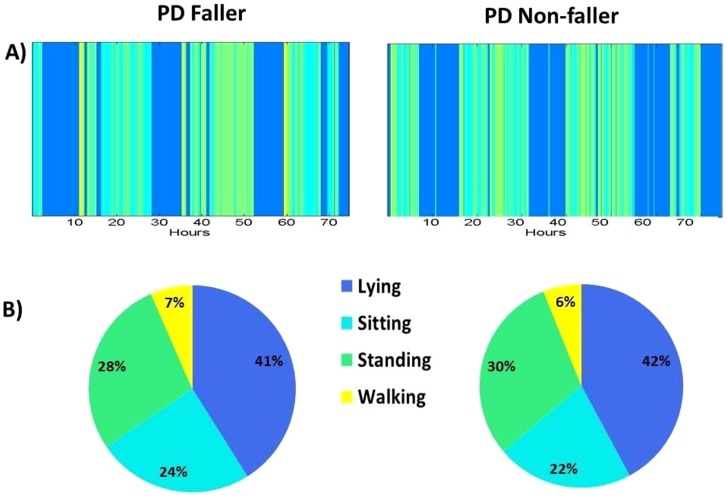
Methods and materials: 107 patients (Hoehn & Yahr Stage: 2.6±0.7) wore a small, body-fixed sensor (3D accelerometer) on lower back for 3 days. Walking quantity (e.g., steps per 3-days) and quality (e.g., frequency-derived measures of gait variability) were determined. Subjects were classified as fallers or non-fallers based on fall history. Subjects were also followed for one year to evaluate predictors of the transition from non-faller to faller.
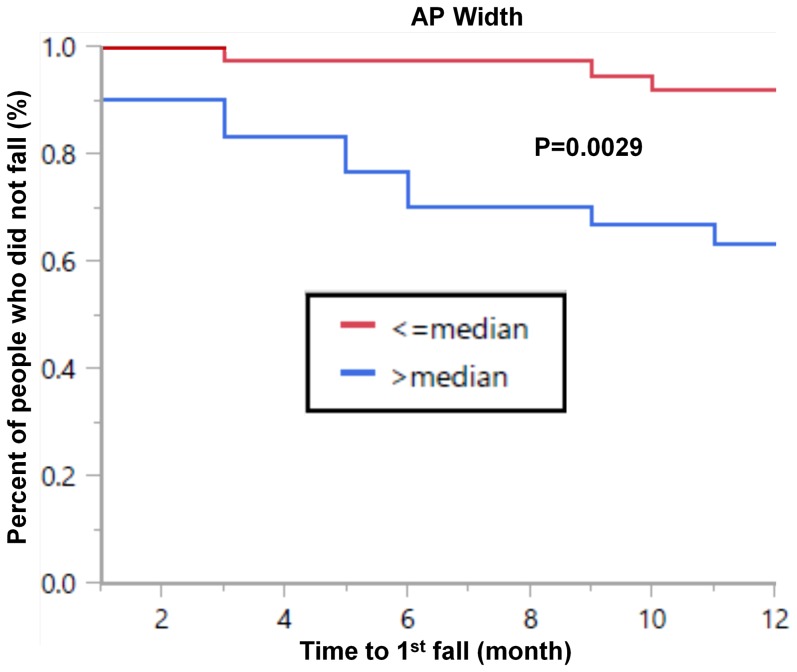
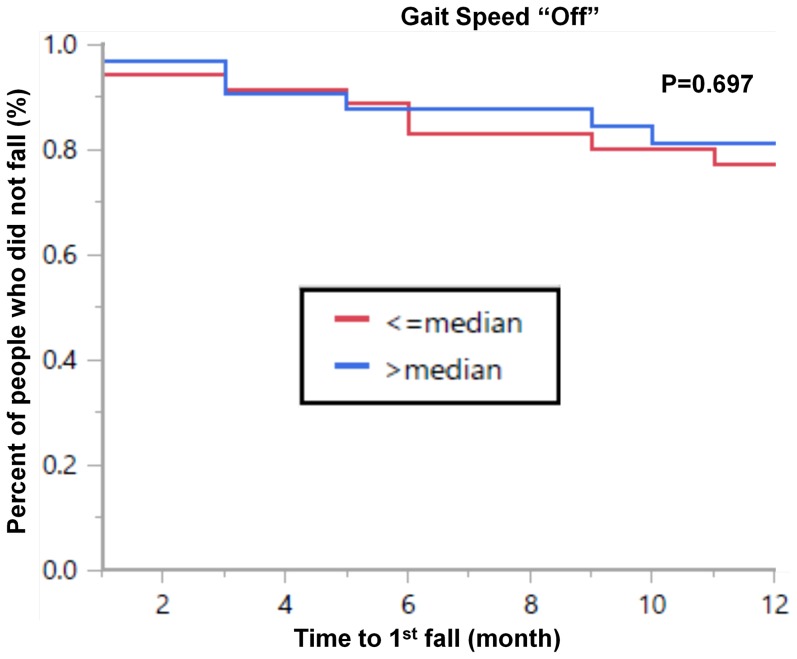
Results: The 3 day acceleration derived measures were significantly different in fallers and non-fallers and were significantly correlated with previously validated measures of fall risk. Walking quantity was similar in the two groups. In contrast, the fallers walked with higher step-to-step variability, e.g., anterior-posterior width of the dominant frequency was larger (p = 0.012) in the fallers (0.78 ± 0.17 Hz) compared to the non-fallers (0.71 ± 0.07 Hz). Among subjects who reported no falls in the year prior to testing, sensor-derived measures predicted the time to first fall (p = 0.0034), whereas many traditional measures did not. Cox regression analysis showed that anterior-posterior width was significantly (p = 0.0039) associated with time to fall during the follow-up period, even after adjusting for traditional measures.
Conclusions/significance: These findings indicate that a body-fixed sensor worn continuously can evaluate fall risk in PD. This sensor-based approach was able to identify transition from non-faller to faller, whereas many traditional metrics were not successful. This approach may facilitate earlier detection of fall risk and may in the future, help reduce high costs associated with falls.
Conflict of interest statement
Figures
References
-
- Kerr GK, Worringham CJ, Cole MH, Lacherez PF, Wood JM, et al. (2010) Predictors of future falls in Parkinson disease. Neurology 75: 116–124. - PubMed
-
- Ashburn A, Stack E, Pickering RM, Ward CD (2001) A community-dwelling sample of people with Parkinson's disease: characteristics of fallers and non-fallers. Age Ageing 30: 47–52. - PubMed
-
- Bloem BR, Grimbergen YA, Cramer M, Willemsen M, Zwinderman AH (2001) Prospective assessment of falls in Parkinson's disease. J Neurol 248: 950–958. - PubMed
-
- Ashburn A, Stack E, Pickering RM, Ward CD (2001) Predicting fallers in a community-based sample of people with Parkinson's disease. Gerontology 47: 277–281. - PubMed
Publication types
MeSH terms
Grants and funding
LinkOut - more resources
Full Text Sources
Other Literature Sources
Medical
