. 2014 May 14;136(19):7152-8.
doi: 10.1021/ja500327g. Epub 2014 May 6.

Site-specific promoter caging enables optochemical gene activation in cells and animals

Affiliations

Site-specific promoter caging enables optochemical gene activation in cells and animals

James Hemphill et al. J Am Chem Soc. .

Abstract

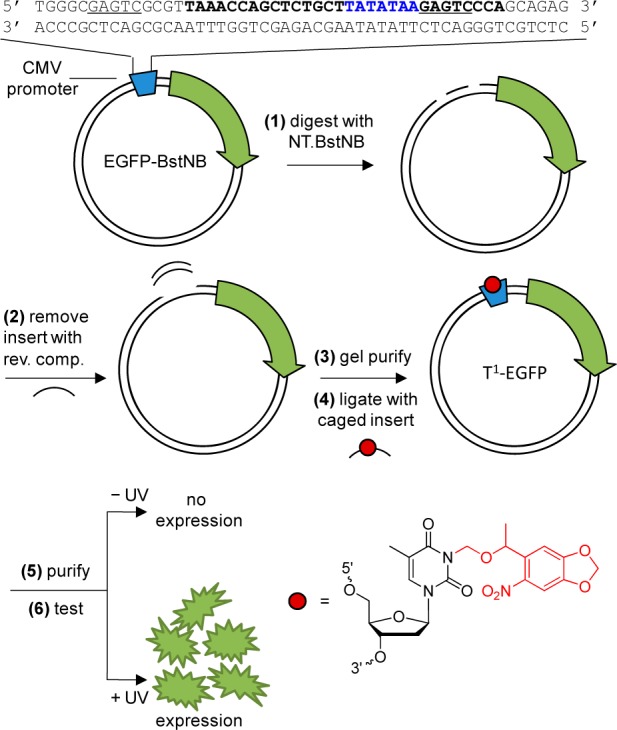
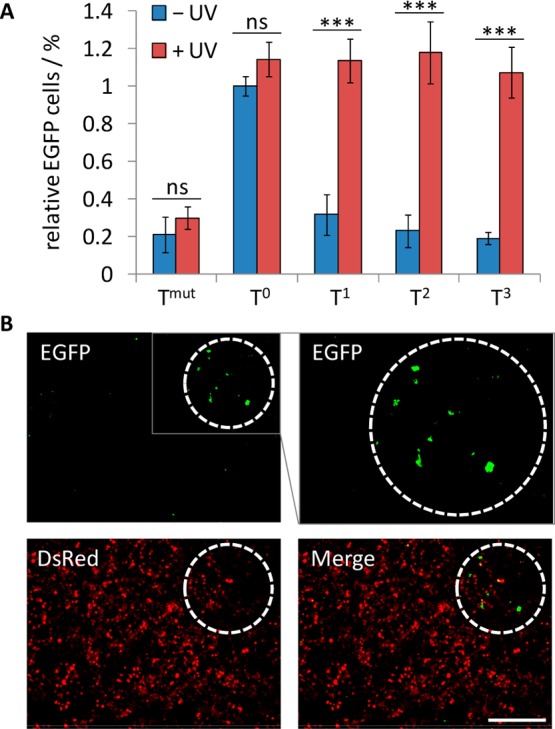
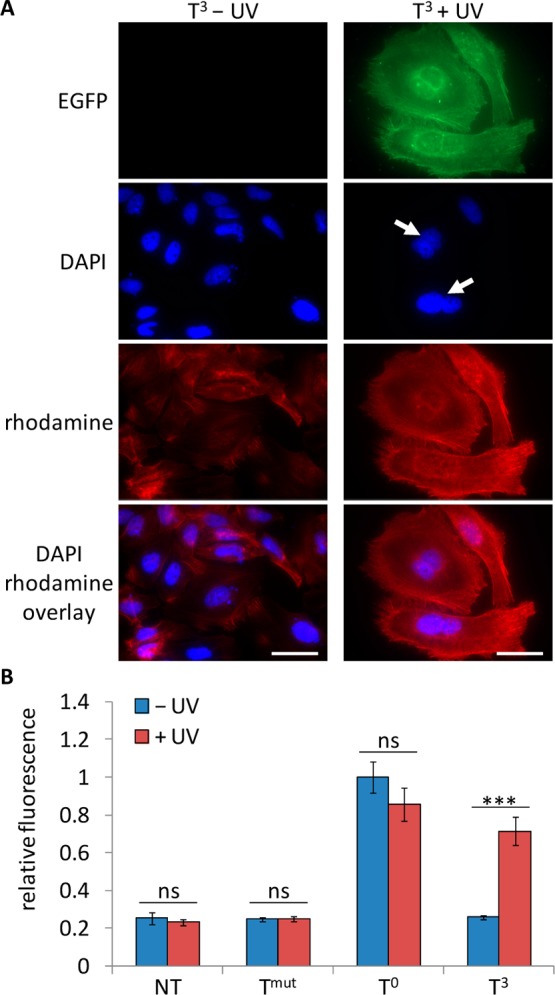
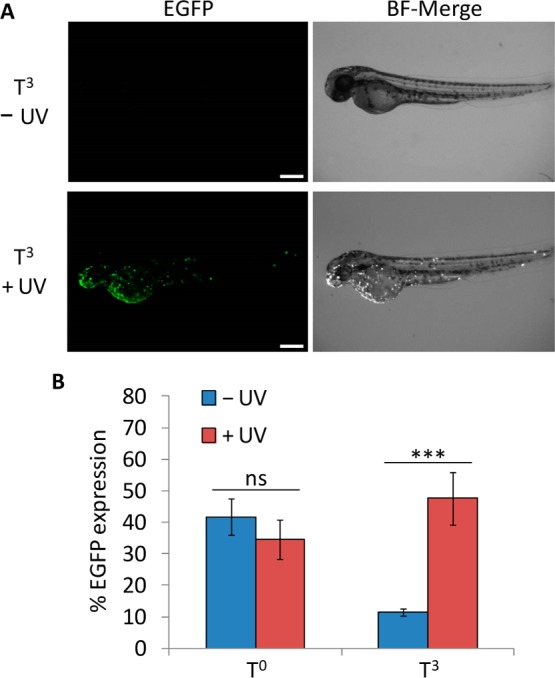
In cell and molecular biology, double-stranded circular DNA constructs, known as plasmids, are extensively used to express a gene of interest. These gene expression systems rely on a specific promoter region to drive the transcription of genes either constitutively (i.e., in a continually "ON" state) or conditionally (i.e., in response to a specific transcription initiator). However, controlling plasmid-based expression with high spatial and temporal resolution in cellular environments and in multicellular organisms remains challenging. To overcome this limitation, we have site-specifically installed nucleobase-caging groups within a plasmid promoter region to enable optochemical control of transcription and, thus, gene expression, via photolysis of the caging groups. Through the light-responsive modification of plasmid-based gene expression systems, we have demonstrated optochemical activation of an exogenous fluorescent reporter gene in both tissue culture and a live animal model, as well as light-induced overexpression of an endogenous signaling protein.


Figures

Figure 1
Figure 1
Construction of the site-specifically caged plasmids. (1) pEGFP-Bst is digested with Nt.BstNB and (2) annealed with the reverse complement to remove the TATA box region. (3) The digested plasmid is gel purified and (4) ligated with a phosphorylated caged TATA box insert. (5) The caged plasmid is then column-purified and (6) applied in mammalian cells or live animal models that were either kept in the dark (no expression of EGFP) or irradiated with UV light (EGFP expression). The restriction sites are underlined and the TATA box recognition sequence is shown in blue. The NPOM-caged thymidine is represented by a red circle and the NPOM modification is indicated in red within the nucleotide structure.
Figure 2
Figure 2
(A) Quantification of light-activated EGFP expression. HEK293T cells were transfected with noncaged and caged EGFP plasmids and a DsRed control plasmid. The cells were irradiated for 5 min (365 nm, 25 W) or kept in the dark. After 48 h incubation, the cells were analyzed by flow cytometry. The number of cells expressing both EGFP and DsRed was normalized to the number of cells expressing only DsRed and set relative to the noncaged plasmid. Standard deviations were calculated form three individual experiments. ns = not significant (P > 0.05), *** = highly significant (P < 0.001). (B) Spatial activation of EGFP expression. HEK293T cells were transfected with T3-caged EGFP and DsRed plasmids. Cells within the white dashed circle were irradiated through a microscope filter cube (DAPI, BP377/28, 40×) for 30 s and were imaged (5× magnification) after 48 h incubation. An enlarged region of the EGFP channel is shown in the gray box. Scale bar indicates 200 μm.
Figure 3
Figure 3
(A) Light-induced expression of Plk3. HeLa cells were transfected with the T3-caged EGFP-Plk3 plasmid followed by irradiation of the caged construct (365 nm, 5 min, 25 W) and incubated for 48 h. The cells were then fixed and stained with DAPI (nuclei) and rhodamine phalloidin (actin filaments) prior to imaging (63× magnification). White arrows indicate binucleated cells, and scale bars indicate 50 μm. (B) Light-induced activation of caspase-3. HeLa cells were transfected with the Tmut negative control, T0-noncaged, and T3-caged EGFP-Plk3 plasmids. The cells were either irradiated (365 nm, 5 min, 25 W) or kept in the dark and lysed after 48 h. The lysate was assayed with a fluorogenic caspase-3 substrate (Calbiochem). Fluorescence units were normalized to the noncaged control, and standard deviations were calculated from three individual experiments. ns = not significant (P > 0.05), *** = highly significant (P < 0.001).
Figure 4
Figure 4
(A) Light-induced EGFP expression in zebrafish. Embryos were microinjected at the 1-cell stage with the T3-caged EGFP expression plasmid or the noncaged T0 plasmid. Embryos were then irradiated (2 min, 365 nm) or kept in the dark and incubated at 28 °C for 24 hpf, followed by dechorionation. Imaging was performed at 48 hpf. Scale bars indicate 250 μm. (B) Frequency of the EGFP phenotype for each condition. Error bars represent standard deviations from three (T0) or four (T3) independent experiments. N = 9–24. ns = not significant (P > 0.05), *** = highly significant (P < 0.001).

Similar articles

Cited by

References

    1. Mayer G.; Heckel A. Angew. Chem., Int. Ed. Engl. 2006, 45, 4900. - PubMed
    1. Deiters A. Curr. Opin Chem. Biol. 2009, 13, 678. - PMC - PubMed
    1. Young D. D.; Deiters A. Org. Biomol. Chem. 2007, 5, 999. - PubMed
    1. Deiters A. ChemBioChem 2010, 11, 47. - PMC - PubMed
    1. Lawrence D. S. Curr. Opin Chem. Biol. 2005, 9, 570. - PubMed

Publication types

Substances