. 2014 May 6;9(5):e96622.
doi: 10.1371/journal.pone.0096622. eCollection 2014.

Advantages of repeated low dose against single high dose of kainate in C57BL/6J mouse model of status epilepticus: behavioral and electroencephalographic studies

Affiliations

Advantages of repeated low dose against single high dose of kainate in C57BL/6J mouse model of status epilepticus: behavioral and electroencephalographic studies

Karen Tse et al. PLoS One. .

Abstract

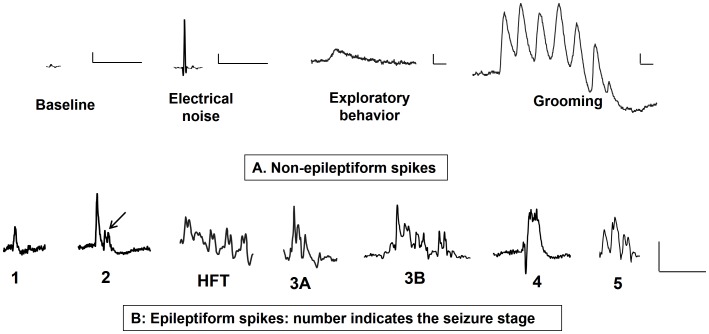
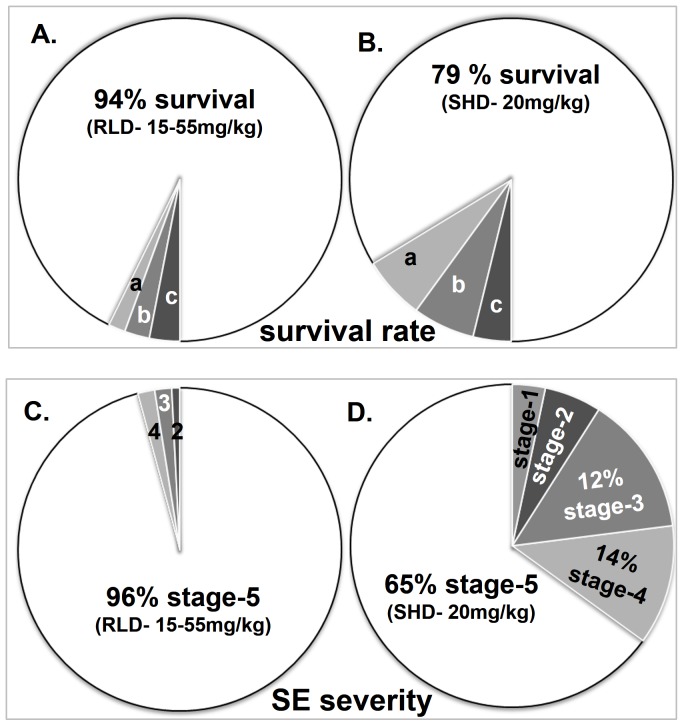
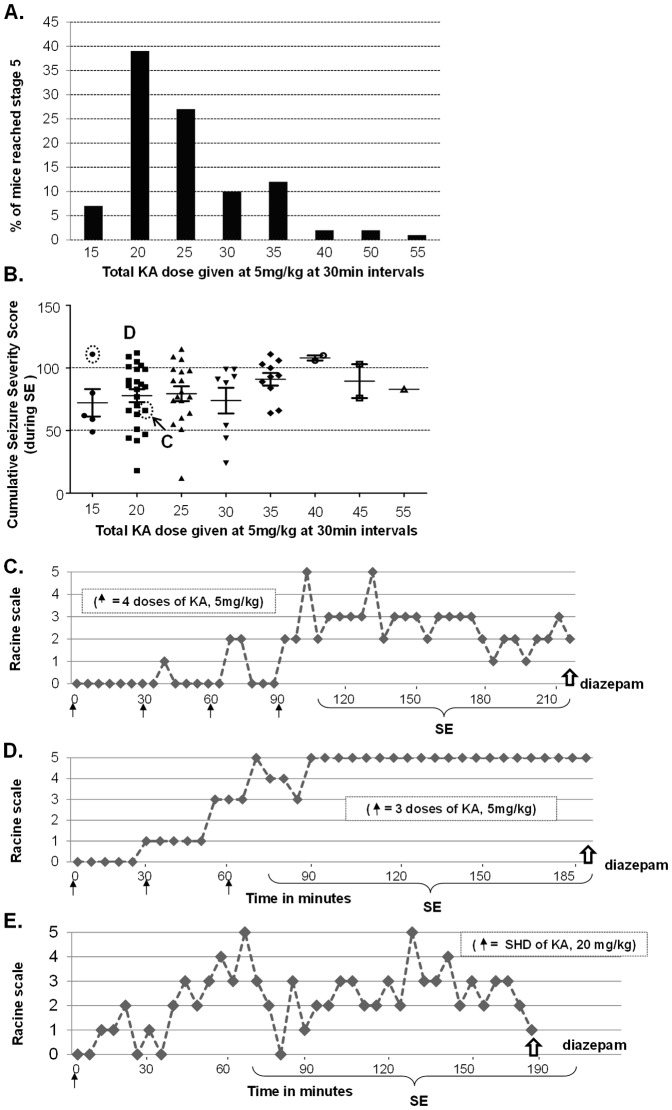
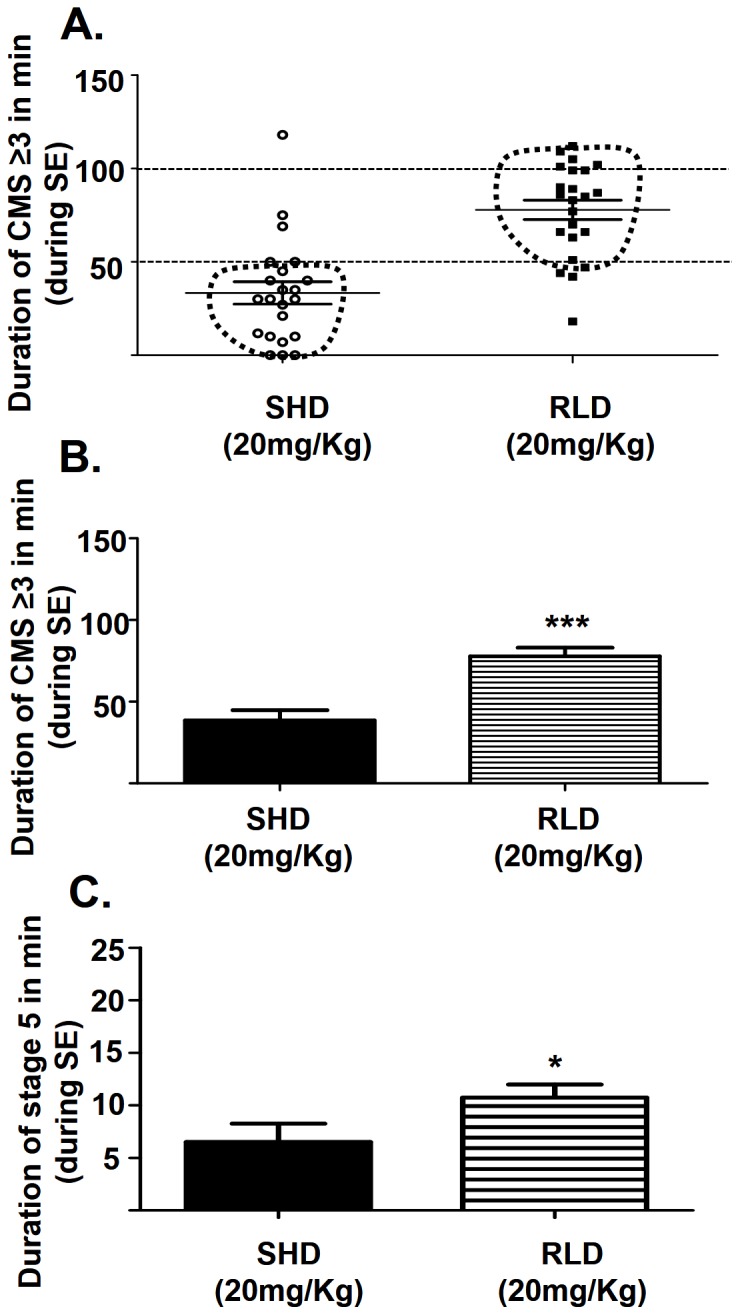
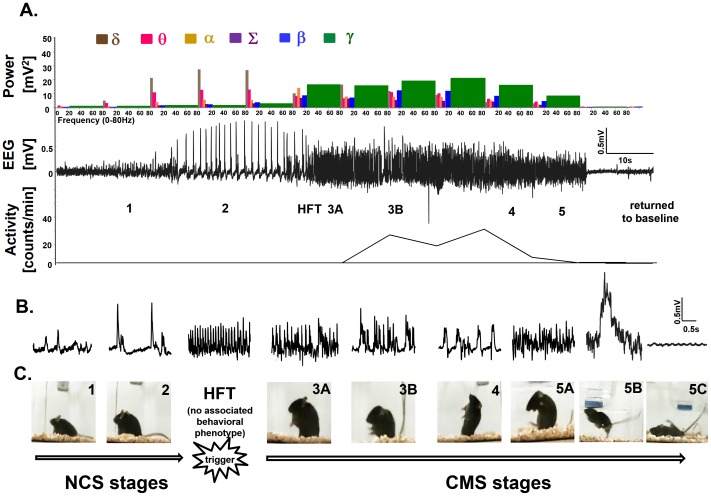
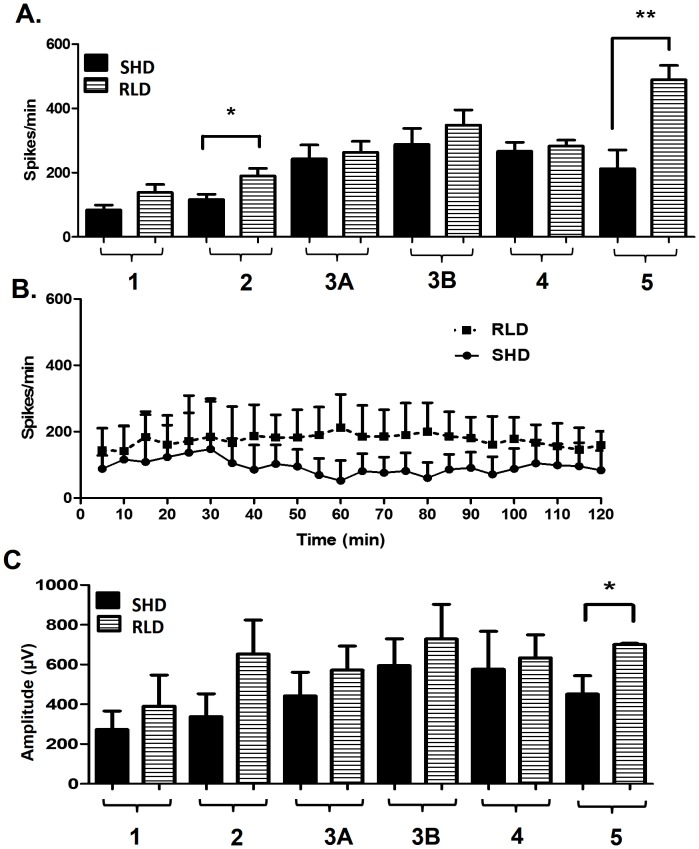
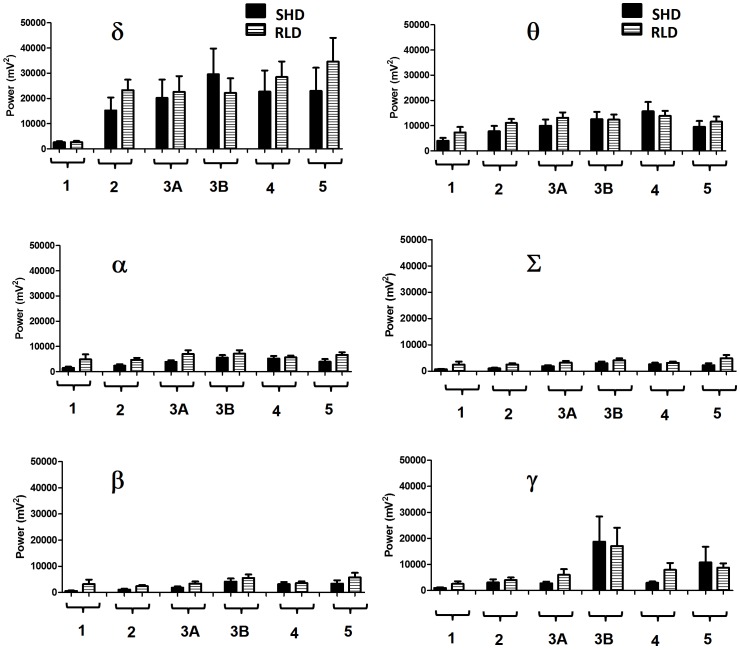
A refined kainate (KA) C57BL/6J mouse model of status epilepticus (SE) using a repeated low dose (RLD) of KA (5 mg/kg, intraperitoneal; at 30 min intervals) was compared with the established single high dose (SHD) of KA (20 mg/kg, intraperitoneal) model. In the RLD group, increased duration of convulsive motor seizures (CMS, Racine scale stage ≥3) with a significant reduction in mortality from 21% to 6% and decreased variability in seizure severity between animals/batches were observed when compared to the SHD group. There was a significant increase in the percentage of animals that reached stage-5 seizures (65% versus 96%) in the RLD group. Integrated real-time video-EEG analysis of both groups, using NeuroScore software, revealed stage-specific spikes and power spectral density characteristics. When the seizures progressed from non-convulsive seizures (NCS, stage 1-2) to CMS (stage 3-5), the delta power decreased which was followed by an increase in gamma and beta power. A transient increase in alpha and sigma power marked the transition from NCS to CMS with characteristic 'high frequency trigger' spikes on the EEG, which had no behavioral expression. During SE the spike rate was higher in the RLD group than in the SHD group. Overall these results confirm that RLD of KA is a more robust and consistent mouse model of SE than the SHD of KA mouse model.


Conflict of interest statement

Competing Interests: The authors have declared that no competing interests exist.

Figures

Figure 1
Figure 1. Individual spike characteristics on EEG.
The baseline non-epileptiform spike and artifact spikes are shown in the top panel (A). The bottom panel (B) represents epileptiform spikes at different stages of seizures. Baseline spike, stage-1 and stage-2 epileptiform spikes are simple while, high frequency trigger (HFT), stage-3, -4 and -5 were complex. Stage-1 epileptiform spikes were similar to baseline spikes but had higher amplitude. Stage-2 epileptiform spikes had higher amplitude than stage-1. As stage-2 progressed towards CMS the spikes became complex with mini HFT-like spikes (indicated by the arrow). Several small spikes at the peak of the stage-4 spike gave a characteristic appearance of a paint brush. Stage-5 epileptiform spikes had a low amplitude when compared to the stage-4 spikes but had a combination of stage-2 to-4 spikes. Scale for all: y-axis 300 µV and x-axis 300 ms.
Figure 2
Figure 2. The effects of RLD and SHD of KA on mortality rate and severity of behavioral SE.
RLD of KA ranging from 15–55 mg/kg (3–11 doses of 5 mg/kg at 30 min intervals, i.p.,) reduced mortality rate (A, B) and increased the percentage of animals that reached stage-5 seizures. The RLD method reduced inter-animal variability during different stages of SE (C, D). The lower case letters in pie charts A and B indicate mortality (a) during the SE, (b) soon after diazepam or (c) soon after KA injection (<10 min). The numbers in pie charts C and D indicate the stages of the seizures. N = 82 for RLD group; five mice died during SE after reaching stage-5 seizures, three mice did not reach stage-5 seizure, all mice except one reached stage-3 seizures; N = 24 for SHD group, five mice died during SE after reaching stage-5 seizures, eight mice did not reach stage-5, and 2 mice did not reach stage-3. p = 0.029 for mortality and p = 0.001 for SE.
Figure 3
Figure 3. SE response over time to various doses of KA given at 5/kg at 30 min intervals and to a single dose of 20 mg/kg.
A: A total of 82 mice were used for RLD of KA. About 95% of the animals reached stage-5 seizures with ≤35 mg/kg. B: Cumulative Seizure severity score for the 2 h duration of SE between the first stage-5 (RLD) seizure and diazepam administration. Irrespective of the total dose of KA, the vast majority of animals stayed at stage ≥3 seizures after the first stage-5 seizure. Each marker represents a mouse that had achieved SE at a given RLD of KA. C–D: Represent SE response to RLD of KA over time for an individual mouse (circled and indicated by C and D in Fig. 3B). There was no correlation between the total dose of KA received and seizure severity or the earliest time-point at which animals reached stage-5 seizures. E: SE response of mouse to a SHD of KA at 20 mg/kg over time. This mouse had a fewer CMS during the 2 h period of SE after the onset of the first stage-5 seizure.
Figure 4
Figure 4. Seizure severity (total amount of time spent in CMS) comparison between SHD and RLD at 20 mg/kg (total dose in RLD or a single dose in SHD group).
A–C: Suggests that the RLD method produces consistently severe seizures when compared to SHD. Each point on graph A represents an individual mouse at a specific CMS stage. B: Histogram comparing the mean ± standard error of seizure severity in SHD and RLD groups (both groups received a total of 20 mg/kg KA) based on the total amount of time spent in CMS during the 2 h SE period from the time the mice showed first CMS-3 (SHD) or CMS-5 (RLD) to the time they received diazepam C: Comparison of the amount of time spent in stage-5 alone between the two groups revealed that the RLD group had more stage-5 seizures than the SHD group (n = 19 for SHD; n = 33 for RLD; *p = 0.049, *** p<0.0001).
Figure 5
Figure 5. An example of an EEG trace (for 2 min) showing different stages of seizure episodes, induced by KA in C57BL/6J mouse, correlating with power spectrum, activity level and real-time behavioral seizures captured from video-EEG recording.
A: EEG trace in the middle shows changes in the electrical activity as the seizure severity progressed from NCS to CMS over time. A brief HFT on the EEG, which had no behavioral counterpart, preceded the CMS. Different stages of behavioral seizures are shown by photographs (C). Magnified 2 second traces (B) representing EEG signatures for each stage of behavioral seizure. The histograms at the top panel in ‘A’ represent power bands. The baseline power of all bands was less than 5 mV2 and the amplitude of the baseline was <200 µV. As the seizure progressed from NCS to CMS, the power bands, and especially gamma power, increased (shown in green). Gamma power band increased after HFT, peaked at stage-3B, and started declining in stage-4 and -5 before returning to the baseline. Activity counts (per min), shown below the EEG trace, increased from stage-3A onwards and peaked in stage-3B and -4. Activity counts reduced in stage-5 when the mice were recumbent or showed generalized rigidity but, increased when the mice displayed jumping behavior. A higher delta band was found to be the hallmark of stage-2 seizures. Reduction in the peaked delta band was characteristic when NCS progressed to CMS. HFT was characterized by a peak of alpha and sigma bands. A transient increase in theta band marked the transition from stage-3A to -3B. Gamma and beta bands peaked in stage-3B and declined slowly in stage-4 and -5 before reaching the baseline.
Figure 6
Figure 6. The RLD group had a higher spike count (per min) than the SHD group.
Spike counts were higher across all stages of seizures (A) or in the total spike count during the entire 2 h duration of SE following RLD (B). The increase in spike counts was significantly greater during stage-2 (p = 0.021) and stage-5 (p = 0.0012) seizures in the RLD group than in the SHD group (A). The mean values of spike rate shown at 5 min epochs revealed a significant increase in the RLD group than in the SHD group (two way ANOVA, p = 0.0001, n = 9 each). C: The spike amplitude during the 2 h SE was greater in stage-3B ≥ stage-2 > stage-3A ≥ stage-4 ≥ stage-5 > stage-1. There was a significant increase in spike amplitude for stage-5 seizures in the RLD group (p = 0.024, n = 9 each, unpaired t-test).
Figure 7
Figure 7. Comparison of cumulative power (mV2 in 10 s epochs) in the EEG during 2 h SE at different stages of seizures between SHD and RLD.
The baseline power of these bands during the entire 22 (data not shown). The cumulative power bands of δ, θ, α, Σ, β, and γ, frequencies increased progressively from NCS to CMS in both SHD and RLD groups. The overall power of delta, and to some extent theta except in stage-5, was higher in both SHD and RLD groups when compared to all other bands as the seizures progressed from stage-1. There were no significant changes in alpha, beta and sigma power bands at different stages of seizures, between SHD and RLD groups, although the trend was that stage-3A,-3B and stage-5 showed a marginal increase in power in the RLD group.

References

    1. Rattka M, Brandt C, Loscher W (2012) Do proconvulsants modify or halt epileptogenesis? Pentylenetetrazole is ineffective in two rat models of temporal lobe epilepsy. Eur J Neurosci 36: 2505–2520. - PubMed
    1. Schauwecker PE (2012) Strain differences in seizure-induced cell death following pilocarpine-induced status epilepticus. Neurobiol Dis 45: 297–304. - PMC - PubMed
    1. Bankstahl M, Muller CJ, Wilk E, Schughart K, Loscher W (2012) Generation and characterization of pilocarpine-sensitive C57BL/6 mice as a model of temporal lobe epilepsy. Behav Brain Res 230: 182–191. - PubMed
    1. Raol YH, Brooks-Kayal AR (2012) Experimental models of seizures and epilepsies. Prog Mol Biol Transl Sci 105: 57–82. - PubMed
    1. Loscher W (2002) Animal models of epilepsy for the development of antiepileptogenic and disease-modifying drugs. A comparison of the pharmacology of kindling and post-status epilepticus models of temporal lobe epilepsy. Epilepsy Res 50: 105–123. - PubMed

Publication types

LinkOut - more resources