Development and validation of an ex vivo electron paramagnetic resonance fingernail biodosimetric method
- PMID: 24803513
- PMCID: PMC4095917
- DOI: 10.1093/rpd/ncu129
Development and validation of an ex vivo electron paramagnetic resonance fingernail biodosimetric method
Abstract
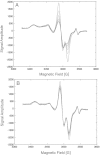
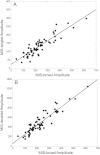
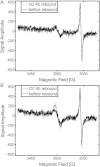
There is an imperative need to develop methods that can rapidly and accurately determine individual exposure to radiation for screening (triage) populations and guiding medical treatment in an emergency response to a large-scale radiological/nuclear event. To this end, a number of methods that rely on dose-dependent chemical and/or physical alterations in biomaterials or biological responses are in various stages of development. One such method, ex vivo electron paramagnetic resonance (EPR) nail dosimetry using human nail clippings, is a physical biodosimetry technique that takes advantage of a stable radiation-induced signal (RIS) in the keratin matrix of fingernails and toenails. This dosimetry method has the advantages of ubiquitous availability of the dosimetric material, easy and non-invasive sampling, and the potential for immediate and rapid dose assessment. The major challenge for ex vivo EPR nail dosimetry is the overlap of mechanically induced signals and the RIS. The difficulties of analysing the mixed EPR spectra of a clipped irradiated nail were addressed in the work described here. The following key factors lead to successful spectral analysis and dose assessment in ex vivo EPR nail dosimetry: (1) obtaining a thorough understanding of the chemical nature, the decay behaviour, and the microwave power dependence of the EPR signals, as well as the influence of variation in temperature, humidity, water content, and O₂ level; (2) control of the variability among individual samples to achieve consistent shape and kinetics of the EPR spectra; (3) use of correlations between the multiple spectral components; and (4) use of optimised modelling and fitting of the EPR spectra to improve the accuracy and precision of the dose estimates derived from the nail spectra. In the work described here, two large clipped nail datasets were used to test the procedures and the spectral fitting model of the results obtained with it. A 15-donor nail set with 90 nail samples from 15 donors was used to validate the sample handling and spectral analysis methods that have been developed but without the interference of a native background signal. Good consistency has been obtained between the actual RIS and the estimated RIS computed from spectral analysis. In addition to the success in RIS estimation, a linear dose response has also been achieved for all individuals in this study, where the radiation dose ranges from 0 to 6 Gy. A second 16-donor nail set with 96 nail samples was used to test the spectral fitting model where the background signal was included during the fitting of the clipped nail spectra data. Although the dose response for the estimated and actual RIS calculated in both donor nail sets was similar, there was an increased variability in the RIS values that was likely due to the variability in the background signal between donors. Although the current methods of sample handling and spectral analysis show good potential for estimating the RIS in the EPR spectra of nail clippings, there is a remaining degree of variability in the RIS estimate that needs to be addressed; this should be achieved by identifying and accounting for demographic sources of variability in the background nail signal and the composition of the nail matrix.
© The Author 2014. Published by Oxford University Press. All rights reserved. For Permissions, please email: journals.permissions@oup.com.
Figures


Similar articles
-
Dosimetry based on EPR spectral analysis of fingernail clippings.Health Phys. 2010 Feb;98(2):309-17. doi: 10.1097/HP.0b013e3181b27502. Health Phys. 2010. PMID: 20065699 Free PMC article.
-
Developments in Biodosimetry Methods for Triage With a Focus on X-band Electron Paramagnetic Resonance In Vivo Fingernail Dosimetry.Health Phys. 2018 Jul;115(1):140-150. doi: 10.1097/HP.0000000000000874. Health Phys. 2018. PMID: 29787440 Free PMC article.
-
POSSIBLE NATURE OF THE RADIATION-INDUCED SIGNAL IN NAILS: HIGH-FIELD EPR, CONFIRMING CHEMICAL SYNTHESIS, AND QUANTUM CHEMICAL CALCULATIONS.Radiat Prot Dosimetry. 2016 Dec;172(1-3):112-120. doi: 10.1093/rpd/ncw216. Epub 2016 Aug 13. Radiat Prot Dosimetry. 2016. PMID: 27522053 Free PMC article.
-
EPR dosimetry in glass: a review.Radiat Environ Biophys. 2022 May;61(2):179-203. doi: 10.1007/s00411-022-00970-w. Epub 2022 Mar 20. Radiat Environ Biophys. 2022. PMID: 35306595 Review.
-
EPR dosimetry with tooth enamel: A review.Appl Radiat Isot. 2010 Nov;68(11):2033-116. doi: 10.1016/j.apradiso.2010.05.016. Epub 2010 Jun 4. Appl Radiat Isot. 2010. PMID: 20599388 Review.
Cited by
-
Overview of the principles and practice of biodosimetry.Radiat Environ Biophys. 2014 May;53(2):221-32. doi: 10.1007/s00411-014-0522-0. Epub 2014 Feb 12. Radiat Environ Biophys. 2014. PMID: 24519326 Free PMC article. Review.
-
Calculation of dose conversion factors for doses in the fingernails to organ doses at external gamma irradiation in air.Radiat Meas. 2015 Nov 1;82:1-7. doi: 10.1016/j.radmeas.2015.07.004. Radiat Meas. 2015. PMID: 26347593 Free PMC article.
-
Evaluating the Special Needs of The Military for Radiation Biodosimetry for Tactical Warfare Against Deployed Troops: Comparing Military to Civilian Needs for Biodosimetry Methods.Health Phys. 2016 Aug;111(2):169-82. doi: 10.1097/HP.0000000000000538. Health Phys. 2016. PMID: 27356061 Free PMC article.
-
Scientific and Logistical Considerations When Screening for Radiation Risks by Using Biodosimetry Based on Biological Effects of Radiation Rather than Dose: The Need for Prior Measurements of Homogeneity and Distribution of Dose.Health Phys. 2020 Jul;119(1):72-82. doi: 10.1097/HP.0000000000001244. Health Phys. 2020. PMID: 32175928 Free PMC article. Review.
-
Emergency EPR dosimetry technique using vacuum-stored dry nails.Radiat Meas. 2016 May 1;88:41-47. doi: 10.1016/j.radmeas.2016.02.014. Epub 2016 Feb 6. Radiat Meas. 2016. PMID: 27172262 Free PMC article.
References
-
- González A. J. Lauriston S. Taylor lecture: radiation protection in the aftermath of a terrorist attack involving exposure to ionizing radiation. Health Phys. 2005;89:418–446. - PubMed
-
- Trompier F., Bassinet C., Della Monaca S., Romanyukha A., Reyes R., Clairand I. Overview of physical and biophysical techniques for accident dosimetry. Radiat. Prot. Dosim. 2011;144:571–574. - PubMed
Publication types
MeSH terms
Grants and funding
LinkOut - more resources
Full Text Sources
Other Literature Sources

