. 2014 May 7;9(5):e96566.
doi: 10.1371/journal.pone.0096566. eCollection 2014.

Evolution of mitochondria reconstructed from the energy metabolism of living bacteria

Affiliations

Evolution of mitochondria reconstructed from the energy metabolism of living bacteria

Mauro Degli Esposti et al. PLoS One. .

Abstract

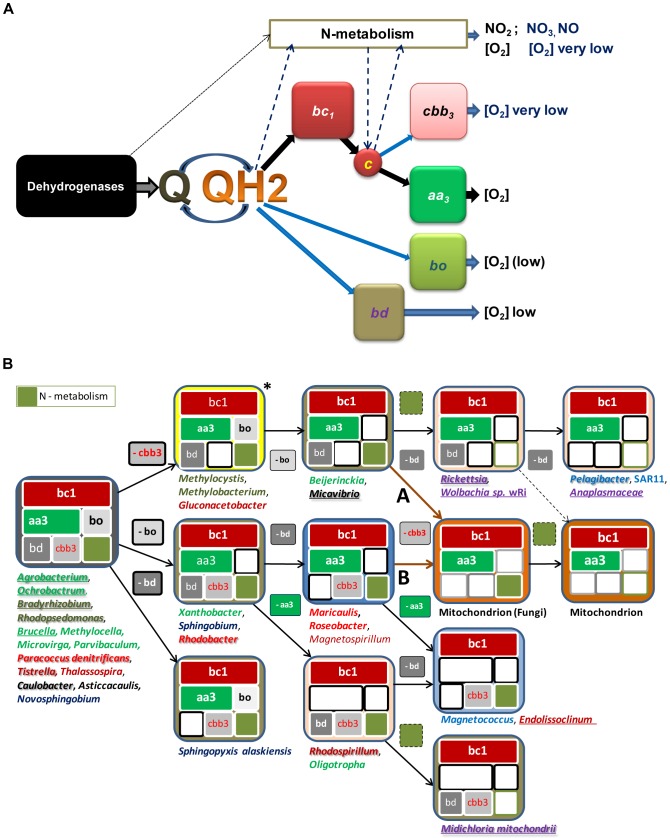
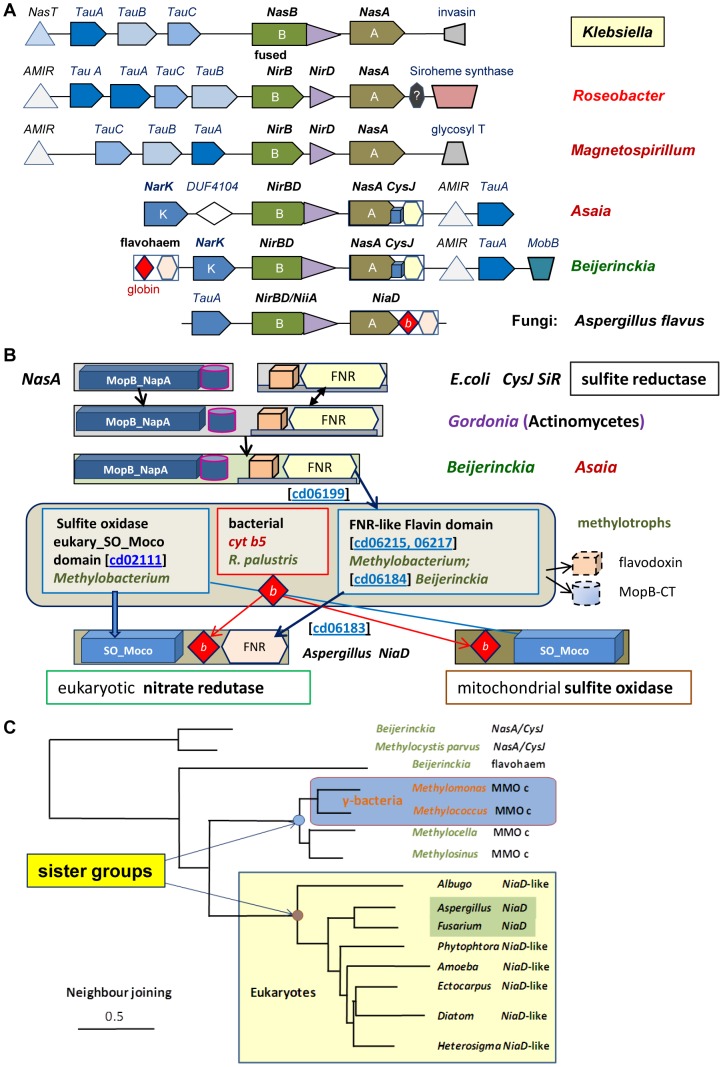
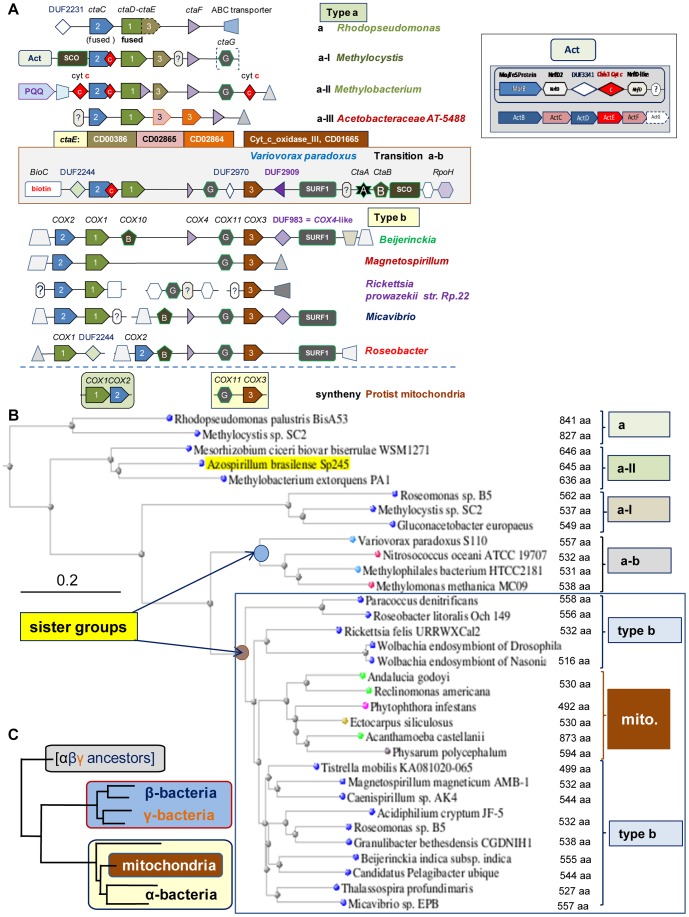
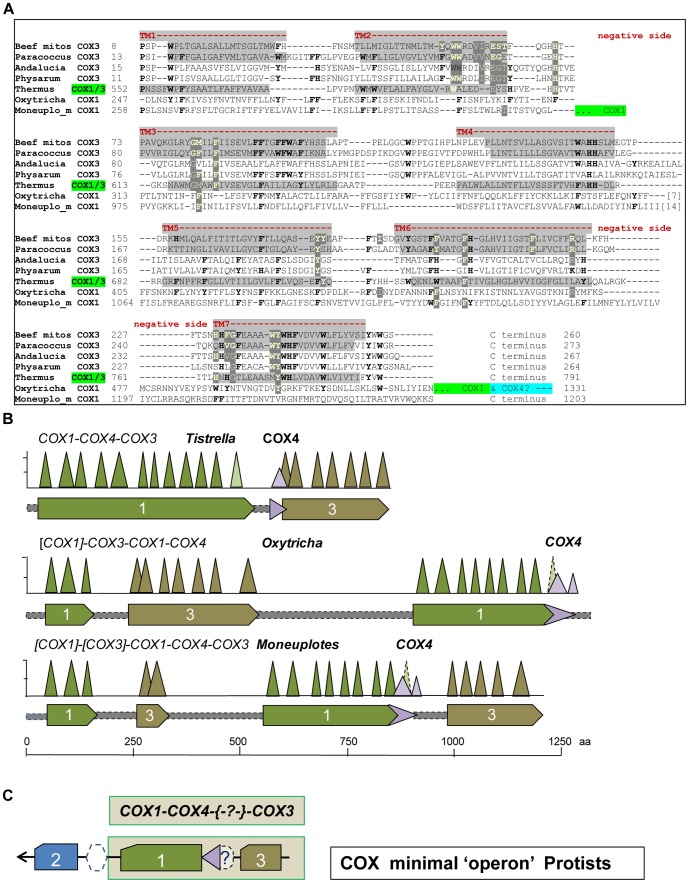
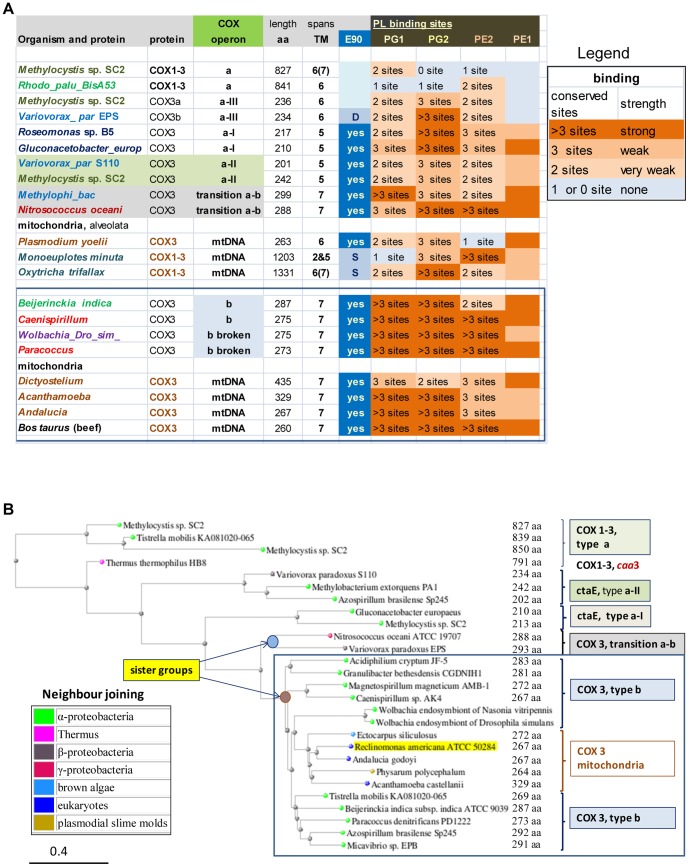
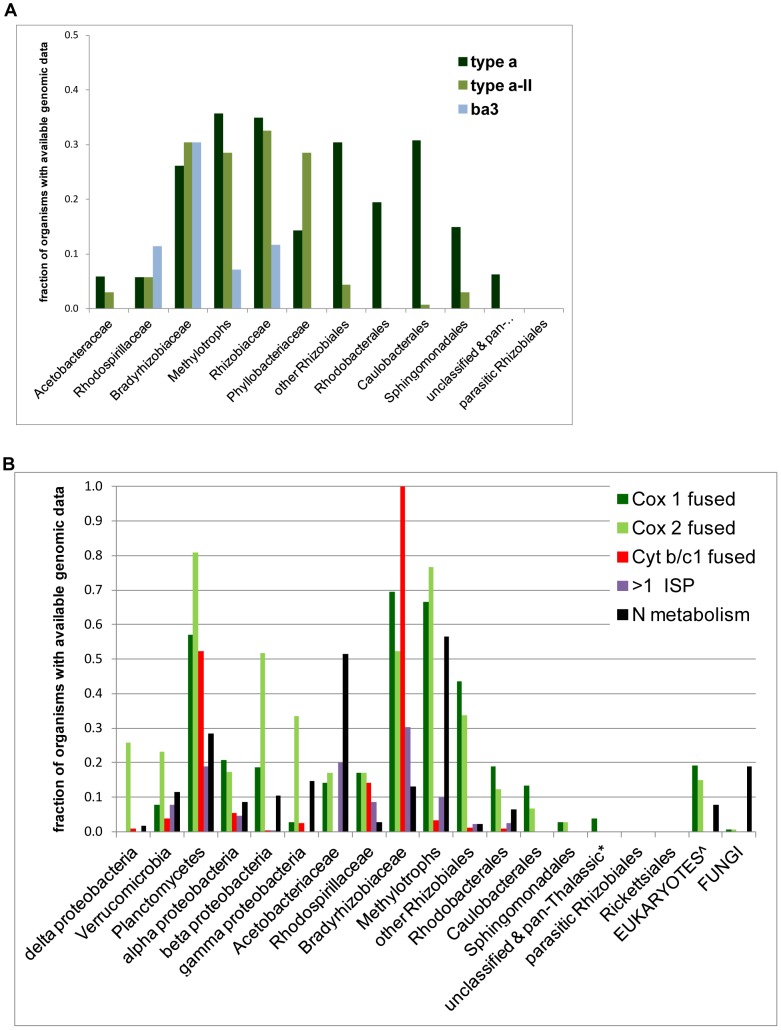
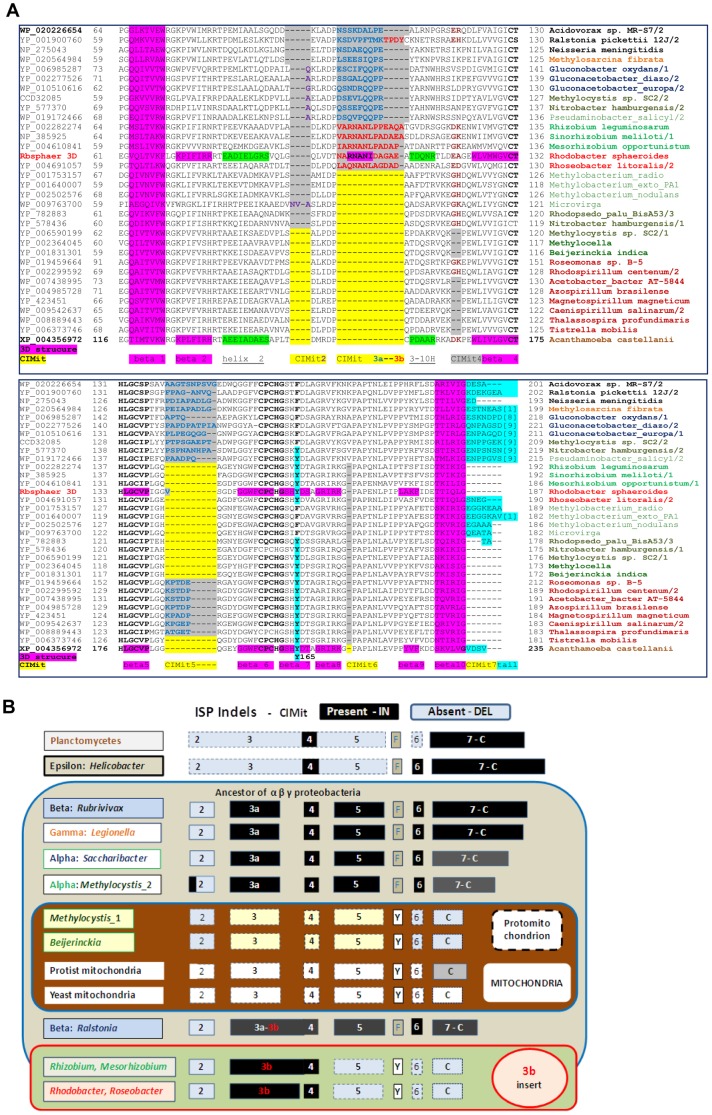
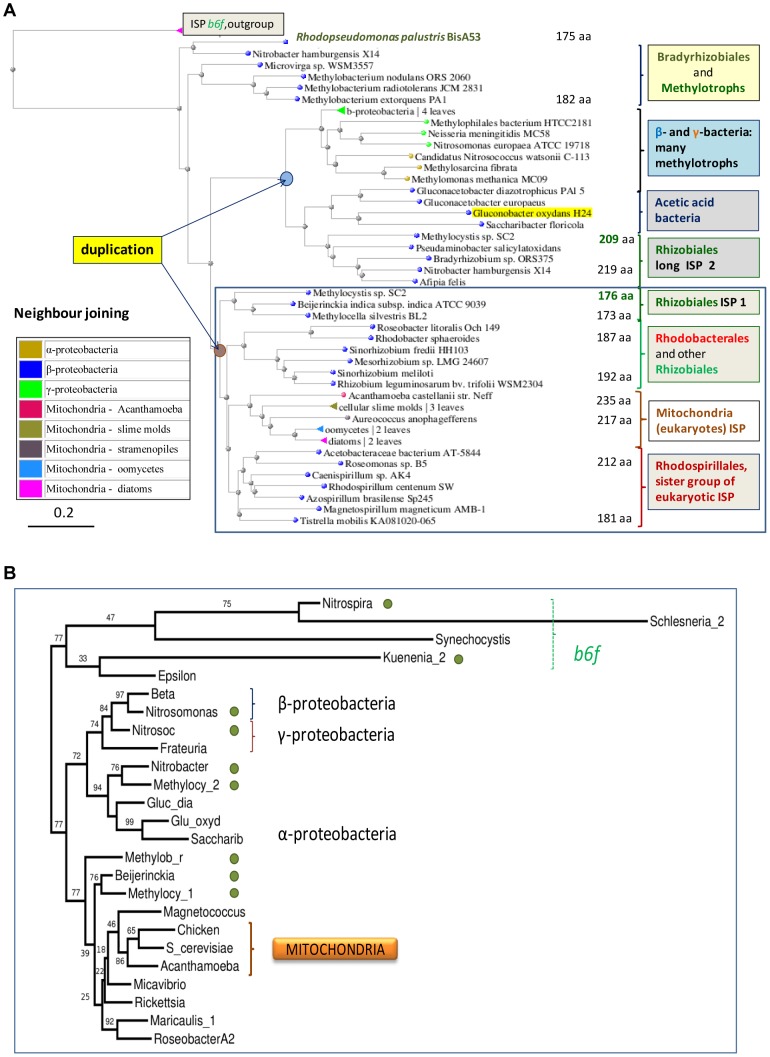
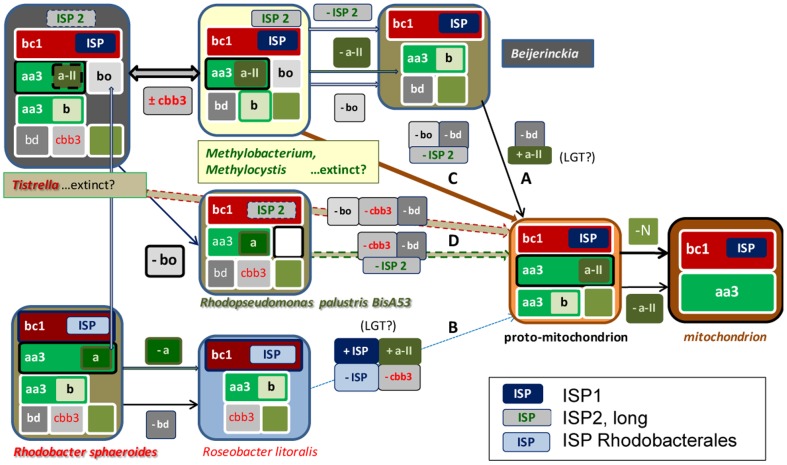
The ancestors of mitochondria, or proto-mitochondria, played a crucial role in the evolution of eukaryotic cells and derived from symbiotic α-proteobacteria which merged with other microorganisms - the basis of the widely accepted endosymbiotic theory. However, the identity and relatives of proto-mitochondria remain elusive. Here we show that methylotrophic α-proteobacteria could be the closest living models for mitochondrial ancestors. We reached this conclusion after reconstructing the possible evolutionary pathways of the bioenergy systems of proto-mitochondria with a genomic survey of extant α-proteobacteria. Results obtained with complementary molecular and genetic analyses of diverse bioenergetic proteins converge in indicating the pathway stemming from methylotrophic bacteria as the most probable route of mitochondrial evolution. Contrary to other α-proteobacteria, methylotrophs show transition forms for the bioenergetic systems analysed. Our approach of focusing on these bioenergetic systems overcomes the phylogenetic impasse that has previously complicated the search for mitochondrial ancestors. Moreover, our results provide a new perspective for experimentally re-evolving mitochondria from extant bacteria and in the future produce synthetic mitochondria.


Conflict of interest statement

Competing Interests: The authors have declared that no competing interests exist.

Figures

Figure 1
Figure 1. Bioenergetic systems of bacteria and mitochondria.
A -Terminal respiratory chain of bacteria. 11. Various bioenergetic systems - membrane redox complexes identified by their common name and different colours - carry out the oxidation of quinols (QH2) reduced by dehydrogenases. Besides oxygen (O2), nitrogen compounds can function as electron acceptors for the oxidation of dehydrogenases (dotted arrow), quinols and cytochrome c (dashed dark blue arrows), in reactions catalysed by enzyme complexes such as Nrf nitrite reductase , which are included within the N-metabolism system. Thick black arrows indicate electron transport in aerobic bacteria and mitochondria. Blue arrows indicate other electron transport pathways of facultatively anaerobic bacteria. B - Pathways of mitochondrial bioenergetic evolution. The bioenergetic systems illustrated in A are indicated by the coloured modules (with size proportional to their bioenergetic output) within the boxes representing the bioenergetic subset of each organism or organelle. Mitochondria of fungi and heterokont microorganisms differ from those of other eukaryotes for the presence of elements of N-metabolism. Representative taxa with fully sequenced genome are listed beneath each subset. The pathways of mitochondrial evolution are deduced by connecting these subsets with stepwise loss of a single bioenergetic system. Microorganisms underlined are symbionts or pathogens. Bacteria in embossed typeface have been proposed as ancestors or relatives of mitochondria (see Table S1 in File S1 for specific references). Dark brown arrows A and B indicate the pathways leading to fungal mitochondria. The pathway between the Rickettsia subset and that of mitochondria (dashed arrow) can be discounted, since the symbiotic event occurred only once , , , , . * indicates the subset from which other pathways depart (Figure S1 in File S1).
Figure 2
Figure 2. Graphical representation of assimilatory nitrate reduction in protists and α-proteobacteria.
A – The diagram shows the gene clusters of assimilatory, NAD(P)H-dependent nitrate reduction in bacteria and eukaryotes. The various elements of Nas operon of Klebsiella and the NiiA-NiaD operon in fungi are colour coded as indicated in the quandrant on the top right. B – Possible molecular evolution of fungal NiaD nitrate reductase. Each domain is identified by a specific symbol - see the text for details. C – Representative distance tree of various proteins containing the bacterial FNR-like conserved domain. The tree was obtained with Neighbour Joining (maximal distance 0.9) using the DELTABLAST program with methane monooxygenase subunit c of Methylocella silvestris (MMOc, Accession: YP_002361598) as query. This reductase subunit of methane monooxygenase contains a FNR-like domain similar to that of assimilatory nitrate reductases lying in a sister group as indicated.
Figure 3
Figure 3. α-proteobacteria have different types of COX operons and catalytic subunits of aa3 oxidase.
A – Graphical representation of aa3 oxidase gene clusters. The different COX clusters of α-proteobacteria are classified by considering gene sequence variations and the features of flanking genes (see also “Classification of bacterial COX operons” in File S1). Specific graphical symbols identify COX subunits as indicated; other types of proteins are labelled as follows: white hexagon, enzyme working with RNA or DNA; red diamond with enclosed c, cytochrome c type protein; truncated triangle pointing left, ABC transporter/permease; grey sharp triangle, transcription regulator; PQQ, PQQ-dependent dehydrogenase; white diamond, protein belonging to a DUF family , e.g. DUF983; question mark within hexagon, completely unknown protein. Note that SURF1 (Surfeit locus protein 1) and SCO (Synthesis of cytochrome c oxidase) are also involved in the biogenesis of oxidases. Distance between genes is arbitrary. COX operon type a-I is attached to a Nrf-like gene cluster, also called Alternative Complex III or Act , containing two homologues of the membrane subunit NrfD (called NrfD2 and NrfD-like here, as shown at the side of the figure). The synthenic diads of protist mitochondria are shown below the blue line. Each of the recognised subfamilies of COX3 is represented by a different colour, as indicated in the middle of the illustration. B - Representative distance tree of COX 1 proteins. The tree was obtained with Neighbour Joining (maximal distance 0.9) using the DELTABLAST program with the COX1 protein of Methylobacterium extorquens PA1 (Accession: YP_001637594) as query. The group containing bacterial and mitochondrial proteins (mito.) is enclosed in the blue square. Protein length and type of COX operon are annotated on the right of the tree. C – Simplified pattern of typical phylogenetic trees of COX 1 proteins.The tree is modelled to match distance trees of nitrate reductase (Fig. 2C) and COX1 (part B). Branch length is arbitrary.
Figure 4
Figure 4. Analysis of the molecular architecture of COX3 in bacteria and protists. A – Alignment of bacterial and mitochondrial COX3 proteins.
A set of aligned COX3 sequences from bacteria and protists was initially obtained from the DELTABLAST option of multiple alignment and subsequently implemented manually following data available from the structure of beef , , Paracoccus and Thermus aa3 oxidase. Residues that bind phospholipids with either H or π bonds are in yellow character and highlighted in dark grey, while those conserved are in bold character. Light grey areas indicate transmembrane helices (TM). B – Graphical representation of COX 1-3 fused proteins. The hydrophobic peaks in the hydropathy profile of the proteins, which was obtained using the program WHAT with a fixed scanning window of 19 residues, is represented by the sharp triangles, that are commensurated to the peak height (maximum in the hydrophobicity profile) and width of the predicted TM , which closely correspond to those observed in 3D-structures , , . C – Deduced sequence of the “minimal” COX operon of protists. The arrangement of COX genes essentially corresponds to the core sequence of a COX operons of type a (cf. Fig. 3) but in the reverse order of transcription. Dashed symbol represents a protein that may intermix with other COX subunits such as a COX4-like (Fig. S2 in File S1).
Figure 5
Figure 5. Structure-function features of COX3 gradually evolved from bacteria to mitochondria.
A – Heatmap for the strength of phospholipid binding by COX3 proteins. The table summarises the molecular features of PL-binding sites (residues) in aligned COX 3 proteins (Table S4 in File S1); it is colour mapped according to the number of conserved sites to represent the increasing PL-binding strength along bacterial and mitochondrial protein sequences, as indicated by the legend on the right of the table. PL-binding is considered weak when less than 3 sites are conserved for each PL, the nomenclature of which is taken from Ref. . PE, phosphatidyl-ethanolamine; PG, phosphatidyl-glycerol. The list includes conserved amino acids corresponding to E90 in beef COX3, which lies near bound PL modulating oxygen entry into the catalytic site of the oxidase . Abbreviations for organisms are: Rhodo_palu_BisA53, R. palustris BisA53; Variovorax_ par, Variovorax paradoxus; Methylophi_bac, Methylophilales bacterium HTCC2181; Wolbachia_Dro_sim_, Wolbachia endosymbiont of Drosophila simulans. B - Representative distance tree of COX 3 proteins. The tree was obtained as described in the legend of Fig. 3B, using as a query the C-terminal region of the COX1-3 protein from R. palustris BisA53 (Accession: YP_782773, residues 550 to 841) that aligns with bacterial and mitochondrial COX3 (Fig. 3B Fig. 4A). The group containing bacterial proteins from COX operon type b and their mitochondrial homologues is enclosed in a blue square as in Fig. 3B.
Figure 6
Figure 6. Taxonomic distribution of bioenergetic systems in bacteria.
A – Distribution of COX operon types in major families of α-proteobacteria. The frequency of each type of COX operon was normalised to the number of α-proteobacterial organisms with genomic data that are currently available (from NCBI resources http://www.ncbi.nlm.nih.gov/taxonomy/- accessed 14 March 2014) . See Table S2 in File S1 for a detailed list of the taxonomic distribution of diverse COX operon types. The definition ‘pan-Thalassic’collects together organisms of the SAR clade with Magnetococcus, Pelagibacter and Micavibrio. B. -Distribution of fused proteins and N-metabolism elements along diverse bacterial lineages. Fused proteins were identified with the combined resourses of NCBI and the Protein Family website (PFAM 27.0 - http://pfam.sanger.ac.uk/ [52]). Multiple forms of ISP were counted as >1 ISP. Taxa are arranged according to their approximate phylogenetic position considering also metabolic features (cf. Refs [5], [31]). For each group, the frequency is normalized as in A. Eukaryotes (∧) include amoebozoa, ciliates and heterokonts. N-metabolism encompasses: methane monooxygenase, ammonia monooxygenase, nitrite oxidoreductase, Nirf nitrite reductase and its homologues in COX operon type a-I (Fig. 3A), ammonia oxidation and anaerobic ammonia fermentation , .
Figure 7
Figure 7. Molecular evolution of the Rieske subunit (ISP) of the cytochrome bc1 complex.
A – Alignment of the ISP proteins from bacteria having various COX operons. ISP sequences were selected from the organisms displaying multiple COX operons and also ISP forms (Table S2 in File S1 and Fig. 6). The alignment was manually refined using structural information, as detailed in Fig. S4 in File S1. This alignment shows only the catalytic core of the ISP from α-, β- and γ-proteobacteria, plus Acanthamoeba as the sole mitochondrial representative. See Fig. S4 in File S1 for a complementary alignment including the N-terminal transmembrane region and further information, including secondary structure elements (beta sheet in purple and alpha helix in green) and Conserved Indels vs. Mitochondria (CIMit). The accession codes of the proteins are shown on the left of each sequence block, while the organisms are listed on the right abbreviated as follows: Gluconacetobacter_diazo & _europa, Gluconacetobacter diazotrophicus PA1 5 & europaeus, respectively; Pseudaminobacter_salicyl, Pseudaminobacter salicylatoxidans; Methylobacterium_radio & _exto_PA1, Methylobacterium radiotolerans JCM 283 & extorquens PA1, respectively; Rhodopsedo_palu_BisA53, R. palustris BisA53; and Acetobacter_bacter AT-5844, Acetobacteraceae bacterium AT-5844. ISP1 indicates the ISP form that is present in the petABC operon. B - Evolutionary pattern of the conserved indels in bacterial and mitochondrial ISP. The molecular features deduced by the structure-based alignment of ISP proteins are rendered graphically following the numerical order of conserved indels presented in A and Fig. S4 in File S1. DELetions conserved in bacterial vs. mitochondrial ISP sequences are represented in pale blue boxes with black labels, whereas INserts with respect to mitochondrial sequences are represented in black boxes with white labels.
Figure 8
Figure 8. Phylogenetic relationships between diverse forms of ISP.
A – Distance tree encompassing proteobacteria and mitochondria. The tree was obtained as described in the legend of Fig. 3B using the alignment of Fig. 7A and two ISP proteins from the b6f complex as outgroup (top). The group containing bacterial ISP1 proteins together with their mitochondrial homologes is enclosed in the blue square to highlight a likely ancestral duplication separating it from the group with ISP2. B – Long distance phylogenetic relationships of bacterial ISP. The phylogenetic tree (maximal likelyhood method) of ISP proteins was computed from the structure-based alignments in Fig. S4 in File S1. Th small green circle indicates ancient nitrogen or methylotrophic metabolism – (Fig. 6B). The dashed green bracket indicates the paralogue proteins belonging to the b6f complex. Other brackets indicate proteobacterial subdivisions and mitochondria as in A. Note how the bootstrap values are much lower within the bottom branch containing mitochondrial ISP than in the upper branch containing ISP2.
Figure 9
Figure 9. Possible progenitors for the bioenergetic evolution of mitochondria.
This diagram is modified from that in Fig. 1B to take into account the deduction that proto-mitochondria probably had two different types of COX operons (type a is labelled in dark olive background) and the evidence for multiple ISP forms. ISP2 is represented in a grey box while ISP1 in dark blue. Various steps of differential loss or acquisition via LGT are indicated for the possible pathways of evolution from extant or extinct α-proteobacteria into proto-mitochondria. By considering the complexities arisen from our data, pathway A in Fig. 1B stemming from Beijerinckia would require one loss and one acquisition, while pathway B would theoretically imply two losses and two acquisitions. However, we now exclude that this pathway may have contributed to the evolution of mitochondria (see text). Pathway C, sustained by most results presented here, bypasses the Beijerinckia subset with the combined loss of two bioenergetic systems and ISP2. Finally, pathway D would require the combined loss of three bioenergetic systems from organisms such as Tistrella, but of two systems plus ISP2 for R. palustris BisA53, which has already lost bo-type oxidase (Table S1 in File S1). The obvious possibility that yet undiscovered, or extinct bacteria may be among the originators of the proto-mitochondrion is considered, as indicated. Eventual loss of photosynthesis is not shown, but it would apply only to Methylobacterium, R. palustris and Roseobacter among the organisms shown. The grey vertical arrow on the left indicates the possible equivalence of COX operon type a with dual function (cytochrome c and ubiquinol) oxidases in some Rhodobacterales.

Similar articles

Cited by

References

    1. Gray MW (2012) Mitochondrial evolution. Cold Spring Harb Perspect Biol 4: a011403. - PMC - PubMed
    1. Lane N, Martin W (2010) The energetics of genome complexity. Nature 467: 929–934. - PubMed
    1. Margulis L (1996) Archaeal-eubacterial mergers in the origin of Eukarya: phylogenetic classification of life. Proc Natl Acad Sci U S A 93: 1071–1076. - PMC - PubMed
    1. Andersson SG, Karlberg O, Canbäck B, Kurland CG (2003) On the origin of mitochondria: a genomics perspective. Philos Trans R Soc Lond B Biol Sci 358: 165–177. - PMC - PubMed
    1. Williams KP, Sobral BW, Dickerman AW (2007) A robust species tree for the alphaproteobacteria. J Bacteriol 189: 4578–4586. - PMC - PubMed

Publication types