. 2014 May 7;9(5):e96575.
doi: 10.1371/journal.pone.0096575. eCollection 2014.

Striatal neurodevelopment is dysregulated in purine metabolism deficiency and impacts DARPP-32, BDNF/TrkB expression and signaling: new insights on the molecular and cellular basis of Lesch-Nyhan Syndrome

Affiliations

Striatal neurodevelopment is dysregulated in purine metabolism deficiency and impacts DARPP-32, BDNF/TrkB expression and signaling: new insights on the molecular and cellular basis of Lesch-Nyhan Syndrome

Ghiabe-Henri Guibinga et al. PLoS One. .

Abstract

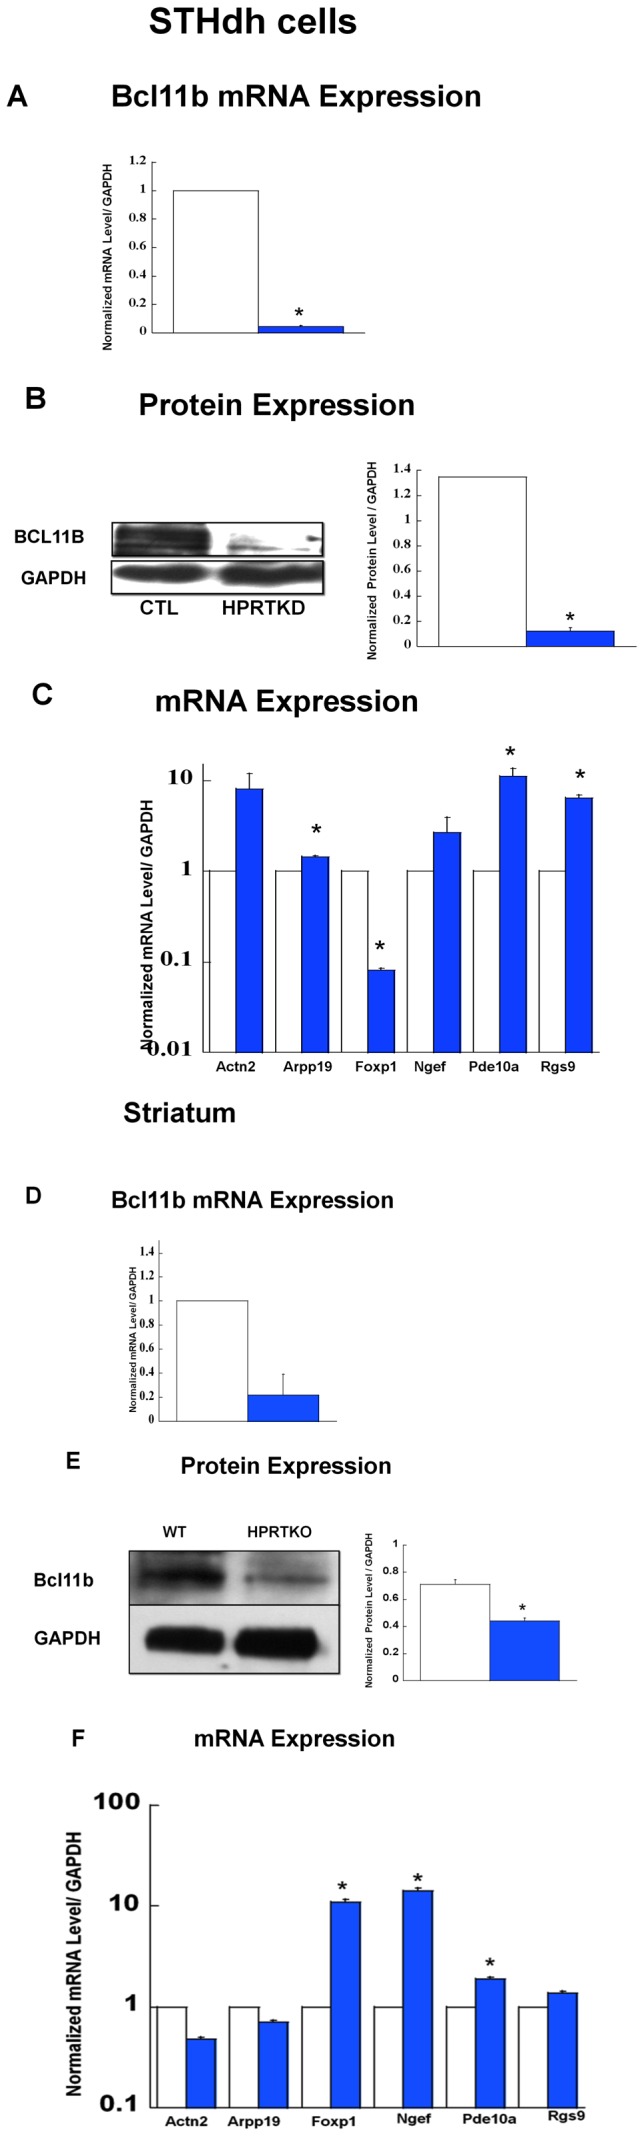
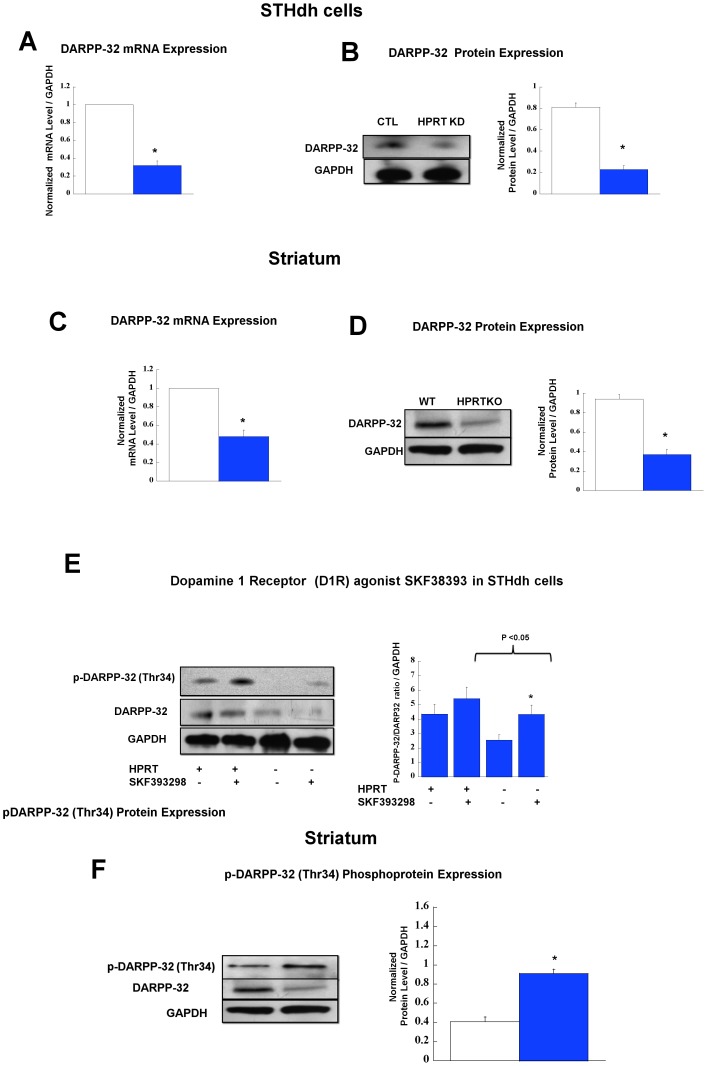
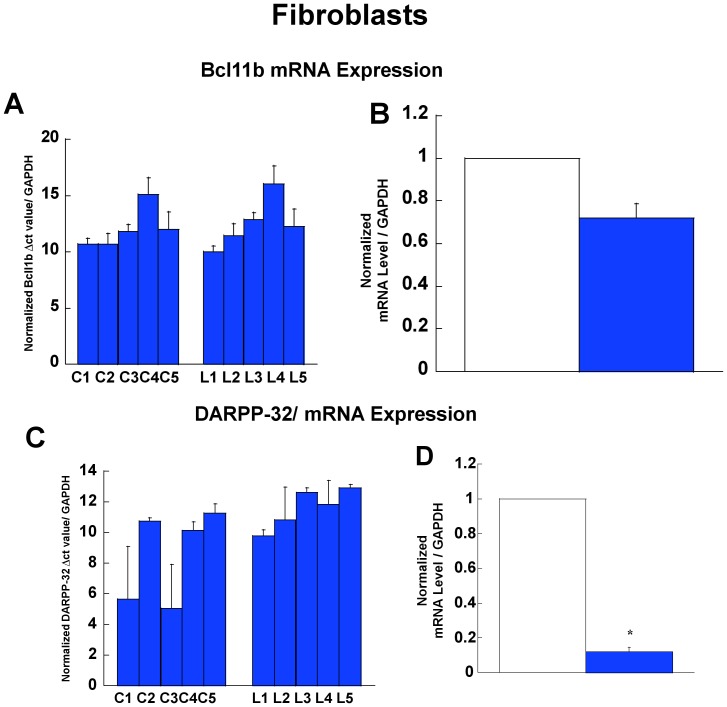
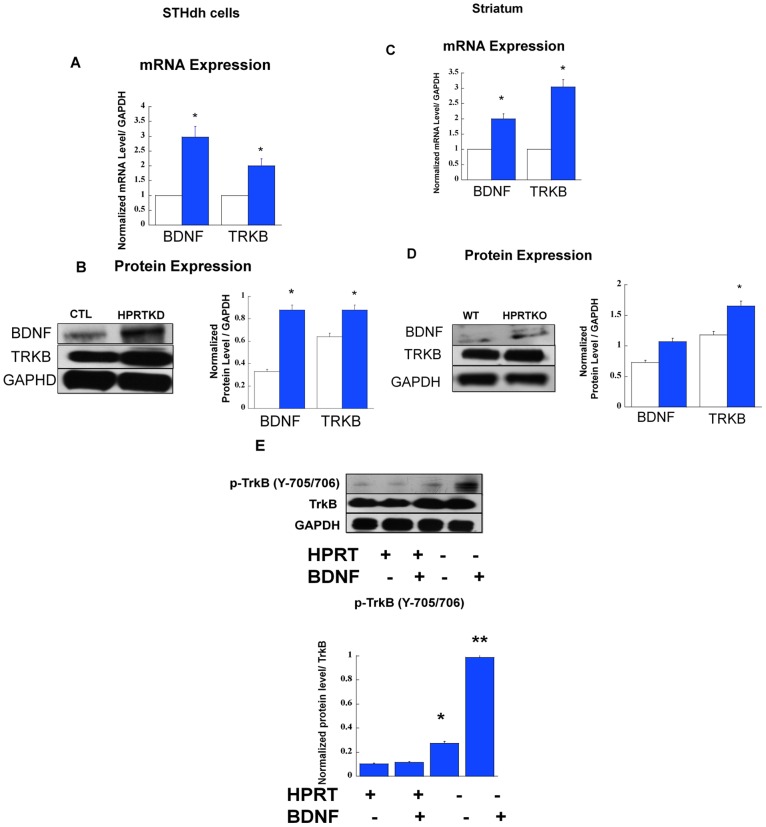
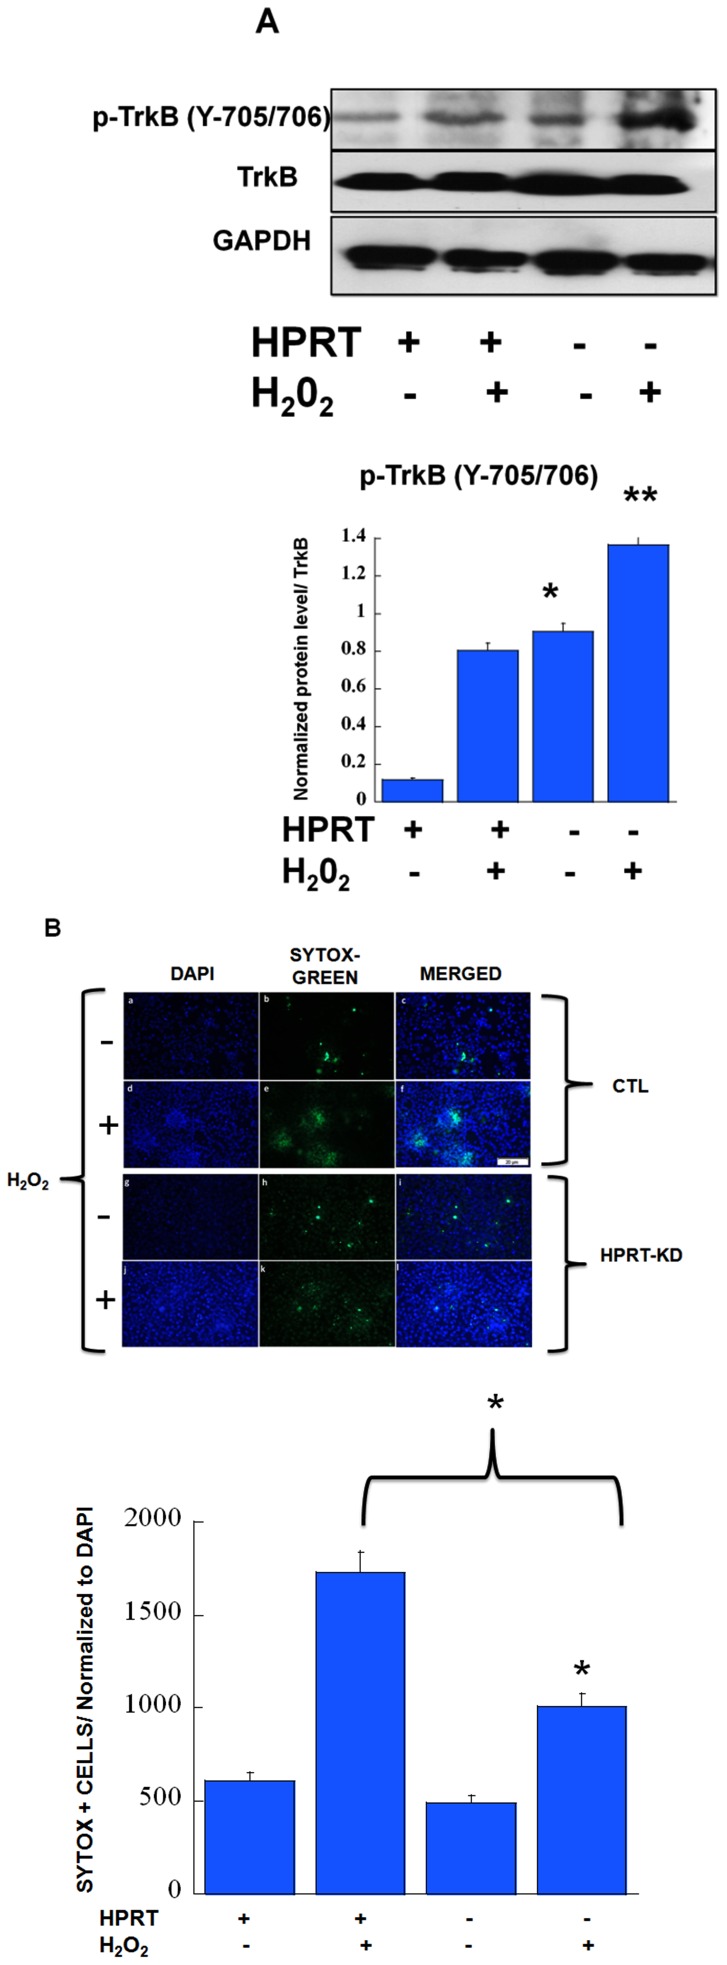
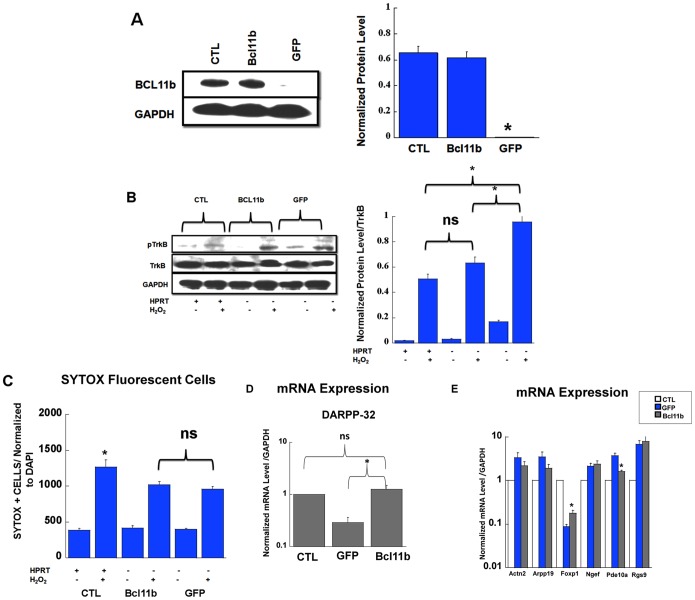
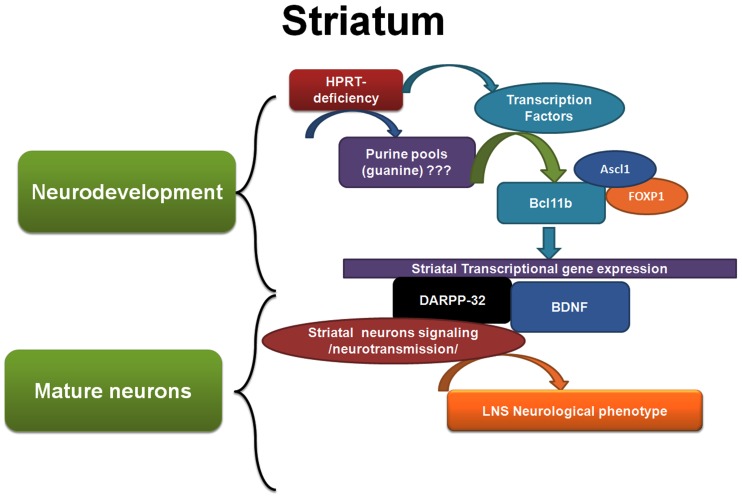
Lesch-Nyhan Syndrome (LNS) is a neurodevelopmental disorder caused by mutations in the gene encoding the purine metabolic enzyme hypoxanthine-guanine phosphoribosyltransferase (HPRT). This syndrome is characterized by an array of severe neurological impairments that in part originate from striatal dysfunctions. However, the molecular and cellular mechanisms underlying these dysfunctions remain largely unidentified. In this report, we demonstrate that HPRT-deficiency causes dysregulated expression of key genes essential for striatal patterning, most notably the striatally-enriched transcription factor B-cell leukemia 11b (Bcl11b). The data also reveal that the down-regulated expression of Bcl11b in HPRT-deficient immortalized mouse striatal (STHdh) neural stem cells is accompanied by aberrant expression of some of its transcriptional partners and other striatally-enriched genes, including the gene encoding dopamine- and cAMP-regulated phosphoprotein 32, (DARPP-32). Furthermore, we demonstrate that components of the BDNF/TrkB signaling, a known activator of DARPP-32 striatal expression and effector of Bcl11b transcriptional activation are markedly increased in HPRT-deficient cells and in the striatum of HPRT knockout mouse. Consequently, the HPRT-deficient cells display superior protection against reactive oxygen species (ROS)-mediated cell death upon exposure to hydrogen peroxide. These findings suggest that the purine metabolic defect caused by HPRT-deficiency, while it may provide neuroprotection to striatal neurons, affects key genes and signaling pathways that may underlie the neuropathogenesis of LNS.


Conflict of interest statement

Competing Interests: The authors have declared that no competing interests exist.

Figures

Figure 1
Figure 1. Gene & Protein expression for HPRT and ASCL1.
(A) Gene expression for HPRT and ASCL1 in control (CTL, open bars) and HPRT knockdown (HPRTKD, closed bars) striatal STHdh cells. Bars represent mean ±SEM of duplicate PCR measurements carried out independently twice (n = 4). mRNA expression is normalized to GAPDH level (*P<0.05, t-test). (B) Immuno-blot and quantification of HPRT and ASCL1 protein expression in striatal STHdh cells. The quantification bar graphs are shown as means ± SEM (n = 3, *P<0.05, t-test). (C) Gene expression for DLX2, FOXG1 and GSX1 in control (CTL, open bars) and HPRT knockdown (HPRTKD, closed bars) Striatal cells. Bars represent mean ±SEM (n = 4) *P<0.05, t-test.
Figure 2
Figure 2. Gene and Protein Expression for Bcll11b.
(A) Gene expression for Bcl11b in control striatal STHdh cells (CTL, open bars) and HPRT-knockdown (HPRTKD, closed bars). Bars represent mean ±SEM (n = 4). mRNA expression is normalized to GAPDH RNA level (*P<0.05, t-test). (B) Immuno-blot and quantification of Bcl11b protein expression in striatal cells. The quantification bar graphs are shown as means ± SEM (n = 3, *P<0.05, t-test). (C) Gene expression of Actn2, Arpp19, Foxp1, Ngef, Pde10a, and Rgs9 in control (CTL, open bars) and HPRT knockdown (HPRTKD, closed bars) striatal STHdh cells. Bars represent mean ±SEM (n = 4). *P<0.05, t-test. (D) Gene expression for Bcl11b in the striatum of wild-type (WT, open bars) and HPRT knockout (HPRTKO, closed bars) mice. Bars represent mean ±SEM (n = 4). mRNA expression is normalized to GAPDH RNA level (*P<0.05, t-test). (E) Immuno-blot and quantification of Bcl11b protein expression in the striatum of WT and HPRTKO mice. The quantification bar graphs are shown as means ± SEM (n = 3, *P<0.05, t-test). (F) Gene expression for Actn2, Arpp19, Foxp1, Ngef, Pde10a, and Rgs9 in control (Wild-type, open bars) and HPRT knockout mice (HPRTKO, closed bars) striatum. Bars represent mean ±SEM (n = 4). *P<0.05, t-test.
Figure 3
Figure 3. Gene and Protein Expression for Ppp1r1b/DARPP-32.
(A) Gene expression for Ppp1r1b/DARPP-32 in control striatal STHdh cells (CTL, open bars) and HPRT-knockdown (HPRTKD, closed bars). Bars represent mean ±SEM (n = 4). mRNA expression is normalized to GAPDH mRNA level (*P<0.05, t-test). (B) Immuno-blot and quantification of DARPP-32 protein expression in striatal cells. The quantification bar graphs are shown as means ± SEM (n = 3, *P<0.05, t-test). (C) Gene expression for Ppp1r1b/DARPP-32 in the striatum of wild-type (WT, open bars) and HPRT knockout (HPRTKO, closed bars) mice. Bars represent mean ±SEM (n = 4). mRNA expression is normalized to GAPDH RNA level (*P<0.05, t-test). (D) Immuno-blot and quantification of DARPP-32 protein expression in the striatum of WT and HPRTKO mice. The quantification bar graphs are shown as means ± SEM (n = 3, *P<0.05, t-test). (E) DARPP-32 phosphoprotein (Thr34) expression in response to D1R (SKF393298) agonist treatment (50 µM). Immuno-blot and quantification of Thr34-DARPP-32 in control and HPRT-deficient striatal cells, the quantification bar graphs are shown as means ± SEM (n = 6, *P<0.05). (F) Thr34-DARPP-32 phosphoprotein expression in striatal tissue of WT (open bar) and HPRTKO (closed bar) mice (n = 3, *P<0.05).
Figure 4
Figure 4. Bcl11b and Ppp1r1b/DARPP-32 in human fibroblasts.
(A) Bcl11b expression in individual fibroblast samples from five control (normal) subjects (C1–C5) and from five patients with LNS (L1–L5). Δct values are normalized to control mRNA (GAPDH). (B) Normalized Bcl11b expression in controls (CTL) and LNS patients. (C) Ppp1r1b/DARPP-32 expression in individual fibroblast samples from five control (normal) subjects (C1–C5) and from five patients with LNS (L1–L5). Δct values are normalized to control mRNA (GAPDH). (D) Normalized Ppp1r1b/DARPP-32 expression in controls (CTL) and LNS patients (*P<0.05, t-test).
Figure 5
Figure 5. Gene and Protein Expression for BDNF and TRKB.
(A) Gene expression for Bdnf and Trkb in control (CTL, open bars) and HPRT knockdown (HPRTKD, closed bars) striatal STHdh cells. Bars represent mean ±SEM (n = 4). mRNA expression is normalized to GAPDH RNA level (*P<0.05, t-test). (B) Immuno-blot and quantification of BDNF and TRKB protein expression in striatal cells. The quantification bar graphs are shown as means ± SEM (n = 3, *P<0.05, t-test). (C) Gene expression for Bdnf and Trkb in the striatum of wild-type (WT, open bars) and HPRT knockout (HPRTKO, closed bars) mice. Bars represent mean ±SEM of duplicate PCR measurements (n = 4). mRNA expression is normalized to GAPDH mRNA level (*P<0.05, t-test). (D) Immuno-blot and quantification of BDNF and TrkB protein expression in the striatum of WT and HPRTKO mice. The quantification bar graphs are shown as means ± SEM (n = 3, *P<0.05, t-test). (E) (Y705/706) TrkB phosphoprotein expression in response to BDNF treatment (10 ng/ml). Immuno-blot and quantification of Y705/706) TrkB phosphoprotein in control and HPRT-deficient striatal cells, the quantification bar graphs are shown as means ± SEM (n = 6, *P<0.05).
Figure 6
Figure 6. Effects of hydrogen peroxide-mediated cellular toxicity in HPRT-deficient striatal cells:
(A) (Y705/706) TrkB phosphoprotein expression in response to hydrogen peroxide H2O2 treatment (100 µM). Immuno-blot and quantification of Y705/706 TrkB phosphoprotein in control and HPRT-deficient striatal STHdh cells. The quantification bar graphs are shown as means ± SEM (n = 6, *P<0.05). (B) Enhanced neuroprotective effects against reactive oxygen species (ROS)-mediated cell death in HPRT-deficient striatal cells. Control (CTL) and HPRT-knock-down cells (HPRTKD) were treated with hydrogen peroxide H2O2 for 4 hours and then exposed to Sytox green for 10 min. Figure shows microscopy images of DAPI staining and green fluorescence which is a measure of the overall cell death level. There is reduced green fluorescence in HPRT-deficient cells relative to control after stimulation with H2O2. (Bar scale, 100 µm). This is confirmed by the quantification of the number of Sytox green fluorescent cells as illustrated in the appended graph. Error bars represent mean ± SEM of duplicate measurements of two independent experiments (n = 4). The asterisks (*) represent statistical significance between H2O2 treated cells (p<0.05, t-test).
Figure 7
Figure 7. Restoration of Bcl11b expression in HPRT-deficient striatal cells:
(A) Immuno-blot and quantification of Bcl11b expression in control (CTL) and HPRT-deficient striatal cells transfected with plasmid encoding Bcl11b (Bcl11b) and GFP (GFP). The quantification bar graphs are shown means± SEM (n = 3, *P<0.05, ANOVA, Tukey post-hoc test). (B) Immuno-blot and quantification of Y705/706 TrkB after H2O2 exposure for control (CTL), HPRT-deficient cells transfected with Bcl11b (Bcl11b) and GFP (GFP). The quantification bar graphs are shown as means ± SEM (n = 4, *P<0.05, ANOVA, Tukey post-hoc test). (C) quantification of the number of Sytox green fluorescent cells upon treatment of control (CTL) and HPRT-deficient cells transfected with Bcl11b (BCL11b) and GFP (GFP) plasmid. Data show that the rescue of Bcl11b expression in HPRT-deficient cells does not lead to added protection from cell death triggered by H2O2 (ns =  non significant, *p<0.05, ANOVA). (D) Gene expression of DARPP-32 in control (CTL), GFP and Bcl11b (rescued) transfected cells. Data show that the rescued expression of Bcl11b in HPRT-deficient cells leads to restoration of DARPP-32 expression in level similar to control, the data are shown as means ± SEM ((ns =  non significant, n = 4, *P<0.05, ANOVA, Tukey post-hoc test). (E) Gene expression for Actn2, Arpp19, Foxp1, Ngef, Pde10a, and Rgs9 in control (CTL, open bars), GFP (GFP, closed bars) and Bcl11b (Bcl11b, grey bars) transfected striatal cells. Bars represent mean ±SEM (n = 4). *P<0.05, ANOVA.
Figure 8
Figure 8. Schematic and summary model of HPRT-deficiency role in dysregulating striatal gene expression and signaling.
HPRT-deficiency alters the purine pool; and via mechanisms that are still ill-defined, these alterations affect the gene expression of keys striatal-enriched transcription factors such as Ascl1, Bcl11b and Foxp1, notably during neurodevelopment. Later in mature neurons, these transcription factors control (directly or indirectly) the expression of several genes among them, Darpp-32 and Bdnf, whose the dysregulation affects striatal neurons signaling and neurotransmission, thus contributing to LNS neurological phenotype.

Similar articles

Cited by

References

    1. Jinnah HA, Friedmann T (2000) Lesch-Nyhan Disease and its variants. In: Scriver C, Beaudet, AL, Sly WS, Valle, D., editor. The Metabolic and Molecular bases of inherited disease. 8 ed ed: McGraw-Hill. 2537–2570.
    1. Lesch M, Nyhan WL (1964) A Familial Disorder of Uric Acid Metabolism and Central Nervous System Function. Am J Med 36: 561–570. - PubMed
    1. Lloyd KG, Hornykiewicz O, Davidson L, Shannak K, Farley I, et al. (1981) Biochemical evidence of dysfunction of brain neurotransmitters in the Lesch-Nyhan syndrome. N Engl J Med 305: 1106–1111. - PubMed
    1. Ernst M, Zametkin AJ, Matochik JA, Pascualvaca D, Jons PH, et al. (1996) Presynaptic dopaminergic deficits in Lesch-Nyhan disease. N Engl J Med 334: 1568–1572. - PubMed
    1. Jinnah HA, Langlais PJ, Friedmann T (1992) Functional analysis of brain dopamine systems in a genetic mouse model of Lesch-Nyhan syndrome. JPharmacolExpTher 263: 596–607. - PubMed

Publication types

MeSH terms

Substances

LinkOut - more resources