. 2014 Sep 15;23(18):2237-49.
doi: 10.1089/scd.2013.0577. Epub 2014 Jun 26.

The CD133+CD44+ precancerous subpopulation of oval cells is a therapeutic target for hepatocellular carcinoma

Affiliations

The CD133+CD44+ precancerous subpopulation of oval cells is a therapeutic target for hepatocellular carcinoma

Yun-Wen Zheng et al. Stem Cells Dev. .

Abstract

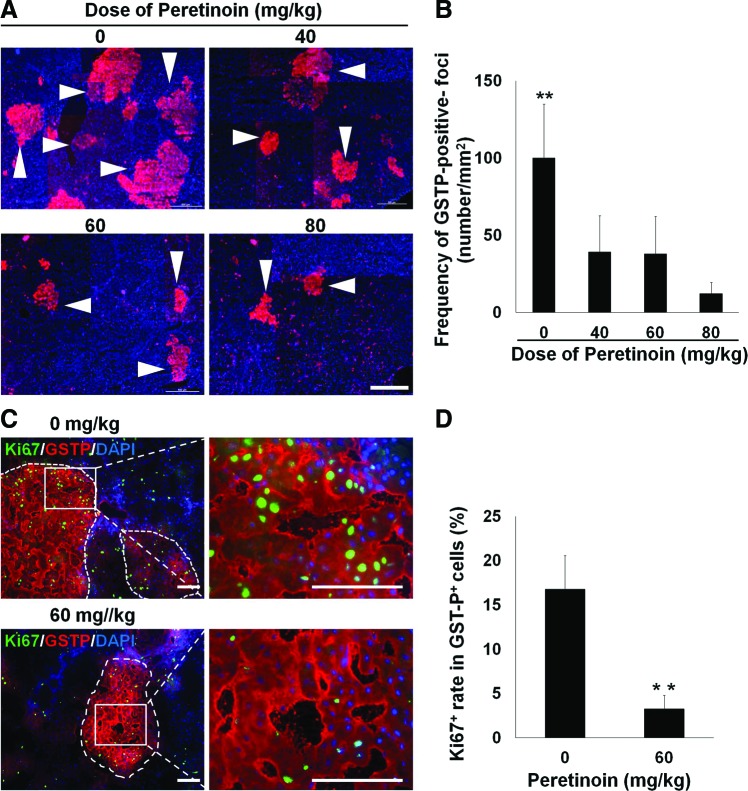
Hepatocellular carcinoma (HCC) is a malignant tumor associated with a generally poor prognosis and a high rate of recurrence. HCC usually develops in the context of chronic liver diseases, and long-lasting premalignant conditions precede cancer development. A promising therapeutic approach is to eliminate precancerous cells, which are considered as the precursors of cancer stem cells, to prevent further malignant transformation. In this study, we identified a subpopulation of precancerous cells in a rat liver carcinogenesis model, which were enriched in CD133(+)CD44(+)CD45(-)HIS49(-) cells that formed part of the hepatic oval cells fraction. Prospective isolation of the precancerous cells using flow cytometry identified stem cell properties such as the ability to expand clonally and differentiate into bi-lineage cell types. Furthermore, an acyclic retinoid, which was recently shown to improve overall survival after HCC resection, directly inhibited the extensive expansion of the isolated precancerous cells in vitro and decreased the emergence of the precancerous cells and their progeny in vivo. Long-term follow-up after the acyclic retinoid treatment confirmed reduction in precancerous changes, ultimately resulting in suppression of HCC development. These findings, together with data from recent clinical trials showing marked reduction in intrahepatic recurrence, suggest that acyclic retinoid directly prevents de novo HCC by inhibiting the development of precancerous cells. Given recent advances in diagnostic techniques and the establishment of surveillance programs, the targeting of precancerous cells may have a huge impact on preventative cancer therapies.


Figures

<b>FIG. 1.</b>
FIG. 1.
Development of HCC in a rat model. Development of hepatic oval cells, GSTP-positive cells, and foci, and HCC in rats treated with 2-AAF and subjected to PH. (A) Immunohistochemical lineage tracing during development of hepatic oval cells and formation of GSTP-positive foci in the livers of normal model rats. (B) Localizations of hepatic oval cells and GSTP-positive cells. (C) Localizations of hepatic oval cells and GSTP-positive foci. (D) Histopathology detected HCC phenotype on day 300. CV, central vein; GSTP, glutathione S-transferase placental; HCC, hepatocellular carcinoma; PV, portal vein. Scale bars, 200 μm (A) and 100 μm (B–D). Color images available online at www.liebertpub.com/scd
<b>FIG. 2.</b>
FIG. 2.
Isolation of hepatic precancerous cells among oval cells. (A) Flow cytometric analysis and sorting. Note the enhanced CD133+CD44+CD45HIS49 subpopulation in liver samples from the 2-AAF/PH group. (B) The expression levels of oval cell marker genes were higher in the CD133+CD44+CD45HIS49 cells than in the nonparenchymal cells. (C–F) Cytospin analysis showed that cells coexpressing EpCam (C) or GSTP (E) and OV-6 (C, E) were predominant among the CD133+CD44+CD45HIS49 cells. Cells positive for EpCam and OV-6 comprised 92.3% of the samples (D), while those positive for GSTP and OV-6 comprised 77.2% of the samples (F). **P<0.01, *P<0.05; n=5–16 (A), n=3 (B, D), and n=6–7 (F). Scale bars, 50 μm. HIS49, erythroid cells; PC, hepatic parenchymal cells; NPC, hepatic nonparenchymal cells. Color images available online at www.liebertpub.com/scd
<b>FIG. 3.</b>
FIG. 3.
Stem cell characteristics and in vitro proliferative inhibition of precancerous cells. Freshly isolated CD133+CD44+CD45HIS49 oval cells after 6 days (or 7 days) in culture. (A) Single cells were traced and viewed during clonal colony expansion. (B–D) CD133+CD44+CD45HIS49 cells were significantly more likely to form colonies than CD45HIS49 nonparenchymal cells (B). On day 7, the single cell-derived colonies exhibited a bipotential differential capability, expressing CK7 or CK19 and albumin single- and dual-positive (C), while they were also GSTP- and OV-6-positive (D). (E) Inhibited colony formation and cell expansion compared with results observed in the DMSO-treated control group. (F) Colony size and frequency of colony formation are decreased under the acyclic retinoid peretinoin treatment. Data are presented as mean±SD in B (n=3) and SE in F (n=6–13). *P<0.05, **P<0.01. Scale bars, 100 μm. Color images available online at www.liebertpub.com/scd
<b>FIG. 4.</b>
FIG. 4.
Inhibition of the development of GSTP-positive precancerous oval cells in vivo. Rats were examined on day 7. (A) Histological and immunocytochemical analyses of hepatic oval cells. Oval cell in the periportal region is around with dot lines Individual expression of CK19 (red) declined as the dose increased. The cell counts are shown in (B). (C) GSTP (red)-positive precancerous cells in CK19 (green)-expressing oval cells with peretinoin (80 mg/kg, right) and vehicle treatment (0 mg/kg, left). The cell counts are shown in (D). (E) Gene expression levels in liver tissue analyzed using real-time PCR. (F) The cell counts for Ki67-positive cells in CK19-hepatic oval cells in Supplementary Fig. S6. PV, portal vein. *P<0.05; **P<0.01. Data are presented as mean±SD. n=3–6 (D), n=3 (E, F), and n=5–6 (Gstp1). Scale bar, 100 μm. Color images available online at www.liebertpub.com/scd
<b>FIG. 5.</b>
FIG. 5.
Therapeutic blocking precancerous oval cell also inhibits the development of GSTP-positive foci and HCC. Rats were examined on day 42 (A–D) or day 240 (E–H). (A) Immunohistochemical detection of GSTP-positive foci (arrowheads) in samples treated with different peretinoin doses. (B) Reduced GSTP-positive foci development in response to the acyclic retinoid peretinoin. (C) Reduced Ki67-expressing cells in GSTP-positive foci in response to the acyclic retinoid. The cell counts are shown in (D). (E) Immunohistochemistry demonstrated the lower expression of Ki67 (green) in the 80 mg/kg peretinoin group compared with the 0 mg/kg vehicle control group. The corresponding results for the Ki67-positive cells are shown in F. (G) Development of HCC. (H) Significantly reduced development of HCC regions in the group treated with 60 mg/kg or 80 mg/kg. *P<0.05; **P<0.01. Data are presented as mean±SD. n=3 (B, D, F) and n=4–16 (H). Scale bar, 100 μm and 1.0 cm (for the macro images in G). Color images available online at www.liebertpub.com/scd

Similar articles

Cited by

References

    1. Yamamoto J, Kosuge T, Takayama T, Shimada K, Yamasaki S, Ozaki H, Yamaguchi N. and Makuuchi M. (1996). Recurrence of hepatocellular carcinoma after surgery. Br J Surg 83:1219–1222 - PubMed
    1. Singh SK, Hawkins C, Clarke ID, Squire JA, Bayani J, Hide T, Henkelman RM, Cusimano MD. and Dirks PB. (2004). Identification of human brain tumour initiating cells. Nature 432:396–401 - PubMed
    1. O'Brien CA, Pollett A, Gallinger S. and Dick JE. (2007). A human colon cancer cell capable of initiating tumour growth in immunodeficient mice. Nature 445:106–110 - PubMed
    1. Ginestier C, Hur MH, Charafe-Jauffret E, Monville F, Dutcher J, Brown M, Jacquemier J, Viens P, Kleer CG, et al. (2007). ALDH1 is a marker of normal and malignant human mammary stem cells and a predictor of poor clinical outcome. Cell Stem Cell 1:555–567 - PMC - PubMed
    1. Collins AT, Berry PA, Hyde C, Stower MJ. and Maitland NJ. (2005). Prospective identification of tumorigenic prostate cancer stem cells. Cancer Res 65:10946–10951 - PubMed

Publication types