

Meta-analysis reveals the association of common variants in the uncoupling protein (UCP) 1-3 genes with body mass index variability
- PMID: 24804925
- PMCID: PMC4013025
- DOI: 10.1371/journal.pone.0096411
Meta-analysis reveals the association of common variants in the uncoupling protein (UCP) 1-3 genes with body mass index variability
Abstract
Background: The relationship between uncoupling protein (UCP) 1-3 polymorphisms and susceptibility to obesity has been investigated in several genetic studies. However, the impact of these polymorphisms on obesity is still under debate, with contradictory results being reported. Until this date, no meta-analysis evaluated the association of UCP polymorphisms with body mass index (BMI) variability. Thus, this paper describe a meta-analysis conducted to evaluate if the -3826A/G (UCP1); -866G/A, Ala55Val and Ins/Del (UCP2) and -55C/T (UCP3) polymorphisms are associated with BMI changes.
Methods: A literature search was run to identify all studies that investigated associations between UCP1-3 polymorphisms and BMI. Weighted mean differences (WMD) were calculated for different inheritance models.
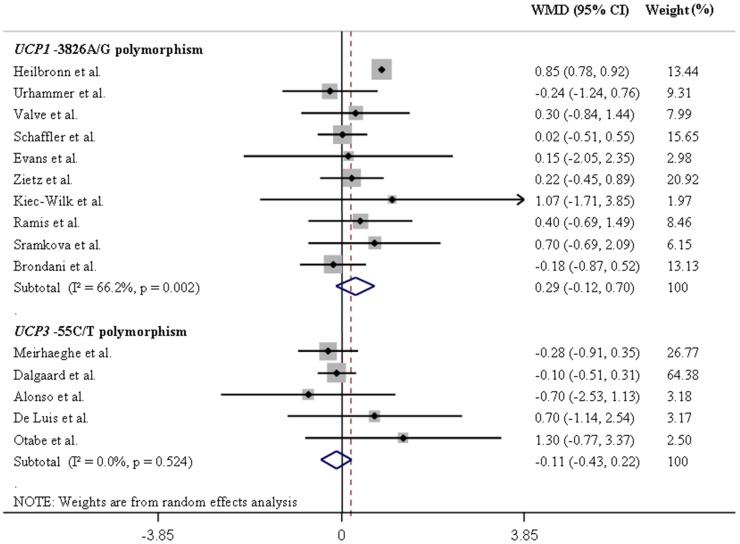
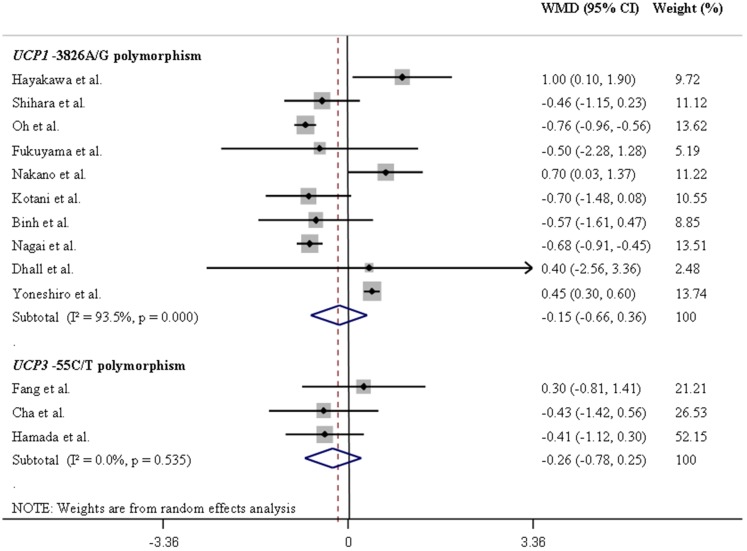
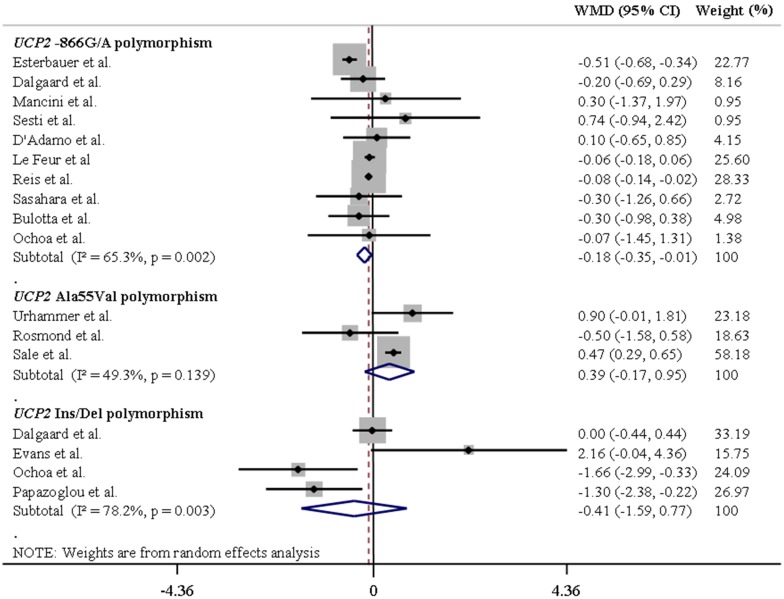
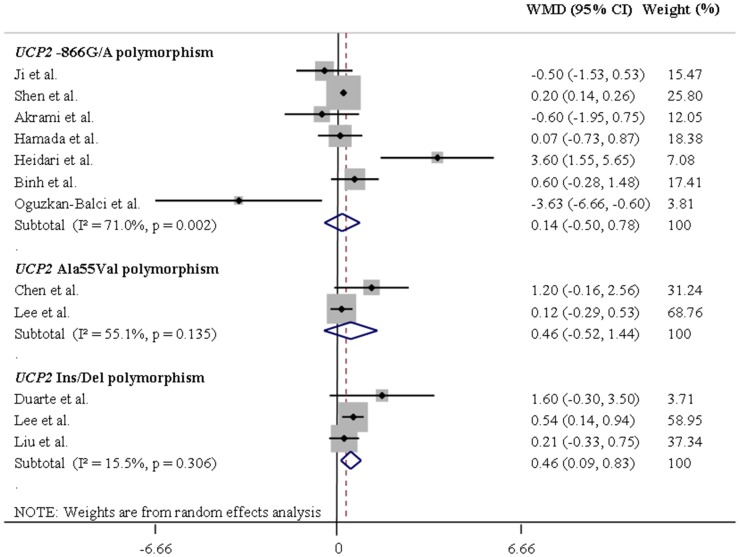
Results: Fifty-six studies were eligible for inclusion in the meta-analysis. Meta-analysis results showed that UCP2 55Val/Val genotype was associated with increased BMI in Europeans [Random Effect Model (REM) WMD 0.81, 95% CI 0.20, 1.41]. Moreover, the UCP2 Ins allele and UCP3-55T/T genotype were associated with increased BMI in Asians [REM WMD 0.46, 95% CI 0.09, 0.83 and Fixed Effect Model (FEM) WMD 1.63, 95% CI 0.25, 3.01]. However, a decreased BMI mean was observed for the UCP2-866 A allele in Europeans under a dominant model of inheritance (REM WMD -0.18, 95% CI -0.35, -0.01). There was no significant association of the UCP1-3826A/G polymorphism with BMI mean differences.
Conclusions: The meta-analysis detected a significant association between the UCP2-866G/A, Ins/Del, Ala55Val and UCP3-55C/T polymorphisms and BMI mean differences.
Conflict of interest statement
Figures
Similar articles
-
Associations between UCP1 -3826A/G, UCP2 -866G/A, Ala55Val and Ins/Del, and UCP3 -55C/T polymorphisms and susceptibility to type 2 diabetes mellitus: case-control study and meta-analysis.PLoS One. 2013;8(1):e54259. doi: 10.1371/journal.pone.0054259. Epub 2013 Jan 24. PLoS One. 2013. PMID: 23365654 Free PMC article.
-
Association of the UCP polymorphisms with susceptibility to obesity: case-control study and meta-analysis.Mol Biol Rep. 2014 Aug;41(8):5053-67. doi: 10.1007/s11033-014-3371-7. Epub 2014 Apr 22. Mol Biol Rep. 2014. PMID: 24752406
-
UCP2 -866G/A, Ala55Val and UCP3 -55C/T polymorphisms in association with obesity susceptibility - a meta-analysis study.PLoS One. 2013;8(4):e58939. doi: 10.1371/journal.pone.0058939. Epub 2013 Apr 1. PLoS One. 2013. PMID: 23560041 Free PMC article.
-
Uncoupling protein 2 -866G/A and uncoupling protein 3 -55C/T polymorphisms in young South African Indian coronary artery disease patients.Gene. 2013 Jul 25;524(2):79-83. doi: 10.1016/j.gene.2013.04.048. Epub 2013 Apr 29. Gene. 2013. PMID: 23639961 Review.
-
Genetics of uncoupling proteins in humans.Int J Obes Relat Metab Disord. 1999 Jun;23 Suppl 6:S46-8. doi: 10.1038/sj.ijo.0800944. Int J Obes Relat Metab Disord. 1999. PMID: 10454122 Review.
Cited by
-
Uncoupling Protein 2 (UCP2) as Genetic Risk Factor for Obesity in Indonesia is Different in Gender Stratification.Kobe J Med Sci. 2018 Oct 15;64(2):E64-E72. Kobe J Med Sci. 2018. PMID: 30381728 Free PMC article.
-
The effects of acarbose treatment on cardiovascular risk factors in impaired glucose tolerance and diabetic patients: a systematic review and dose-response meta-analysis of randomized clinical trials.Front Nutr. 2023 Aug 1;10:1084084. doi: 10.3389/fnut.2023.1084084. eCollection 2023. Front Nutr. 2023. PMID: 37599681 Free PMC article.
-
Water Consumption: Effect on Energy Expenditure and Body Weight Management.Curr Obes Rep. 2023 Jun;12(2):99-107. doi: 10.1007/s13679-023-00501-8. Epub 2023 Apr 10. Curr Obes Rep. 2023. PMID: 37036559 Review.
-
The association of insertions/deletions (INDELs) and variable number tandem repeats (VNTRs) with obesity and its related traits and complications.J Physiol Anthropol. 2017 Jun 14;36(1):25. doi: 10.1186/s40101-017-0142-x. J Physiol Anthropol. 2017. PMID: 28615046 Free PMC article. Review.
-
The effects of green coffee extract supplementation on glycemic indices and lipid profile in adults: a systematic review and dose-response meta-analysis of clinical trials.Nutr J. 2020 Jul 14;19(1):71. doi: 10.1186/s12937-020-00587-z. Nutr J. 2020. PMID: 32665012 Free PMC article.
References
-
- Moustafa JS, Froguel P (2014) From obesity genetics to the future of personalized obesity therapy. Nat Rev Endocrinol 10: 4. - PubMed
-
- Drummond EM, Gibney ER (2013) Epigenetic regulation in obesity. Curr Opin Clin Nutr Metab Care 16: 392–397. - PubMed
-
- Nan C, Guo B, Warner C, Fowler T, Barrett T, et al. (2012) Heritability of body mass index in pre-adolescence, young adulthood and late adulthood. Eur J Epidemiol 27: 247–253. - PubMed
-
- Brondani LA, Assmann TS, Duarte GC, Gross JL, Canani LH, et al. (2012) The role of the uncoupling protein 1 (UCP1) on the development of obesity and type 2 diabetes mellitus. Arq Bras Endocrinol Metabol 56: 215–225. - PubMed
Publication types
MeSH terms
Substances
LinkOut - more resources
Full Text Sources
Other Literature Sources
Medical
