. 2014 May 29;509(7502):637-40.
doi: 10.1038/nature13300. Epub 2014 May 4.

Clonal selection in the germinal centre by regulated proliferation and hypermutation

Affiliations

Clonal selection in the germinal centre by regulated proliferation and hypermutation

Alexander D Gitlin et al. Nature. .

Abstract

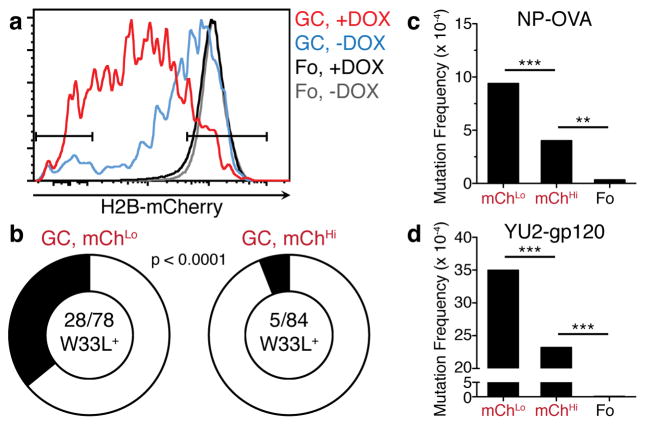
During immune responses, B lymphocytes clonally expand and undergo secondary diversification of their immunoglobulin genes in germinal centres (GCs). High-affinity B cells are expanded through iterative interzonal cycles of division and hypermutation in the GC dark zone followed by migration to the GC light zone, where they are selected on the basis of affinity to return to the dark zone. Here we combine a transgenic strategy to measure cell division and a photoactivatable fluorescent reporter to examine whether the extent of clonal expansion and hypermutation are regulated during interzonal GC cycles. We find that both cell division and hypermutation are directly proportional to the amount of antigen captured and presented by GC B cells to follicular helper T cells in the light zone. Our data explain how GC B cells with the highest affinity for antigen are selectively expanded and diversified.


Conflict of interest statement

The authors declare no competing financial interest.

Figures

Extended Data Figure 1
Extended Data Figure 1. Flow cytometric analysis of germinal center B cells, related to Figure 1
a, Representative flow cytometry plots display gating strategy used to analyze experiments in Fig. 1. Live B220+ singlets were gated on GC cells (CD38-FAS+) and divided into LZ (CD86+CXCR4) and DZ (CD86CXCR4+) cells. B1-8hi DEC205+/+ cells within these compartments were identified as CD45.1+ and B1-8hi DEC205−/− cells were identified as CD45.1+CD45.2+. b, c, Total number of B1-8hi DEC205+/+ (b) and B1-8hi DEC205−/− (c) GC B cells per 106 lymph node cells from the experiments reported in Fig. 1. Bars represent mean values; error bars = SEM.
Extended Data Figure 2
Extended Data Figure 2. tTA-H2B-mCh system, related to Figure 2
a, Diagrammatic representation of the Vav-tTA and Tet-Op-H2B-mCh transgenes that were combined (tTA-H2B-mCh) to label B cells with H2B-mCh in order to inducibly measure cell division in the GC with DOX. b, Histogram displaying H2B-mCh expression among B220+ lymphocytes from the peripheral blood of WT (gray), Vav-tTA+ (red), Tet-Op-H2B-mCh+ (blue), and tTA-H2B-mCh mice (black). c, Purified B cells from tTA-H2B-mCh mice were labeled with CFSE and stimulated with LPS and IL-4. Left, H2B-mCh levels after 0 or 72 hours in culture (gray and black, respectively). Middle, H2B-mCh gates for B cells activated for 72 hours are color-coded. Right, histogram displaying the CFSE levels for the color-coded H2B-mCh gates. Data are representative of two independent experiments.
Extended Data Figure 3
Extended Data Figure 3. Edu/BrdU labeling strategy to analyze the progression of S phase, related to Figure 3a, b
a, Mice with ongoing GCs were administered intravenous EdU followed by intravenous BrdU 1 hour later. A half-hour after BrdU administration, mice were analyzed by flow cytometry. Cells in early S phase at the time of analysis incorporate only the second nucleotide analog and can therefore be identified as EdUBrdU+. Cells in mid/late S phase replicate DNA during both the EdU and BrdU injections and are therefore EdU+BrdU+. Cells that completed S phase in the hour between EdU and BrdU administration are post-S phase cells at the time of analysis. These cells incorporate the first label, but not the second, making them EdU+BrdU. b, Gating strategy used in Fig. 3a, b. B1-8hi DEC205+/+ and B1-8hi DEC205−/− GC B cells were identified among CD19+CD38FAS+ cells using CD45 allotypic markers and were further subdivided based on EdU and BrdU incorporation and DZ/LZ surface phenotype. c, Flow cytometry plots displaying EdU and BrdU incorporation in GC and follicular B cells of mice receiving EdU and/or BrdU. d, Percent of B1-8hi DEC205+/+ (black) and B1-8hi DEC205−/− (gray) GC B cells in early (EdUBrdU+, left), mid/late (EdU+BrdU+, middle), and post- (EdU+BrdU, right) S phase periods in control (PBS) or αDEC-OVA treated mice. Data represent values from the same experiments reported in Fig. 3a, b. Error bars = SEM; ** p = 0.0022, two-tailed Mann-Whitney test.
Extended Data Figure 4
Extended Data Figure 4. DZ photoactivation protocol and flow cytomeric analysis, related to Figure 3c–e
a, Diagrammatic representation of the protocol used in Figure 3c–e. b, Flow cytometric gating strategy used to analyze GC B cells photoactivated in the DZ. Live singlets were gated as B220+PAGFP+CD38FAS+Active PAGFP+.
Figure 1
Figure 1. The amount of antigen captured and presented by GC B cells regulates their expansion
a, Protocol for b–e. 1.5–5 × 10⁶ B1-8hi DEC205+/+ and B1-8hi DEC205−/− B cells (≈ 1.5–5 × 10⁵ Igλ+, NP-specific B cells) at a 5:95 ratio were transferred into OVA-primed WT mice, which were boosted with NP-OVA. After 6 days, mice were injected with PBS or αDEC-OVA mixed with αDEC-CS at ratios of 1:0, 1:3, 1:9, or 1:39. Lymph nodes were analyzed 2, 3, and 4 days after injection. b, Proportion of B1-8hi DEC205+/+ and B1-8hi DEC205−/− GC B cells 48 hours after treatment. c–e, Mean fraction of DEC205+/+ B cells among B1-8hi GC (c), DZ (CD86−−CXCR4+, d), and LZ (CD86+CXCR4, e) cells. Error bars = SEM. Data represent 2–3 independent experiments at each time point with a total of 4–6 mice per condition for all time points.
Figure 2
Figure 2. T cell help regulates the number of GC B cell divisions
a, H2B-mCh fluorescence among B1-8hi tTA-H2B-mCh B cells within the follicular (upper) or GC (lower) compartments of untreated mice (black) or after 36 (red) or 84 (blue) hours on DOX. Solid gray represents non-fluorescent cells. b, H2B-mCh fluorescence among B1-8hi tTA-H2B-mCh GC B cells in mice that received a 5:95 mixture of B1-8hi tTA-H2B-mCh and B1-8hi DEC205−/− B cells and were treated with PBS, αDEC-CS, or αDEC-OVA for 72 hours and administered DOX for 60 hours before analysis. c, Mean fraction of B1-8hi tTA-H2B-mCh GC B cells treated as in b. Error bars = SEM. d, Percent DZ cells among B1-8hi tTA-H2B-mCh GC B cells after treatment with PBS or αDEC-CS (control) or αDEC-OVA for 48 hours and DOX for 36 hours. Each symbol represents one mouse and lines represent mean values. Data represent 3–4 independent experiments for all time points with 2–3 mice for each condition per experiment. * p < 0.005; ** p < 0.001; *** p <0.0001, two-tailed Mann-Whitney test.
Figure 3
Figure 3. Selective expansion involves increased S phase initiation in the DZ and longer DZ residence time
a, EdU and BrdU incorporation among GC B cells. OVA-primed mice received 5 × 10⁶ B1-8hi DEC205+/+ and B1-8hi DEC205−/− B cells at a 15:85 or 50:50 ratio. On day 6 after boosting with NP-OVA, mice receiving the 15:85 or the 50:50 B cell transfer were injected with αDEC-OVA or PBS, respectively. Two days later, mice received EdU and 1 hour later BrdU and were analyzed after 30 minutes (detailed in Extended Data Fig. 3a). b, Percent DZ cells among early (E), mid/late (M/L), and post- (P) S phase cells. Black squares denote αDEC-OVA treatment; white squares denote PBS control. Data represent two independent experiments with 6 or 7 mice per condition in total. Squares indicate mean values; error bars = SEM. c, d, OVA-primed mice received 5 × 10⁶ B1-8hi PAGFP+ and B1-8hi DEC205−/− B cells at a 15:85 ratio or 5 × 10⁶ B1-8hi PAGFP+ B cells alone and were boosted with NP-OVA. For mice receiving mixed B cell transfers, αDEC-OVA was injected on day 6. On day 8, DZ cells were photoactivated (c) and GC B cells were analyzed by flow cytometry (detailed in Extended Data Fig. 4a) (d). e, Percent LZ cells among photoactivated B1-8hi PAGFP+ GC B cells at 0 or 6 hours after DZ photoactivation. Each symbol represents one mouse. Data represent multiple independent experiments. ** p = 0.0022, two-tailed Mann-Whitney test.
Figure 4
Figure 4. Increased cell division in polyclonal GCs is associated with higher Ig affinity and somatic hypermutation
a–d, tTA-H2B-mCh mice were immunized with NP-OVA (a–c) or YU2-gp120 (d) and administered DOX for 36 hours before purification. a, Representative histogram displaying mChHi and mChLo gates. b, Frequency of W33L mutation among VH186.2 clones in mChHi and mChLo GC B cells on day 14 after immunization. The number of W33L+ clones among VH186.2 sequences is shown in the center of the pie chart and was compared using Fisher’s Exact test. Data are pooled from 2 independent experiments with 2 mice each. c–d, SHM in the JH4 intron among mChHi and mChLo GC B cells on day 7 after NP-OVA (c) and day 9 after YU2-gp120 immunization (d). Data in (c) and (d) are pooled from 2 independent experiments with 2–3 mice each. Over 160 clones in (c) and 140 clones in (d) were analyzed for mChHi and mChLo GC B cells and 51 clones in (c) and 94 clones in (d) were analyzed for follicular B cells. Fo, follicular B cells. ** p = 0.0033; *** p < 0.0001, χ2 test with Yates correction.

Comment in

References

    1. Berek C, Berger A, Apel M. Maturation of the immune response in germinal centers. Cell. 1991;67:1121–1129. - PubMed
    1. Jacob J, Kelsoe G, Rajewsky K, Weiss U. Intraclonal generation of antibody mutants in germinal centres. Nature. 1991;354:389–392. doi: 10.1038/354389a0. - DOI - PubMed
    1. Rajewsky K. Clonal selection and learning in the antibody system. Nature. 1996;381:751–758. doi: 10.1038/381751a0. - DOI - PubMed
    1. Victora GD, Nussenzweig MC. Germinal centers. Annual review of immunology. 2012;30:429–457. doi: 10.1146/annurev-immunol-020711-075032. - DOI - PubMed
    1. Allen CD, Okada T, Tang HL, Cyster JG. Imaging of germinal center selection events during affinity maturation. Science. 2007;315:528–531. doi: 10.1126/science.1136736. - DOI - PubMed

Publication types

MeSH terms