. 2014 Jun 12;510(7504):298-302.
doi: 10.1038/nature13236. Epub 2014 May 4.

Quantitative flux analysis reveals folate-dependent NADPH production

Affiliations

Quantitative flux analysis reveals folate-dependent NADPH production

Jing Fan et al. Nature. .

Erratum in

  • Nature. 2014 Sep 25;513(7519):574

Abstract

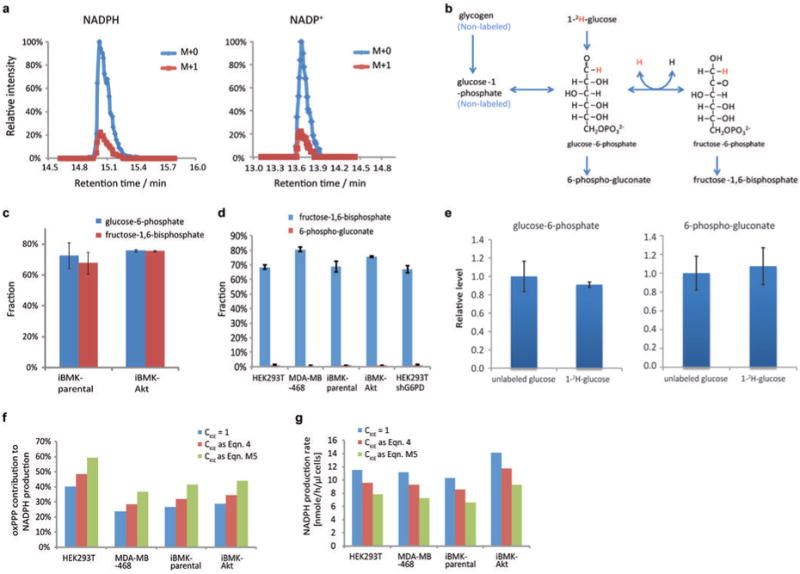
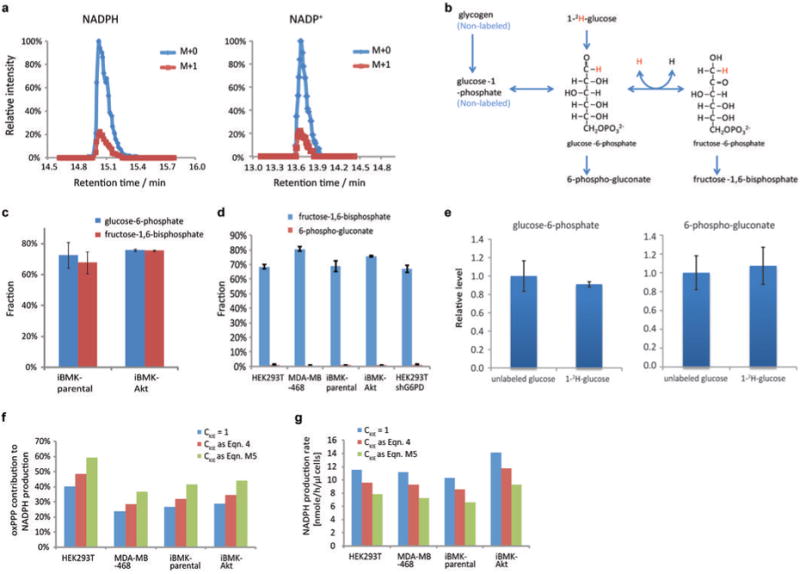
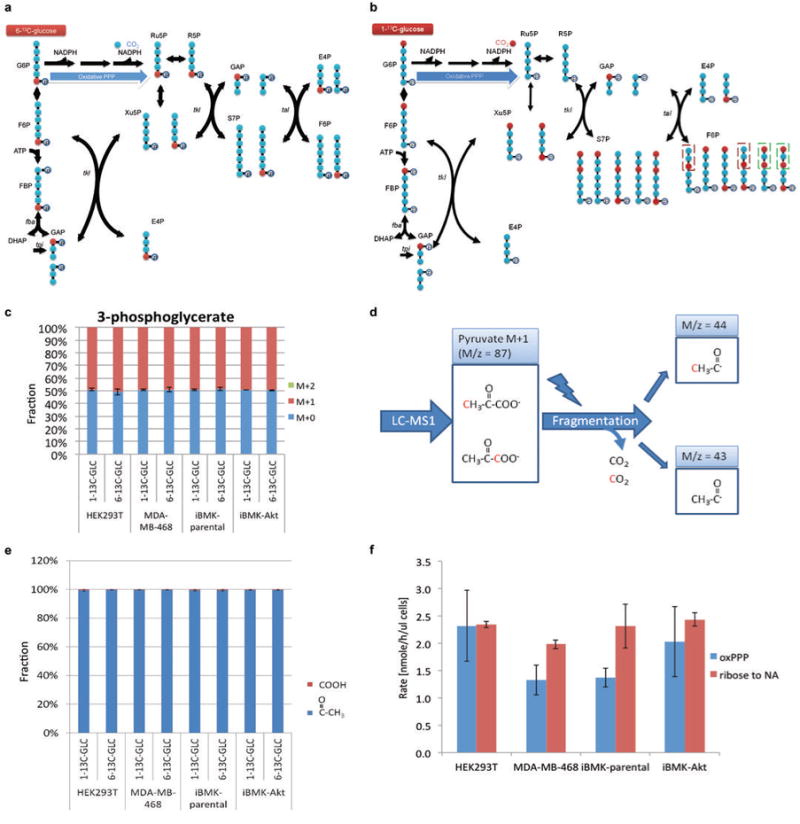
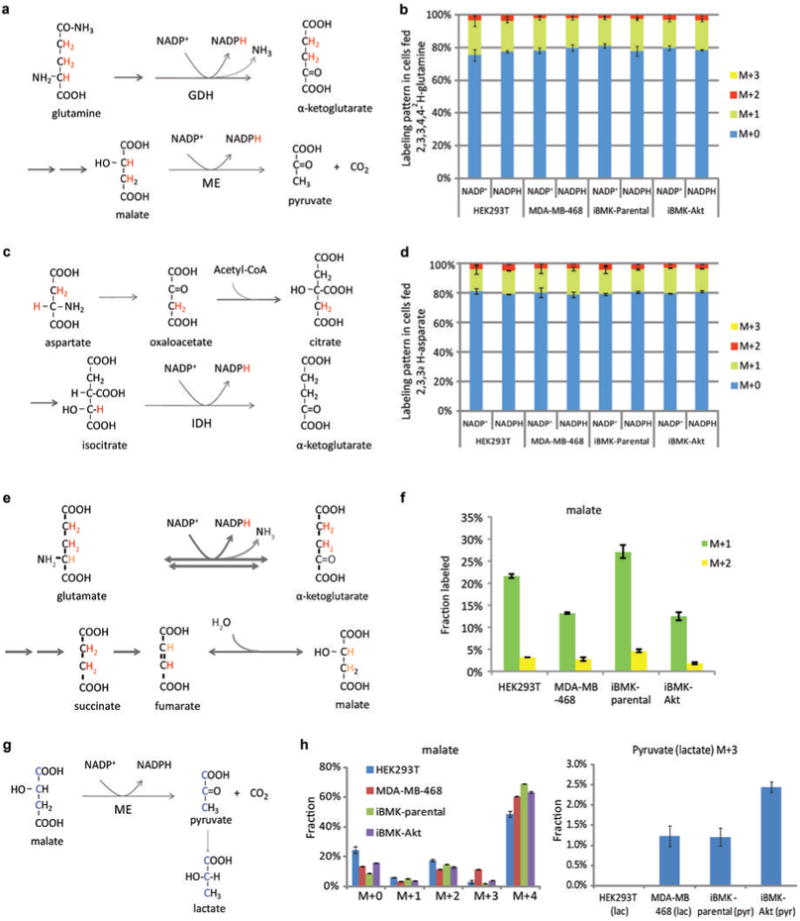
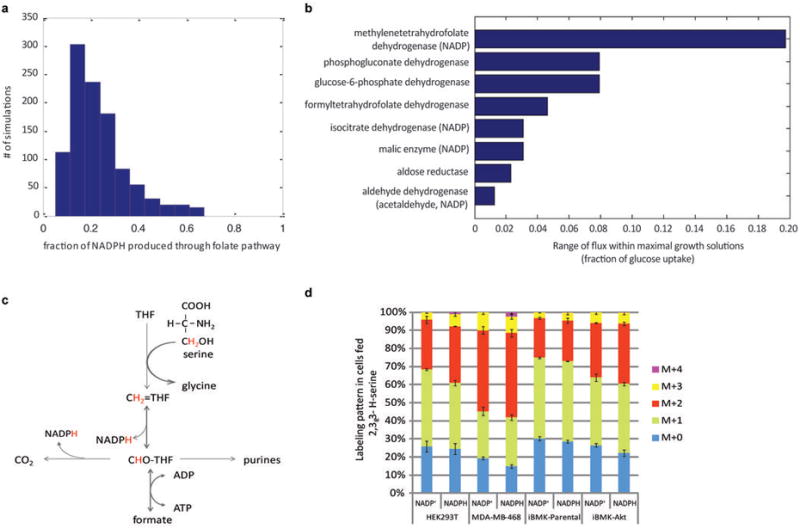
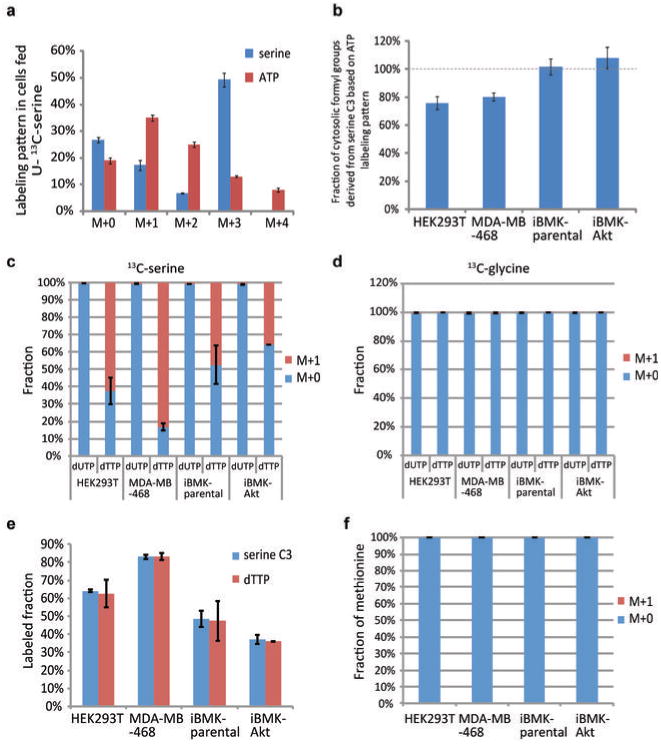
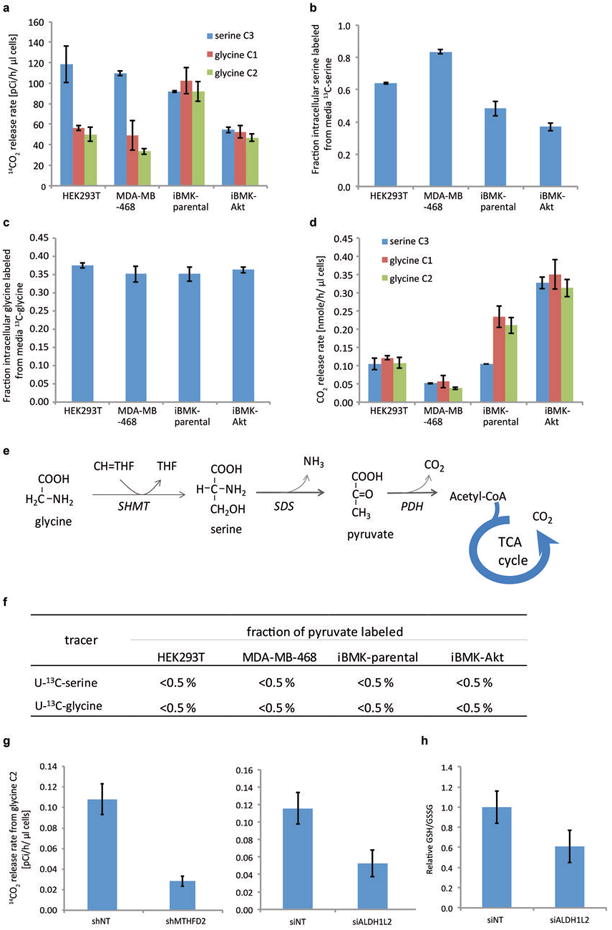
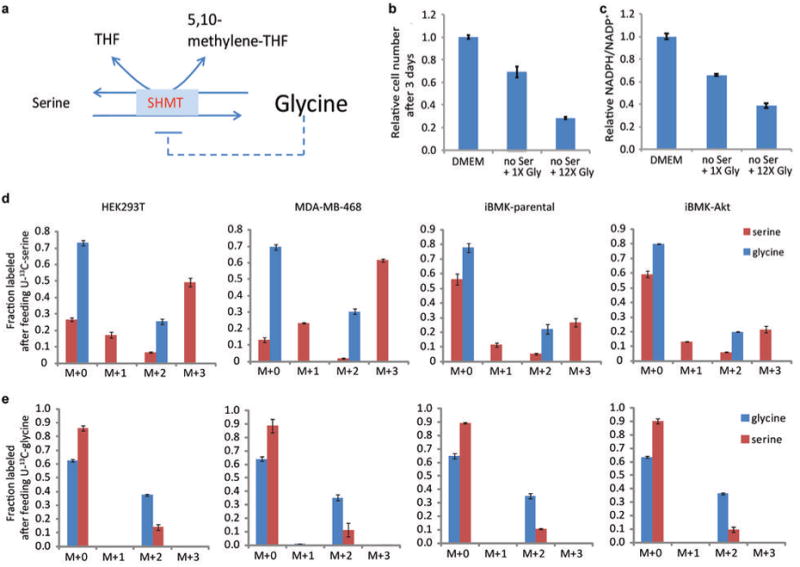
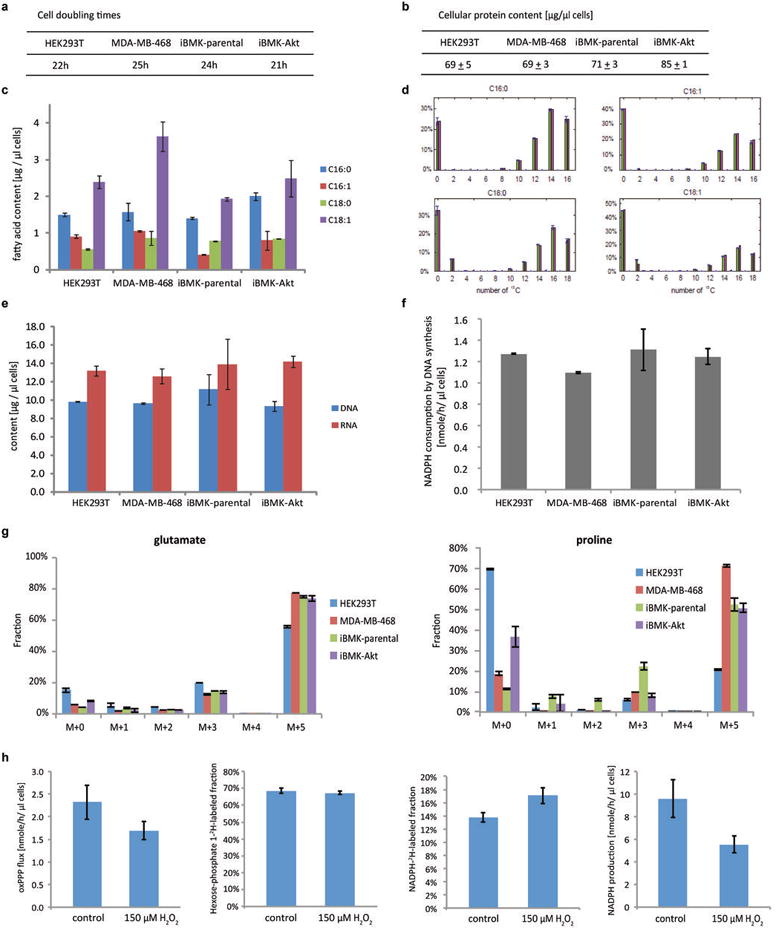
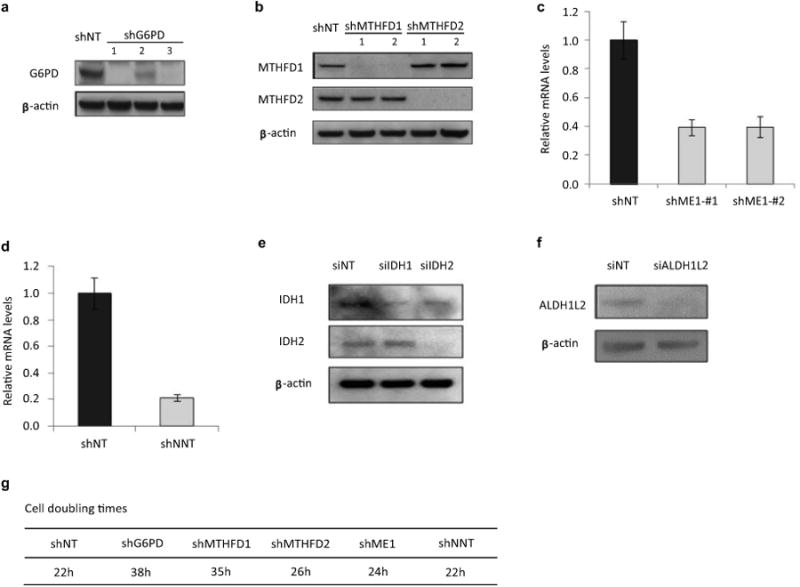
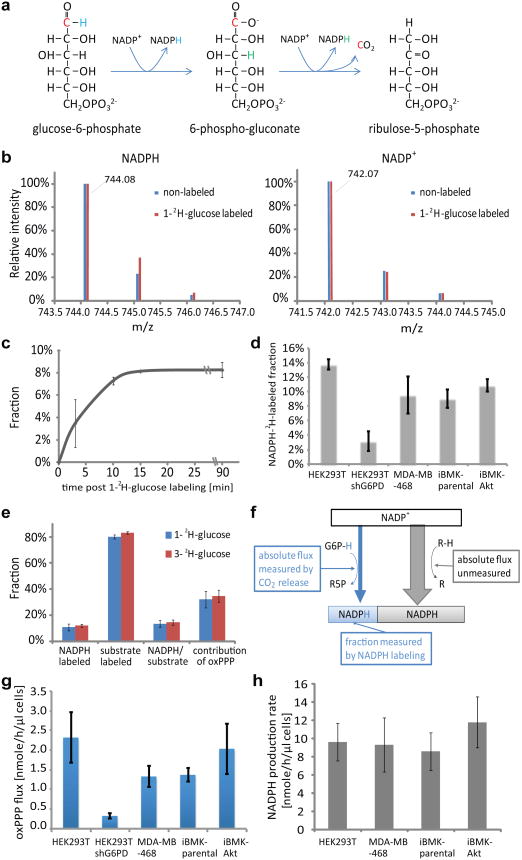
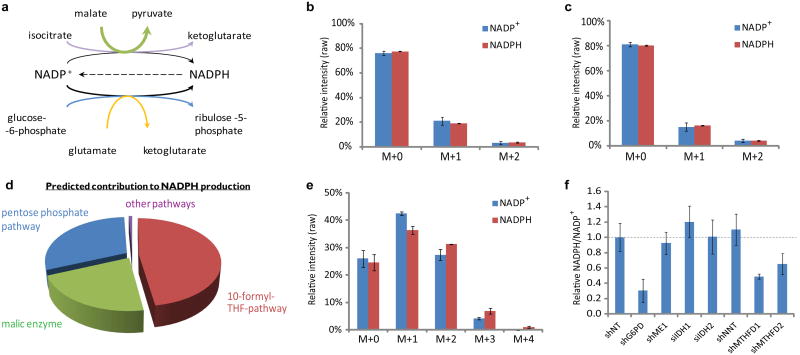
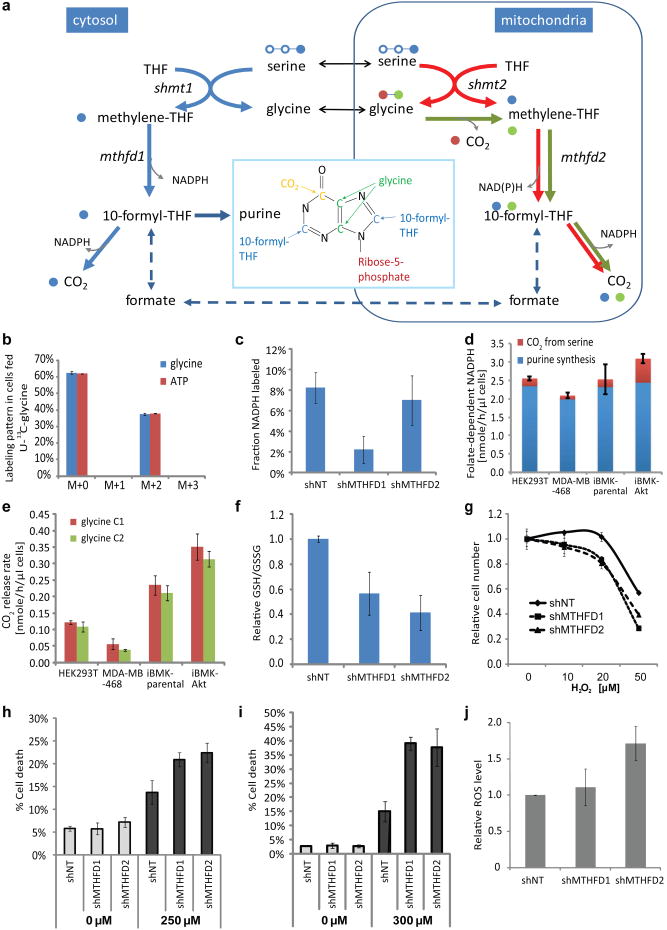
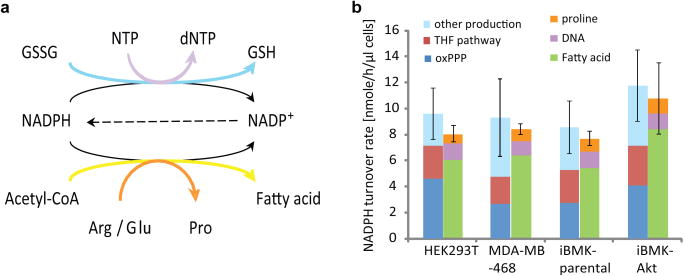
ATP is the dominant energy source in animals for mechanical and electrical work (for example, muscle contraction or neuronal firing). For chemical work, there is an equally important role for NADPH, which powers redox defence and reductive biosynthesis. The most direct route to produce NADPH from glucose is the oxidative pentose phosphate pathway, with malic enzyme sometimes also important. Although the relative contribution of glycolysis and oxidative phosphorylation to ATP production has been extensively analysed, similar analysis of NADPH metabolism has been lacking. Here we demonstrate the ability to directly track, by liquid chromatography-mass spectrometry, the passage of deuterium from labelled substrates into NADPH, and combine this approach with carbon labelling and mathematical modelling to measure NADPH fluxes. In proliferating cells, the largest contributor to cytosolic NADPH is the oxidative pentose phosphate pathway. Surprisingly, a nearly comparable contribution comes from serine-driven one-carbon metabolism, in which oxidation of methylene tetrahydrofolate to 10-formyl-tetrahydrofolate is coupled to reduction of NADP(+) to NADPH. Moreover, tracing of mitochondrial one-carbon metabolism revealed complete oxidation of 10-formyl-tetrahydrofolate to make NADPH. As folate metabolism has not previously been considered an NADPH producer, confirmation of its functional significance was undertaken through knockdown of methylenetetrahydrofolate dehydrogenase (MTHFD) genes. Depletion of either the cytosolic or mitochondrial MTHFD isozyme resulted in decreased cellular NADPH/NADP(+) and reduced/oxidized glutathione ratios (GSH/GSSG) and increased cell sensitivity to oxidative stress. Thus, although the importance of folate metabolism for proliferating cells has been long recognized and attributed to its function of producing one-carbon units for nucleic acid synthesis, another crucial function of this pathway is generating reducing power.


Figures

Extended Figure 1
Extended Figure 1. Probing the fractional contribution of the oxPPP to NADPH production with 2H-glucose
(a) Example of LC-MS chromatogram of M+0 and M+1 forms of NADPH and NADP+. Plotted values are 5 ppm mass window around each compound. (b) Extent of NADPH labeling must be corrected for extent of glucose-6-phosphate labeling. Incomplete labeling can occur due to influx from glycogen or H/D exchange. (c) Labeling fraction of glucose-6-phosphate and fructose-1,6-phosphate in iBMK cells with and without activated Akt (20 min after switching into 1-2H-glucose). (d) Labeling fraction of fructose-1,6-phosphate and 6-phosphogluconate after feeding 1-2H-glucose. Labeling fraction of fructose-1,6-phosphate reflects the labeling of glucose-6-phosphate, whose peak after addition of the 2H-glucose was not sufficiently resolved from other LC-MS peaks in HEK293T and MDA-MB-468 cells to allow precise quantitation of its labeling directly. The difference in the labeling fraction between glucose-6-phosphate and 6-phosphogluconate reflects the fraction of deuterium labeling specifically at position 1 of glucose-6-phosphate. (e) Due to the kinetic isotope effect, feeding of deuterium tracer can potentially alter pathway fluxes. To assess whether the feeding of 1-2H-glucose creates a bottleneck in the oxPPP, we measured the relative concentration of oxPPP intermediates with or without feeding of 1-2H-glucose. No significant changes were observed. (f) Impact of different mechanisms of correcting for the deuterium kinetic isotope effect on fractional contribution of oxPPP to NADPH production. (g) Impact of different mechanisms of correcting for the deuterium kinetic isotope effect on calculated total NADPH production rate. The correction mechanisms are (i) no kinetic isotope effect (CKIE = 1), (ii) no impact on total pathway flux but preferential utilization of 1H over 2H-labeled substrate (Eqn. 4 of main text) (the smallest reasonable correction, and the one applied in the main text), or (iii) full kinetic isotope effect observed for the isolate enzyme with associated decrease in total pathway flux (Eqn. M5 of Methods) (the largest reasonable correction). All results are mean ± SD, N ≥ 2 biological replicates from a single experiment and were confirmed in multiple experiments.
Extended Figure 2
Extended Figure 2. Two independent measurement methods give consistent oxPPP fluxes
(a) Diagram of 1-14C-glucose and 6-14C-glucose metabolism through glycolysis and pentose phosphate pathway. The oxPPP specifically releases glucose C1 as CO2, whereas all other CO2-releasing reactions are downstream of triose phosphate isomerase (TPI). As TPI renders C1 and C6 of glucose indistinguishable (both positions become C3 of glyceraldehyde-3-phosphate), the difference in CO2 release from C1 versus C6, multiplied by two, gives the absolute rate of NADPH production via oxPPP. A potential complication involves carbon scrambling via the reactions of the non-oxidative PPP, but this was insignificant (see Extended Figure 3). (b) Complete carbon labeling of glucose-6-phosphate. Glucose-6-phosphate labeled completely (> 99%) within 2 h of switching cells into U-13C- glucose. (c) CO2 release rate from1-14C-glucose and 6-14C-glucose. (d) Pool size of 6-phosphogluconate. (e) Kinetics of glucose-6-phosphate and 6-phosphogluconate labeling upon switching cells to U-13C-glucose. (f) Overlay upon the 6-phosphogluconate data from (e) of simulated labeling curves based on the flux that best fits the labeling kinetics (blue) (see Methods), and the flux from 14C-CO2 release measurements (green). (g) Calculated fluxes and 95% confidence intervals based on kinetics of 6-phosphogluconate labeling from U-13C- glucose, compared to radioactive CO2 release from 1-14C- glucose and 6-14C- glucose. The two approaches give consistent results, with the 14C-CO2 release data more precise. Mean ± SD, N=3.
Extended Figure 3
Extended Figure 3. The extent of carbon scrambling via non-oxPPP is insufficient to impact substantially oxPPP flux determination using 1-14C and 6-14C-glucose, with most carbon entering oxPPP directed towards nucleotide synthesis
(a) Schematic of glycolysis and PPP showing fate of glucose C6. Note that glucose C6 occupies the phosphorylated position (i.e. last carbon) in every intermediate. Thus, upon catabolism to pyruvate, glucose C6 always becomes pyruvate C3, irrespective of any potential scrambling reactions. (b) Schematic of glycolysis and PPP showing fate of glucose C1. Glucose C1 can be scrambled via the non-oxPPP, moving to C3 (red boxes) or C6 as shown here. The forms shown in the green boxes were not experimentally observed. As glucose C3 becomes pyruvate C1 (the carboxylic acid carbon of pyruvate), which is selectively released as CO2 by pyruvate dehydrogenase, scrambling of C1 to C3 can potentially increase CO2 release from glucose C1 relative to C6. This is ruled out in panels (d) and (e). (c) Feeding 1-13C-glucose or 6-13C-glucose results in 50% labeling of 3-phosphoglycerate without any double labeling (i.e., M+2), as expected in the absence of scrambling. (d) MS/MS method to analyze positional labeling of 1-labeled pyruvate. Collision induced dissociation breaks pyruvate to release the carboxylic acid group as CO2. If the daughter peak of 1-labeled pyruvate does not contain labeled carbon (M/z = 43), the labeling is at the C1 position; otherwise, it is at C2 or C3. (e) After feeding 1-13C-glucose or 6-13C-glucose, pyruvate is not labeled at the C1 position (<0.5%), ruling out extensive scrambling. (f) OxPPP flux is similar to or smaller than ribose demand for nucleotide synthesis. Mean ± SD, N=3.
Extended Figure 4
Extended Figure 4. Probing the contribution of alternative NADPH producing pathways
(a) Pathway diagram showing potential for 2,3,3,4,4-2H -glutamine to label NADPH via glutamate dehydrogenase and via malic enzyme. Labeled hydrogens are shown in red. (b) NADP+ and NADPH labeling patterns (without correction for natural 13C-abundance) after 48 h incubation with 2,3,3,4,4-2H-glutamine. The indistinguishable labeling of NADP+ and NADPH implies lack of NADPH redox active hydrogen labeling. (c) Pathway diagram showing potential for 2,3,3-2H-aspartate to label NADPH via isocitrate dehydrogenase. (d) NADP+ and NADPH labeling patterns (without correction for natural 13C-abundance) after 48 h incubation with 2,3,3-2H -aspartate. The indistinguishable labeling of NADP+ and NADPH implies lack of redox active hydrogen labeling. (e) Diagram of 2,3,3,4,4-2H-glutamine metabolism through TCA cycle, tracing labeled hydrogen. Hydrogen atoms of lighter shade indicate potential H/D exchange with water. (f) Malate labeling fraction after cells were fed 2,3,3,4,4-2H-glutamine for 48 h. (g) Pathway diagram showing potential for 1,2,3-13C-malate (made by feeding U-13C-glutamine) to label pyruvate and lactate via malic enzyme. (h) Extent of malate and pyruvate/lactate 13C-labeling. Cells were incubated with U-13C-glutamine for 48 h. M+3 pyruvate indicates malic enzyme flux, which may generate either NADH or NADPH. Similar results were obtained also for M+3 lactate, which was used as a surrogate for pyruvate in cases where lactate was better detected The corresponding maximal possible malic enzyme-driven NADPH production rate ranges, depending on the cell line, from < 2 nmol μL-1 h-1 to 6 nmol μL-1 h-1. Mean ± SD, N ≥ 2.
Extended Figure 5
Extended Figure 5. Computational and experimental evidence for THF-dependent NADPH production
(a) Predicted contribution of folate metabolism to NADPH production based on flux balance analysis, using minimization of total flux as the objective function, across different biomass compositions. The biomass fraction of cell dry weight consisting of protein, nucleic acid, and lipid was varied as follows: protein 50% - 90% with a step size of 10%; RNA/DNA 3%-20% with step size of 1%, and lipids 3% - 20% with step size of 1% (considering only those combinations that sum to no more than 100%). With this range of physiologically possible biomass compositions, the model predicts a median contribution of folate metabolism of 24%. Note that with the constraint of experimentally measured biomass composition, yet without constraining the uptake rate of amino acids other than glutamine to be ≤ 1/3 of the glutamine uptake rate, the contribution of folate pathway to total NADPH production is predicted to be 23%. (b) Range of feasible flux through NADPH producing reactions in Recon1 model computed via Flux Variability Analysis under the constraint of maximal growth rate. As shown, the model predicts that each NADPH producing reaction can theoretically have zero flux, with all NADPH production proceeding through alternative pathways. Only reactions whose flux upper bound is greater than zero are shown. Reactions producing NADPH via a thermodynamically infeasible futile cycle were manually removed. As shown, among all NADPH producing reactions, MTHFD has the highest flux consistent with maximal growth. (c) Pathway diagram showing potential for 2,3,3-2H–serine to label NADPH via methylene tetrahydrofolate dehydrogenase. (d) NADP+ and NADPH labeling pattern after 48 h incubation with 2,3,3-2H-serine (no glycine present in the media). The greater abundance of more heavily labeled forms of NADPH relative to NADP+ indicates redox active hydrogen labeling. Results are mean ± SD, N ≥ 2 biological replicates from a single experiment and were confirmed in N ≥ 2 experiments. Based on the data in panel (d) the contribution of MTHFD1 to cytosolic NADPH production spans a broad range (10% - 40% of total cytosolic NADPH; the range is due to variation across cell lines, experimental noise, and the large KIE). This range includes the flux calculated based on purine biosynthetic rate and 14C-CO2 release from serine (Figure 3d). Note that the total contribution of the cytosolic folate metabolism to NADPH production can exceed that of MTHFD1, as 10-formyl-THF dehydrogenase also produces NADPH.
Extended Figure 6
Extended Figure 6. One-carbon units used in purine and thymidine synthesis are derived from serine
(a) Serine and ATP labeling pattern after 24 h incubation of HEK293T cells with U-13C-serine. The presence of M+1 to M+4 ATP indicates that serine contributes carbon to purines both through glycine and through one-carbon units derived from serine C3. (b) Quantitative analysis of cytosolic one-carbon unit labeling from measured the intracellular ATP, glycine, and serine labeling reveals that most cytosolic 10-formyl-THF assimilated into purines comes from serine. (c) U-13C- serine labels the methyl group that distinguishes dTTP from dUTP. (d) U-13C-glycine does not label dTTP. (e) The extent of dTTP labeling mirrors the extent of intracellular serine labeling. (f) Methionine does not label from U-13C-glycine. In all experiments, cells were grown in U-13C-serine or glycine for 48 h. Mean ± SD, N = 3.
Extended Figure 7
Extended Figure 7. Measurement of CO2 release rate from serine and glycine by combination of 14C- and 13C-labeling
(a) 14C-CO2 release rate when cells are fed medium with a trace amount of 3-14C-serine, 1-14C-glycine or 2-14C-glycine. (b) Fraction of intracellular serine labeled in cells grown in DMEM media containing 0.4 mM 3-13C-serine in place of unlabeled serine. The residual unlabeled serine is presumably from de novo synthesis. (c) Fraction of intracellular glycine labeled in cells grown in DMEM medium containing 0.4 mM U-13C-glycine in place of unlabeled glycine. (d) CO2 release rates from serine C3, glycine C1 or C2. (e) Potential alternative pathway to metabolize glycine or serine into CO2, via pyruvate. (f) Pyruvate labeling fraction after 48 h labeling with U-13C-serine or U-13C-glycine. The lack of labeling in pyruvate indicates that serine and glycine are not metabolized through this pathway. (g) Knockdown of MTHFD2 or ALDH1L2 decreases CO2 release from glycine C2. (h) Knockdown of ALDH1L2 decreases the GSH/GSSG ratio. Mean ± SD, N=3.
Extended Figure 8
Extended Figure 8. In the absence of serine, elevated concentrations of glycine inhibit cell growth and decrease the NADPH/NADP+ ratio
(a) Schematic of serine hydroxymethyltransferase reaction. High glycine may either inhibit forward flux (product inhibition) or drive reserve flux. (b) Relative cell number after culturing HEK293T cells for 3 days in regular DMEM, DMEM with no serine, and DMEM with no serine and 12.5-times the normal concentration of glycine (5 mM instead of 0.4 mM). (c) Relative NADPH/NADP+ ratio (normalized to cells grown in DMEM) after culturing HEK293T cell for 3 days in regular DMEM, DMEM with no serine, and DMEM with no serine and 12.5-times the normal concentration of glycine. (d), (e) Labeling of serine and glycine after feeding U-13C-serine or U-13C-glycine reveals reverse serine hydroxymethyltransferase flux. Mean ± SD, N=3.
Extended Figure 9
Extended Figure 9. Quantitative analysis of NADPH consumption for biomass production and antioxidant defense
(a) Cell doubling times, which are inversely proportional to biomass production rates. (b) Cellular protein content. (c) Cellular fatty acid content (from saponification of total cellular lipid). (d) Quantitation of fatty acid synthesis versus import, with synthesis but not import requiring NADPH. HEK293T cells were cultured in U-13C-glucose and U-13C-glutamine until pseudo-steady state, and fatty acids saponified from total cellular lipids and their labeling patterns measured (green bars), and production versus import of each fatty acid was stimulated based on this experimental data. The fractional contribution of each route was determined by least square fitting, with the theoretical labeling pattern based on the elucidated routes shown (pink bars). Similar data were obtained also for MD-MBA-468, iBMK-parental, and iBMK-Akt cells (not shown) and used to calculate associated NADPH consumption by fatty acid synthesis. (e) Cellular DNA and RNA contents. (f) NADPH consumption by de novo DNA synthesis. (g) Proline and glutamate labeling patterns after 24 h in U-13C-glutamine media, which was used to quantitate different proline synthesis routes and associated NADPH consumption. (h) Quantitative analysis of cytosolic NADPH consumption in normally growing HEK293T cells (control) and non-growing cell under oxidative stress (150 μM H2O2, 5 h). Total cytosolic NADPH turnover was measured based on the absolute oxPPP flux divided by the fractional contribution of the oxPPP to total NADPH as measured using NADP2H formation from 1-2H-glucose. Mean ± SD, N=3.
Extended Figure 10
Extended Figure 10. Confirmation of knockdown efficiency by western blot or Q-PCR
(a) Western blot for G6PD knockdown. (b) Western blot for MTHFD1 and MTHFD2 knockdown. (c) mRNA level for ME1 knockdown. (d) mRNA level for NNT knockdown. (e) Western blot for IDH1 and IDH2 knockdown. (f) Western blot for ALDH1L2 knockdown. (g) Cell doubling times of HEK293T with stable knockdown of indicated genes (results for different hairpins of the same gene were indistinguishable).
Figure 1
Figure 1
Quantitation of NADPH labeling via oxPPP and of total cytosolic NADPH production. (a) OxPPP pathway schematic. (b) Mass spectra of NADPH and NADP+ from cells labeled with 1- 2H-glucose (iBMK-parental cells, 20 min). (c) Kinetics of NADPH labeling from 1-2H-glucose (iBMK-parental cells). (d) NADPH labeling from 1-2H-glucose (20 min). (e) 1-2H-glucose and 3-2H-glucose yield similar NADPH labeling (iBMK-parental cells, 20 min). Substrate labeling is reported for glucose-6-phosphate for 1-2H-glucose and 6-phosphogluconate for 3-2H-glucose. (f) Schematic illustrating that the total cytosolic NADP+ reduction flux is the absolute oxPPP flux (measured based on 14C-CO2 excretion) divided by the fractional oxPPP contribution (measured based on NADPH 2H-labeling). (g) OxPPP flux based on difference in 14C-CO2 release from 1-14C- and 6-14C-glucose. (h) Total cytosolic NADP+ reduction flux. All results are mean ± SD, N ≥ 2 biological replicates from a single experiment and were confirmed in multiple experiments.
Figure 2
Figure 2
Pathways contributing to NADPH production. (a) Canonical NADPH production pathways. (b) NADPH and NADP+ isotopic distribution (without correction for natural isotope abundances) after incubation with 2,3,3,4,4-2H-glutamine tracer to probe NADPH production via glutamate dehydrogenase and malic enzyme (HEK293T cells, 20 min). See also Extended Figure 4. (c) NADPH and NADP+isotopic distribution as in (b) using 2,3,3-2H–aspartate tracer to probe NADPH production via IDH. See also Extended Figure 4. (d) NADPH production routes predicted by experimentally-constrained genome-scale flux balance analysis. (e) NADPH and NADP+ isotopic distribution as in (b) using 2,3,3-2H-serine tracer to probe NADPH production via folate metabolism (no glycine in the media). See also Extended Figure 5. (f) Relative NADPH/ NADP+ ratio in HEK293T cells with knockdown of various potential NADPH producing enzymes: glucose-6-phosphate dehydrogenase (G6PD), cytosolic malic enzyme (ME1), cytosolic and mitochondrial isocitrate dehydrogenase (IDH1 and IDH2), transhydrogenase (NNT), and cytosolic and mitochondrial methylene tetrahydrofolate dehydrogenase (MTHFD1 and MTHFD2). Plotted ratios are relative to vector control knockdown. Results are mean ± SD, N ≥ 2 biological replicates from a single experiment and were confirmed in multiple experiments.
Figure 3
Figure 3
Quantitation of folate-dependent NADPH production. (a) Pathway schematic with serine C3 in blue, glycine C1 in red, and glycine C2 in green. (b) Glycine and ATP labeling pattern after incubation with U-13C-glycine (HEK293T cells, 24 h). The lack of M+3 and M+4 ATP indicates that no glycine-derived one-carbon units contribute to purine synthesis. (c) Fraction of NADPH labeled at the redox active hydrogen after 24 h incubation with 2,3,3-2H-serine in HEK293T cells with stable MTHFD1 or MTHFD2 knockdown. Same cells used also in (f) – (i). (d) Absolute rate of cytosolic folate-dependent NADPH production. (e) CO2 release rate from glycine C1 and glycine C2. (f) GSH/GSSG ratio. (g) Relative growth, normalized to untreated samples, during 48 h exposure to H2O2. (h) Fractional death after 24 h exposure to 250 μM H2O2. (i) Fractional death after 24 h exposure to 300 μM diamide. (j) Relative ROS levels measured using DCFH assay. Mean ± SD, N=3.
Figure 4
Figure 4
Comparison of NADPH production and consumption. (a) Major NADPH consumption pathways. (b) Cytosolic NADPH production and consumption fluxes. Mean ± SD, with error bar showing the variation of total production or consumption, N = 3.

References

    1. Voet DV, Voet JG. Biochemistry. 3rd. John Wiley & Sons; 2004.
    1. Lee WN, et al. Mass isotopomer study of the nonoxidative pathways of the pentose cycle with [1,2-13C2] glucose. Am J Physiol. 1998;274:E843–851. - PubMed
    1. Metallo CM, Walther JL, Stephanopoulos G. Evaluation of 13C isotopic tracers for metabolic flux analysis in mammalian cells. J Biotechnol. 2009;144:167–174. - PMC - PubMed
    1. Fan TW, et al. Rhabdomyosarcoma cells show an energy producing anabolic metabolic phenotype compared with primary myocytes. Mol Cancer. 2008;7:79. - PMC - PubMed
    1. Brekke EM, Walls AB, Schousboe A, Waagepetersen HS, Sonnewald U. Quantitative importance of the pentose phosphate pathway determined by incorporation of 13C from [2-13C]- and [3-13C] glucose into TCA cycle intermediates and neurotransmitter amino acids in functionally intact neurons. J Cereb Blood Flow Metab. 2012;32:1788–1799. - PMC - PubMed

Publication types

MeSH terms