. 2014 May 15;509(7500):337-41.
doi: 10.1038/nature13309. Epub 2014 May 7.

c-kit+ cells minimally contribute cardiomyocytes to the heart

Affiliations

c-kit+ cells minimally contribute cardiomyocytes to the heart

Jop H van Berlo et al. Nature. .

Abstract

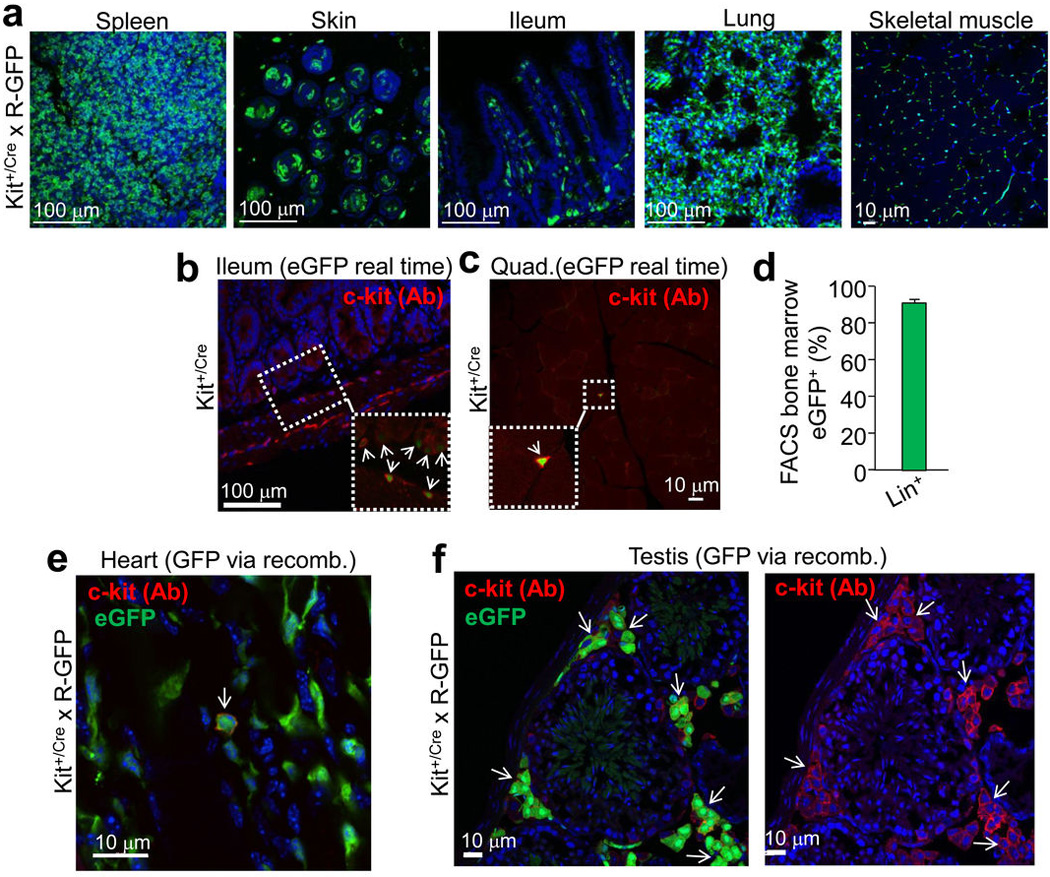
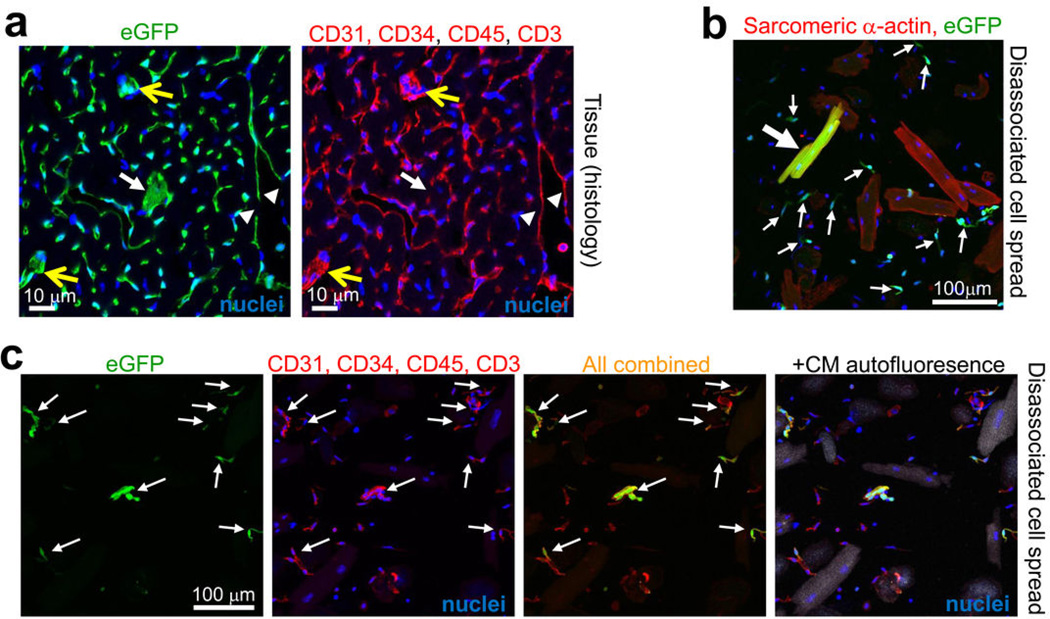
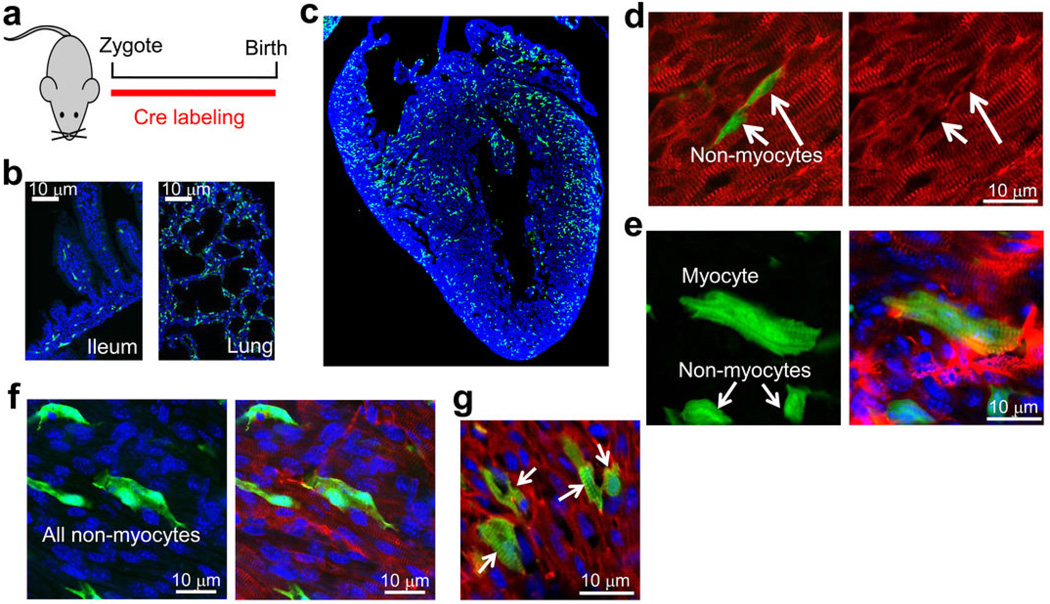
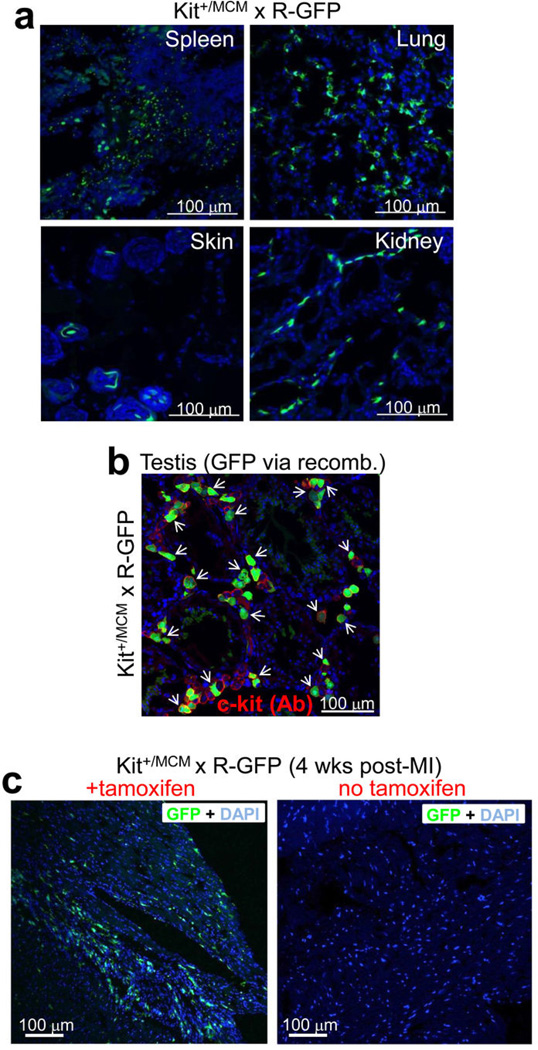
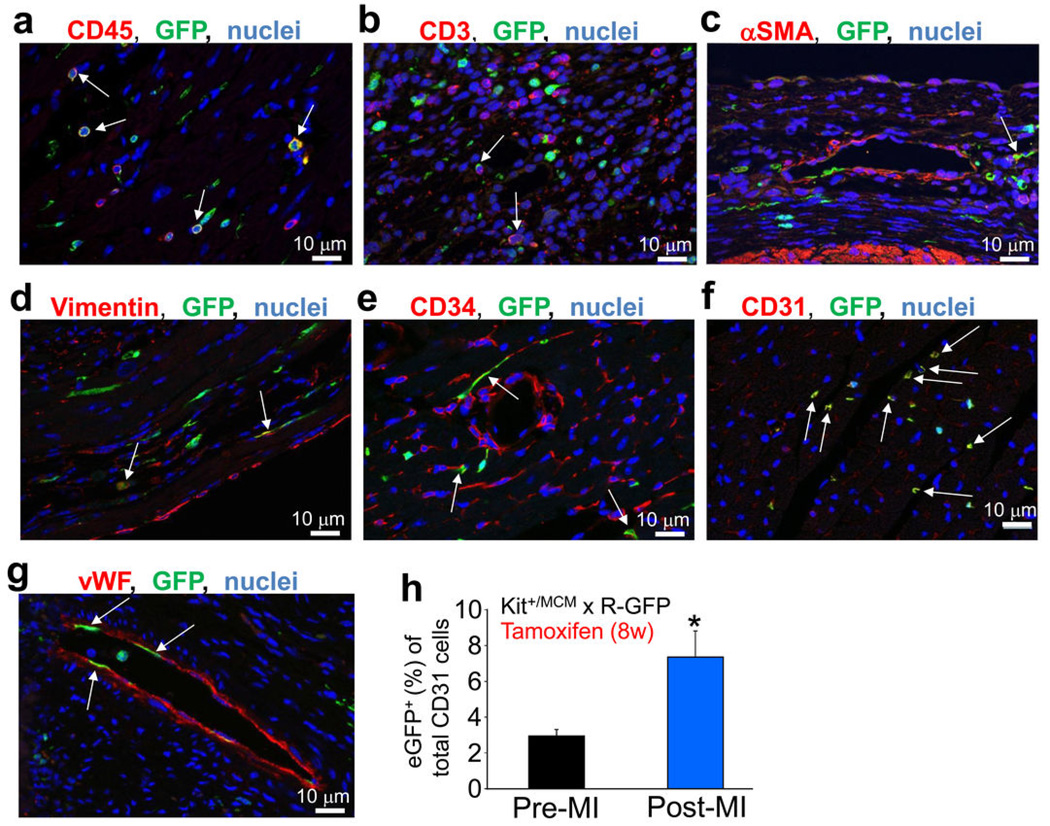
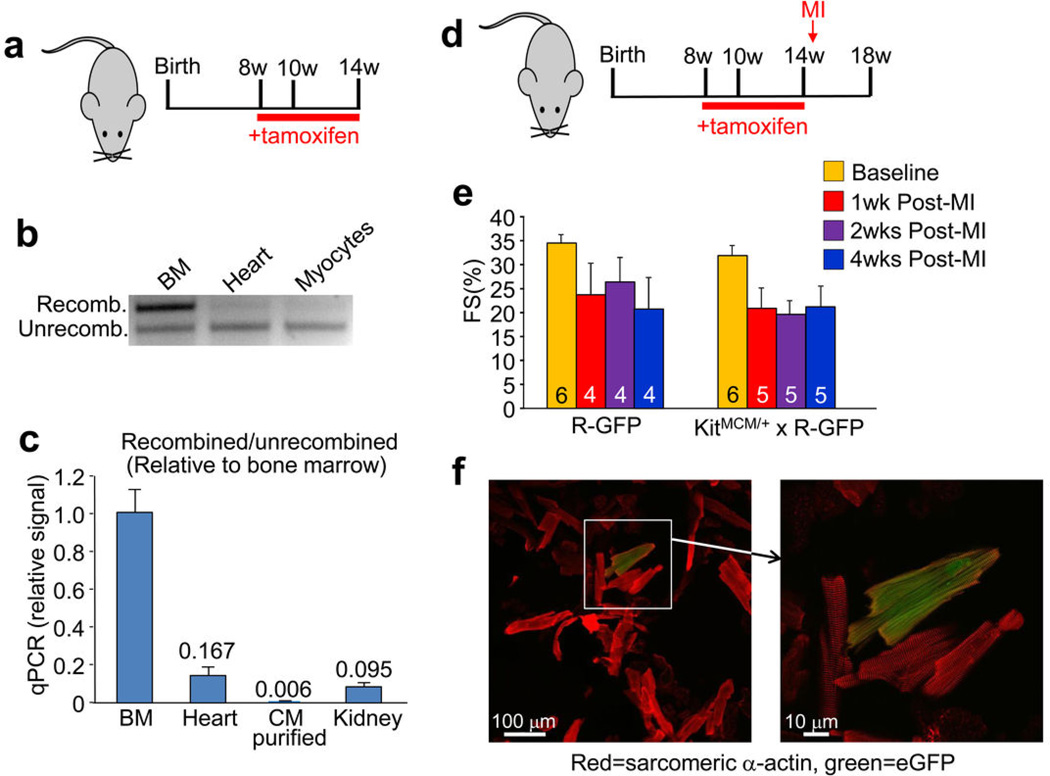
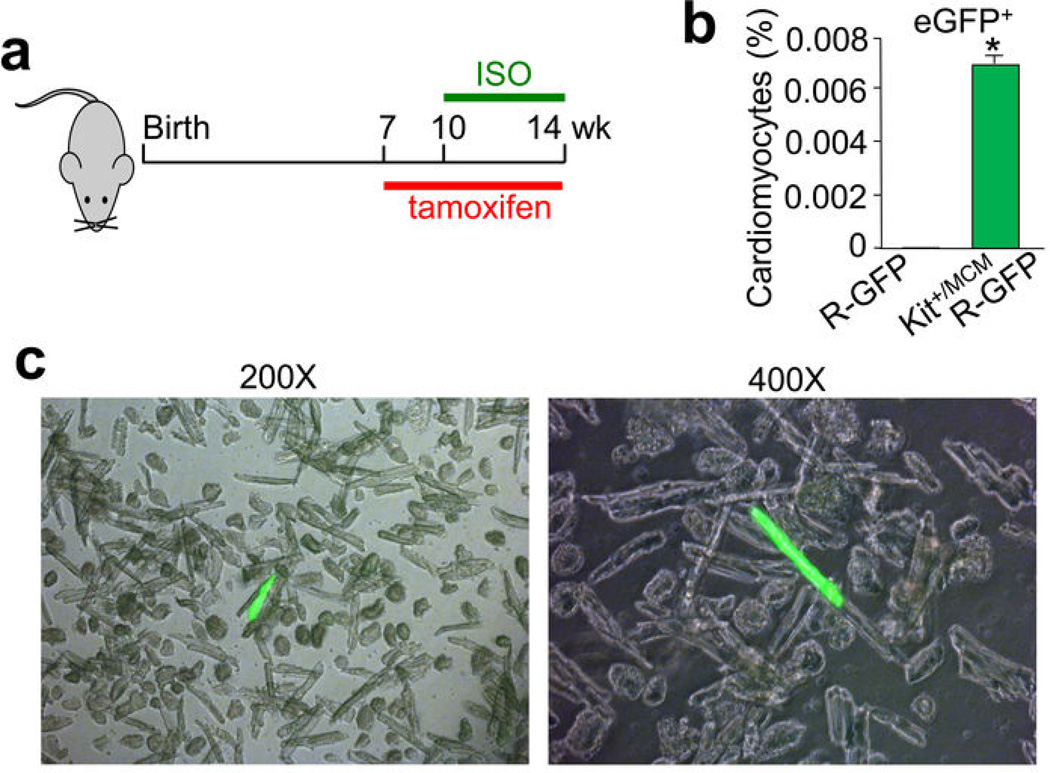
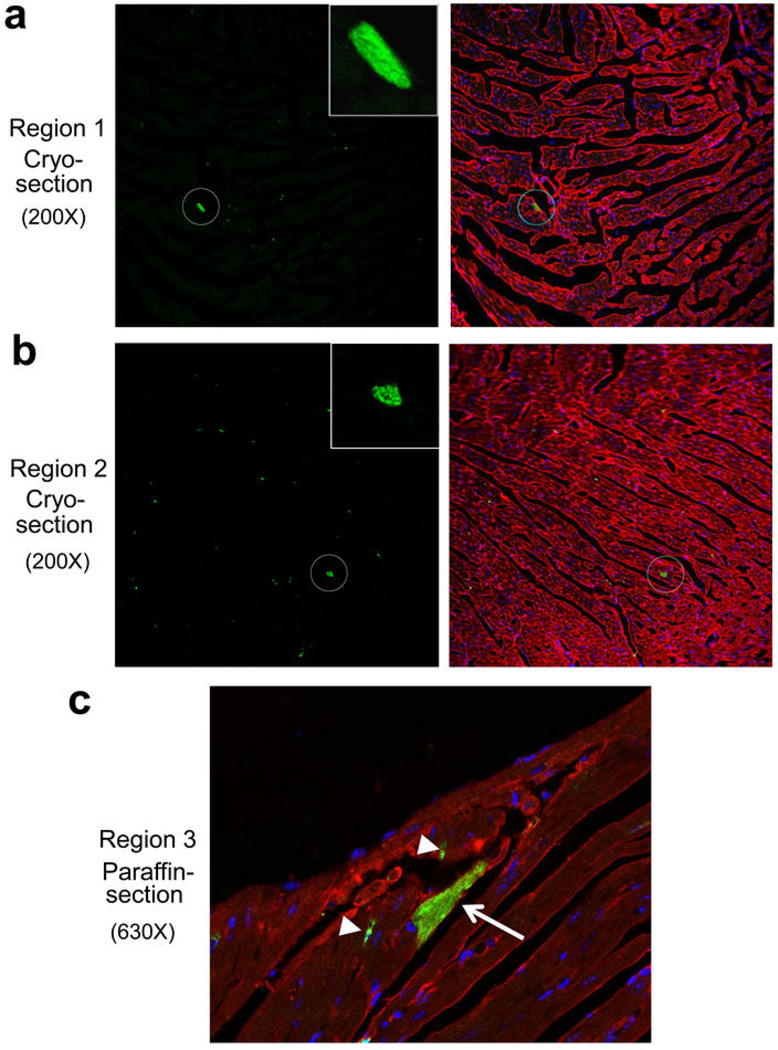
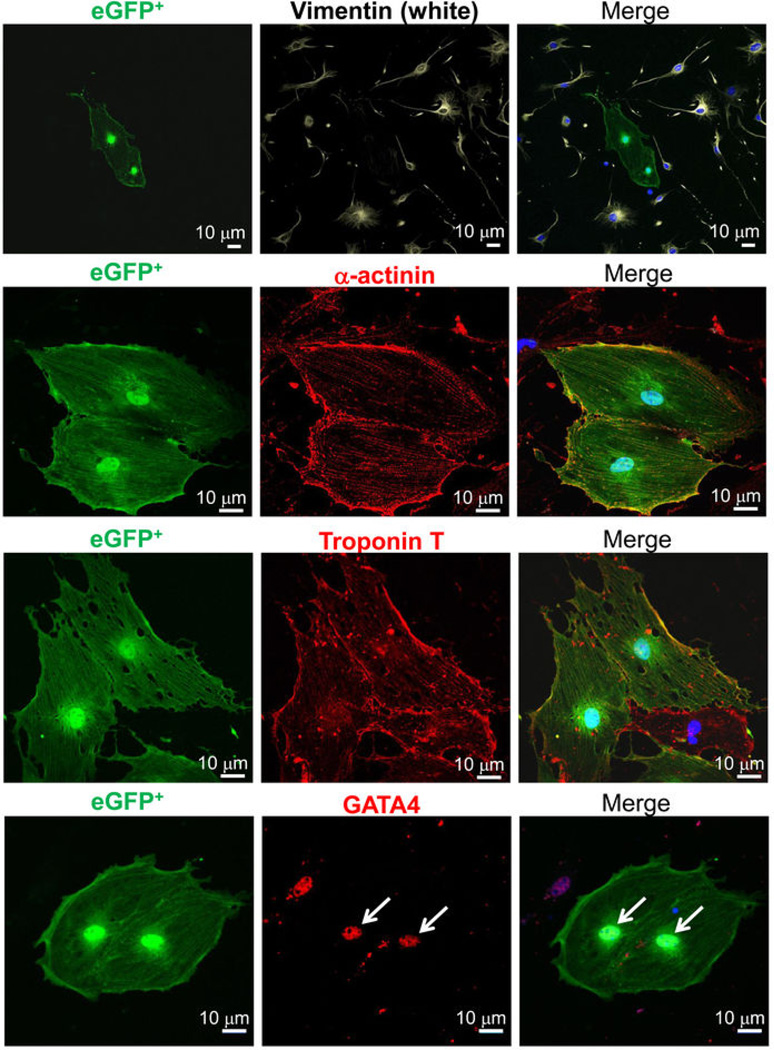
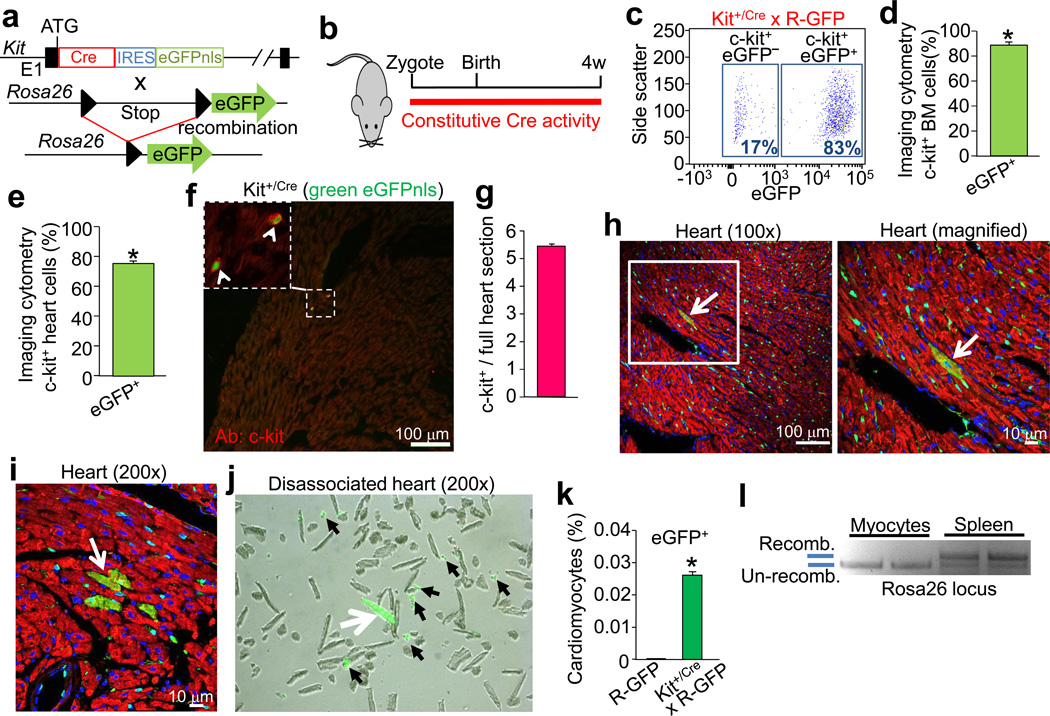
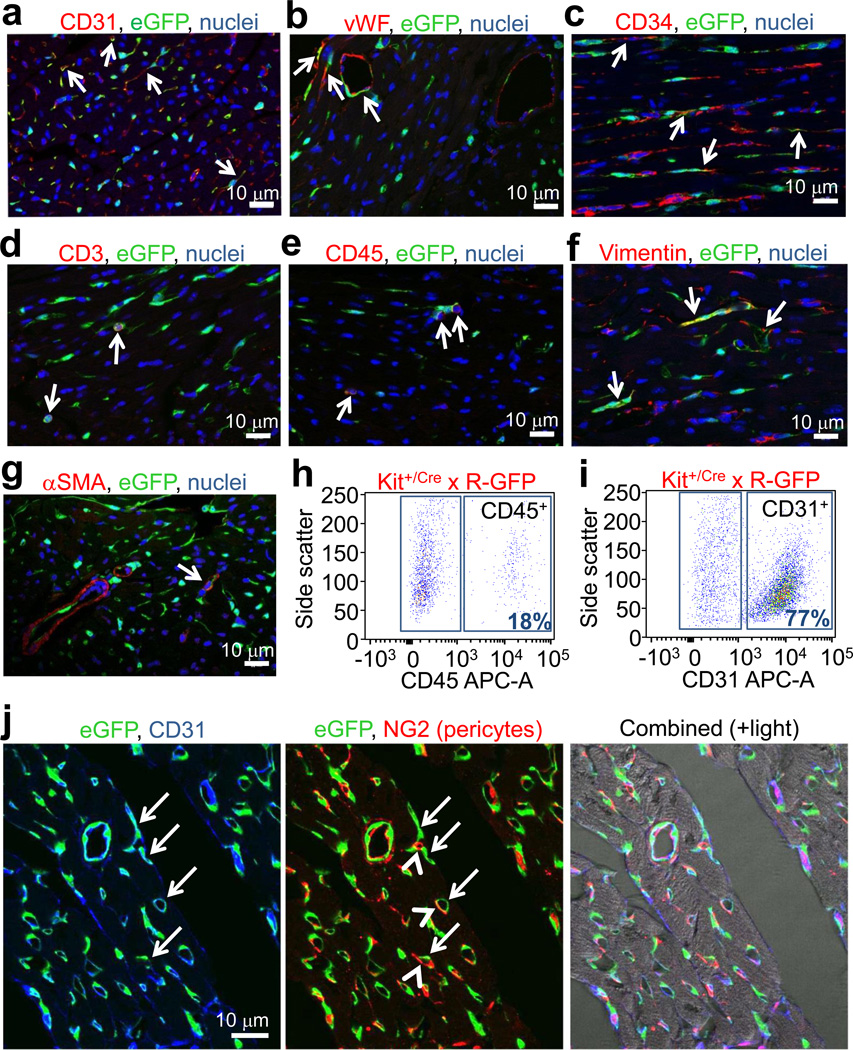
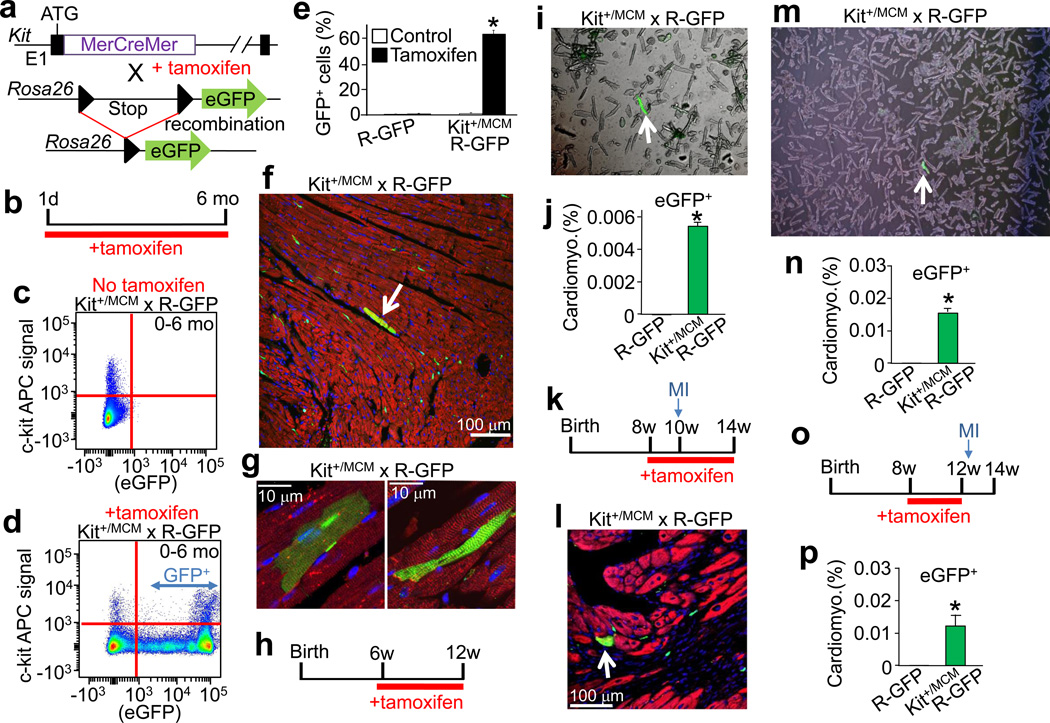
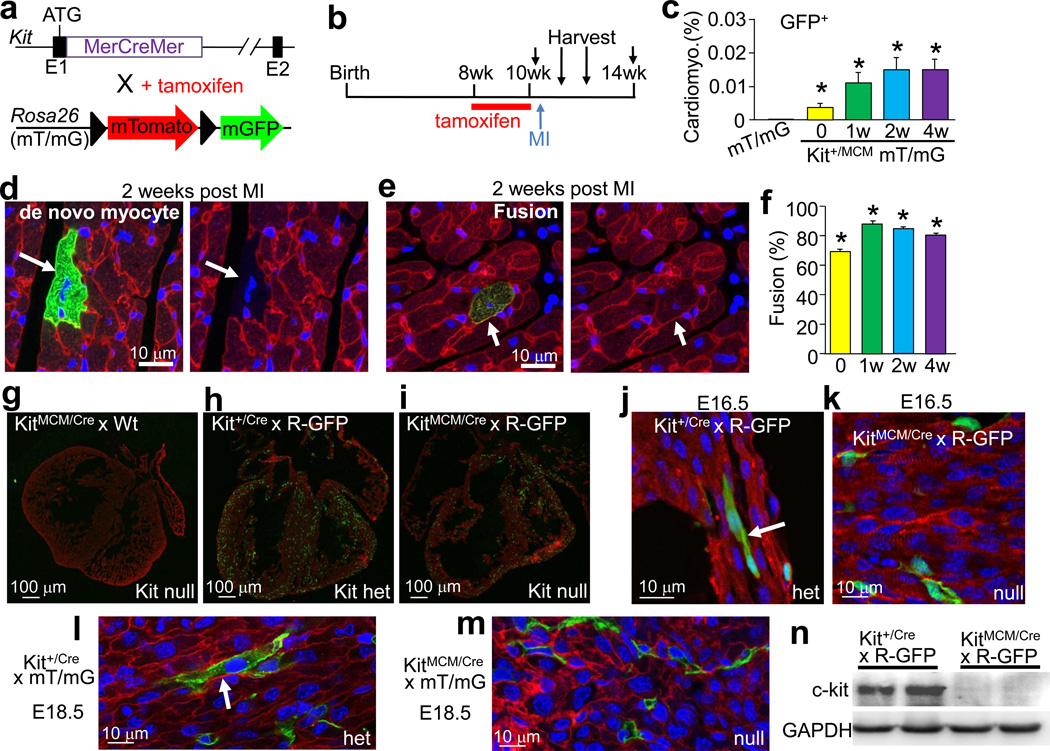
If and how the heart regenerates after an injury event is highly debated. c-kit-expressing cardiac progenitor cells have been reported as the primary source for generation of new myocardium after injury. Here we generated two genetic approaches in mice to examine whether endogenous c-kit(+) cells contribute differentiated cardiomyocytes to the heart during development, with ageing or after injury in adulthood. A complementary DNA encoding either Cre recombinase or a tamoxifen-inducible MerCreMer chimaeric protein was targeted to the Kit locus in mice and then bred with reporter lines to permanently mark cell lineage. Endogenous c-kit(+) cells did produce new cardiomyocytes within the heart, although at a percentage of approximately 0.03 or less, and if a preponderance towards cellular fusion is considered, the percentage falls to below approximately 0.008. By contrast, c-kit(+) cells amply generated cardiac endothelial cells. Thus, endogenous c-kit(+) cells can generate cardiomyocytes within the heart, although probably at a functionally insignificant level.


Conflict of interest statement

Conflict of Interest or Competing Financial Interest:

None

Figures

Extended Data Figure 1
Extended Data Figure 1. Assessing the fidelity and specificity of the Kit-Cre knock-in allele
a, Histological sections from the indicated tissues of Kit+/Cre × R-GFP mice at 4 weeks of age. Blue is nuclei and green is eGFP. The data show eGFP expression in regions of each tissue that is often characteristic of endogenous c-kit protein expression. b, Immunohistochemistry for endogenous c-kit expression (red) in the mouse ileum at 4 weeks of age from Kit+/Cre mice that contain the IRES-eGFPnls cassette (but without the × R-GFP reporter allele) so that eGFP expression can be monitored in real time. The inset box and arrows show the co-staining with c-kit antibody and eGFP. c, Immunohistochemistry for endogenous c-kit expression (red) in quadriceps muscle of Kit+/Cre mice at 4 weeks of age versus nuclear eGFP (green) from the Kit+/Cre allele. While lineage tracing in Kit+/Cre × R-GFP mice, which is cumulative, showed abundant endothelial cells throughout the skeletal muscle (a), instantaneous c-kit expressing cells are rare in skeletal muscle, and when identified, are always mononuclear (inset box). d, FACS quantitation of bone marrow from Kit+/Cre × R-GFP mice at 4 weeks of age sorted for eGFP expression, of which 94% are positive for the “lineage” cocktail of differentiation-specific antibodies (n=3 mice). Hence the Kit-Cre allele is properly expressed in bone marrow and traces lineages that arise from c-kit+ progenitors. e, Immunohistochemistry in the hearts of Kit+/Cre × R-GFP mice for endogenous c-kit expression (red) versus all the cells that underwent recombination throughout development and the first 4 weeks of life, shown in green. While cells that are actively expressing c-kit protein are very rare in the heart (≈5 per heart section), the arrow shows such a cell that is also eGFP+ for recombination. All of the currently c-kit expressing cells identified in the heart were eGFP+, further verifying the fidelity of the Kit-Cre allele. f, Same experiment as in e except the testis was examined because of the characteristic pattern of Leydig cells that are known to be actively c-kit expressing cells. The data show that greater than 80% of the currently c-kit antibody reactive Leydig cells (red outline, better observed in the right panel) are also eGFP+ (arrows show clusters of these cells).
Extended Data Figure 2
Extended Data Figure 2. Identification of non-myocytes from the hearts of Kit+/Cre × R-GFP mice
Kit+/Cre × R-GFP mice were harvested at 6 weeks of age (constitutive lineage labeling the entire time), although MI was performed at week 4 to induce greater vascular remodeling and potentially more c-kit lineage recruitment over the next 2 weeks. a, Hearts were then collected at week 6 and subjected to immunohistochemistry with a pool of antibodies for CD31, CD34, CD45 and CD3 in red, while the green channel was for eGFP expression from the recombined R-GFP reporter allele due to Kit-Cre lineage expression. The white arrowheads show endothelial cells that are not contiguous with the underlying network, although most of the endothelial cells are from the c-kit lineage when the red and green channels are compared. The white arrow shows a cardiomyocyte that lacks red staining, while the yellow arrows show 2 areas with relatively large cells that are eGFP+ and could be mistaken for a cardiomyocyte, although they are also positive for the non-myocyte marker panel of antibodies. b, c, Spread of cells isolated from hearts of 8 week-old Kit+/Cre × R-GFP mice at baseline that were subjected to immunocytochemistry for the indicated markers. The large white arrow in panel b shows an eGFP+ (green) cardiomyocyte that also co-stains with sarcomeric α-actin (red). The smaller arrows show eGFP+ non-myocytes, which in panel c, were subject to staining with a cocktail of antibodies again for CD31, CD34, CD45 and CD3 (all in red). This analysis identifies nearly all of the non-myocytes in these cell spreads. The very last image in panel c shows a fourth channel with higher gain so that the underlying cardiomyocytes (CMs) autofluoresce (in white) to show the mixed nature of the spread cells. Nuclei were stained blue with DAPI in the indicated panels.
Extended Data Figure 3
Extended Data Figure 3. Analysis of c-kit lineage labeling in the heart at P0 (birth)
a, Diagram of the timing whereby newborn Kit+/Cre × R-GFP mice were analyzed for all subsequent experiments in this figure. b, Histological sections for eGFP fluorescence (green) from the ileum and lung at P0 showing the characteristic c-kit labeling pattern as observed at other time points or in other studies when antibodies were employed. Blue shows nuclei c, Histological section for eGFP fluorescence (green) from the heart at P0. Blue shows nuclei and magnification was 40X. d, Immunohistochemical tissue section from the P0 heart of Kit+/Cre × R-GFP mice stained with sarcomeric α-actin (red) to show all underlying cardiomyocytes (right panel) or with eGFP expression in green (left panel) as being c-kit derived. The green cells noted by the arrows are non-myocytes that do not express sarcomeric α-actin. e, eGFP expression alone (left) or eGFP with co-staining for cardiomyocytes in red (sarcomeric α-actin) from heart sections at P0 of Kit+/Cre × R-GFP mice. Blue staining depicts nuclei. The cardiomyocyte that is shown has clear striations in the eGFP staining pattern, while the 2 non-myocytes do not show striated eGFP and also lack sarcomeric α-actin staining. f, eGFP expression alone in green (left) with nuclei in blue or eGFP with sarcomeric α-actin co-staining (red) from heart sections at P0 of Kit+/Cre × R-GFP mice. All eGFP+ cells shown lack striations and are non-myocytes although the 2 cells in the center sit directly on top of cardiomyocytes and could be easily mis-interpreted. Great care is needed in scoring myocytes in the P0 heart because they are small and often the same size as eGFP+ non-myocytes. g, eGFP expression (green) with nuclei in blue and cardiomyocytes identified in red with sarcomeric α-actin antibody from heart histological sections at P0 of Kit+/Cre × R-GFP mice. Here the data show c-kit lineage derived cardiomyocytes that appear in a loose cluster (arrows), presumably from a clonal expansion event earlier in development.
Extended Data Figure 4
Extended Data Figure 4. Additional examination of the Kit-MerCreMer knock-in allele and its potential leakiness in the absence of tamoxifen
a, Histological analysis of eGFP fluorescent cells from the indicated tissues at day 28 from Kit+/MCM × R-GFP mice that were given tamoxifen from 2 to 28 days. Nuclei are shown in blue and green shows eGFP fluorescing cells in the expected patterns for known regions of c-kit protein expression, such as the distinct pattern of melanocytes in the skin and widespread expression in the spleen and lungs. b, Immunohistochemistry in the testis of Kit+/MCM × R-GFP mice for endogenous c-kit expression (red) versus cells that underwent recombination when tamoxifen was given by intraperitoneal injection (2 mg) for 5 consecutive days (green). The data show that most of the currently c-kit protein expressing cells in testis (only Leydig cells react, red surface staining) are also eGFP+ (intracellular), indicating that recombination only occurs in c-kit expressing cells, and the majority of them. c, Histological sections through the heart showing that the Kit-MerCreMer allele does not leak at baseline or after MI injury (n=3 mice per treatment). Kit+/MCM × R-GFP mice were placed on tamoxifen-laden food or vehicle food beginning at 4 weeks of age and then subjected to MI injury 4 weeks later, followed by harvesting 4 weeks after that. In the presence of tamoxifen histological sections through the MI border zone of the heart show wide-spread eGFP+ cells (green) from the c-kit lineage (left panel), while in the absence of tamoxifen no eGFP+ cells are observed (right panel), hence the Kit-MerCreMer allele does not leak.
Extended Data Figure 5
Extended Data Figure 5. Analysis of eGFP+ non-myocytes in the hearts of Kit+/MCM × R-GFP mice at baseline or after MI injury
a–g,Tamoxifen was given to Kit+/MCM × R-GFP mice for 1 day – 6 months of age (a,e,f) or in mice given tamoxifen and MI injury (b,c,d,g), followed by harvesting the hearts for immunohistochemistry with antibodies for GFP (green), or the indicated antibodies in red; (a) CD45, (b) CD3, (c) smooth muscle α-actin (αSMA), (d) vimentin, (e) CD34, (f) CD31, (g) von Willebrand factor (vWF). Nuclei are shown in blue. The white arrows show cells with coincident green and red reactivity for each of the markers, although sometimes the red marker is membrane localized while the green (eGFP) is always cytoplasmic. The most overlapping activity with GFP expression was observed for CD31 (endothelial cells), then CD34, followed by CD45 (hematopoietic cells). h, Quantitation from FACS plots of total CD31 cells (antibody) in the heart that are also eGFP+ from Kit+/MCM × R-GFP mice (Pre-MI, n=3) after 8 weeks of tamoxifen in early adulthood at either baseline or 4 weeks after MI injury (Post-MI, n=3). The data show about a doubling in the number of CD31 cells that are eGFP+ after MI (*P<0.05 vs pre-MI).
Extended Data Figure 6
Extended Data Figure 6. Quantitation of Cre activity and DNA recombination in the hearts of Kit+/MCM × R-GFP mice
a, Time line for tamoxifen administration in Kit+/MCM × R-GFP mice. b, PCR from DNA generated from the bone marrow (BM), whole heart or semi-purified cardiomyocytes after 6 weeks of tamoxifen treatment in Kit+/MCM × R-GFP mice (n=2). Bone marrow shows most of the DNA as having been recombined by Cre, while whole heart is just barely discernable, and purified cardiomyocytes show essentially no recombination given the sensitivity constraints of this assay. c, qPCR was also run to more sensitively detect and quantify the extent of recombination, which was set relative to the recombination in bone marrow. Semi-purified cardiomyocytes (CM) showed very low rates. Averaged data are shown and error bars are s.e.m. of duplicate technical replicates from n=3 Kit+/MCM × R-GFP mice. d, Schematic of the tamoxifen time course and timing of myocardial infarction (MI) in Kit+/MCM × R-GFP mice. e, Echocardiography measured cardiac fractional shortening (FS%) was assessed in the mice after MI, which shows a reduction in cardiac ventricular performance at 1, 2 and 4 weeks after injury. The number of mice analyzed is shown in the bars. Error bars represent the s.e.m. Both the control and experimental groups showed an equivalent reduction in cardiac function post-MI. f, Images of dissociated cardiomyocytes from hearts of Kit+/MCM × R-GFP mice 4 weeks after MI, which were fixed and stained for sarcomeric α-actin antibody (red) and eGFP (green) at 2 different magnifications. One eGFP+ cardiomyocyte is shown with sarcomeric patterning of the eGFP fluorescence.
Extended Data Figure 7
Extended Data Figure 7. Analysis of eGFP+ myocytes in the hearts of Kit+/MCM × R-GFP mice after isoproterenol infusion-induced injury
a, Schematic diagram showing tamoxifen treatment of Kit+/MCM × R-GFP mice between 7 and 14 weeks of age with isoproterenol (ISO) infusion occurring between weeks 10–14. b, c, Quantitation and imaging of disassociated cardiomyocytes (separate images shown at 2 different magnifications) from the hearts of ISO injured Kit+/MCM × R-GFP mice, which showed rare but definitive cardiomyocyte labeling. *P<0.05 vs R-GFP, 31 eGFP+ cells of 395,302 counted from 2 hearts.
Extended Data Figure 8
Extended Data Figure 8. Verifying the extent of eGFP+ cardiomyocytes by an independent laboratory from blinded histological heart samples
Unprocessed cryosections and paraffin sections from the hearts of Kit+/MCM × R-GFP mice after 8 weeks of tamoxifen were blinded and sent to the Marbán laboratory along with negative control sections from hearts that should not have staining. a, b, Two separate images from cryo-preserved blocks are shown at 200x magnification in which the cryo-section was processed for eGFP fluorescence (green) and α-actinin antibody (red) to show cardiomyocytes. The data show 2 regions where a single eGFP+ myocyte is visible in a region with several hundred GFP-negative cardiomyocytes. The single eGFP+ cardiomyocyte is circled and the inset box shows a higher magnification. Sections were also stained for nuclei (blue). In general, approximately 1–2 definitive eGFP+ cardiomyocytes were identified per entire heart section in the Marbán laboratory, a result that is consistent with the approximate numbers of kit lineage-labeled cardiomyocytes observed by us. c, Image taken at 630x magnification from a paraffin embedded and processed histological section in which both an eGFP antibody (green) and α-actinin antibody (red) was used. Nuclei are shown in blue. The arrow shows a single eGFP+ expressing cardiomyocyte and the arrowheads show eGFP+ non-myocytes.
Extended Data Figure 9
Extended Data Figure 9. Assessing cardiomyocyte differentiation markers from total non-myocytes in the heart
Adult cardiac interstitial cells isolated from a Kit+/Cre × R-GFP mouse were treated with dexamethasone for 1 week. Cells were then fixed and subjected to immunocytochemistry for the indicated antibodies. c-kit lineage derived cells were green (eGFP+) and showed fluorescence in the cytosol and nucleus. The data show eGFP cells that express markers of differentiated cardiomyocytes such as α-actinin, troponin T, and the transcription factor GATA4 (all in red) but not the fibroblast marker vimentin (white), nuclei were stained blue (right panels). These results indicate that eGFP+ Kit-Cre expressing cells can generate pre-differentiated cardiomyocytes as well as non-eGFP interstitial cells; hence the cells identified by the Kit-Cre (knock-in) reporter strategy are representative of how endogenous c-kit+ expressing cells truly function.
Figure 1
Figure 1. Kit-Cre lineage tracing
a, The Kit locus was targeted in mice to express Cre recombinase and eGFP with a nuclear localization sequence (eGFPnls) from an internal ribosome entry site (IRES). These mice were crossed with Rosa26 reporter mice (R-GFP) for lineage tracing. b, Diagram of mice used for all experimentation in this figure. c, Representative flow cytometry (FACS) plot of bone marrow from Kit+/Cre × R-GFP mice gated for c-kit antibody, then eGFP fluorescence to reflect recombination of the R-GFP locus (representative of n=6 total). d, Direct imaging cytometry analysis of eGFP expression in bone marrow (n=3, *P<0.05 vs R-GFP). e, same quantitative imaging cytometry analysis as in d except the non-myocytes were isolated from hearts of Kit+/Cre × R-GFP mice (n=3 hearts, *P<0.05 vs R-GFP). f, Immunohistochemistry to show current expression from the Kit-Cre allele (green, eGFPnls) versus endogenous c-kit protein detected by antibody (red). The inset box shows 2 mononuclear c-kit expressing cells. g, Quantitation of average number of c-kit+ cells per longitudinal heart section (n=4 hearts) h, Representative histological section at 2 magnifications (white box) of a Kit+/Cre × R-GFP mouse heart with desmin antibody in red, eGFP antibody in green, and nuclei in blue. The arrow shows an eGFP+ cardiomyocyte. i, Immunohistological image showing a rare area of cardiomyocyte clonal expansion (arrow). j, Image of cells disassociated from the hearts of Kit+/Cre × R-GFP mice. White arrow shows a rare eGFP fluorescing cardiomyocyte, while the black arrowheads show eGFP fluorescent non-myocytes. k, Quantitation of eGFP+ fluorescent cardiomyocytes (81 from 303,264 total cardiomyocytes, 3 hearts,*P<0.05 vs R-GFP). l, DNA electrophoresis after PCR showing Cre-mediated Rosa26 locus recombination in semi-purified cardiomyocytes and spleen (n=2 each). All error bars represent s.e.m.
Figure 2
Figure 2
Analysis of cardiac cells from Kit+/Cre × R-GFP mice. a, b, c, d, e, f, g, Immunofluorescent images of heart histological sections from Kit+/Cre × R-GFP mice at 4 weeks of age stained with eGFP antibody (green), nuclei in blue and either CD31, von Willebrand factor (vWF), CD34, CD3, CD45, vimentin or smooth muscle α-actin (αSMA) in red. Arrows show cells with overlap in staining. h, i, FACS plot showing lineage markers of heart isolated c-kit derived eGFP+ cells for CD45 (h) and CD31 (i) (representative of n=6 for CD45 at 4 weeks of age, and n=3 for CD31 at 12 weeks of age). j, Immunofluorescent image from heart histological section of a Kit+/Cre × R-GFP mouse at 4 weeks for eGFP fluorescence (green), CD31 antibody staining (blue) and NG2 antibody staining (red). Right panel shows composite with transmitted light.
Figure 3
Figure 3. Inducible Cre expression from the Kit locus shows limited adult cardiomyocyte formation
a, Genetic cross between Kit+/MCM and R-GFP reporter mice to lineage trace c-kit expressing cells when tamoxifen is present. b, Schematic showing tamoxifen treatment between day 1 and 6 months of age (panels c–g). c, d, Representative FACS plots with c-kit antibody (APC) vs eGFP from bone marrow of Kit+/MCM × R-GFP mice without (c) or with tamoxifen (d). e, FACS quantification of eGFP+ cells from bone marrow of these mice (n=2 mice for R-GFP and n=4 for Kit+/MCM × R-GFP). *p<0.05 vs R-GFP. f, g, Representative heart sections from Kit+MCM × R-GFP mice showing c-kit+ lineage cells in green and cardiomyocytes in red (desmin antibody). White arrow indicates eGFP+ adult cardiomyocyte. h,i,j, Tamoxifen treatment of Kit+/MCM × R-GFP mice between 6 – 12 weeks of age followed by disassociation of cells from the hearts of these mice in h (white arrow shows rare cardiomyocyte) that is quantified in j (127,284 cardiomyocytes across 2 hearts, 7 were eGFP+,*P<0.05 vs R-GFP). k,l,m,n, Tamoxifen treatment of Kit+MCM × R-GFP mice between 8 and 14 weeks of age with myocardial infarction (MI) on week 10. l, Immunohistological heart section for desmin (red) and eGFP (green) with nuclei in blue (arrow shows a cardiomyocyte from the c-kit+ lineage). m, n, Disassociated cardiomyocytes show rare but definitive myocyte labeling (white arrow), which was quantified in n (225,760 cardiomyocytes from 2 MI hearts, 37 were eGFP+,*P<0.05 vs R-GFP). o,p, Tamoxifen treatment between 8 – 12 weeks of age with MI injury occurring 3 days after tamoxifen cessation. p, Quantitation of eGFP+ cardiomyocytes from histological images taken from 2 hearts of these mice. eGFP+ cardiomyocytes were quantified as a percentage of the total cardiomyocyte fraction in >50 histological sections across the entire heart. *P<0.05 vs R-GFP. All error bars represent s.e.m.
Figure 4
Figure 4
Assessment of fusion versus de novo cardiomyocyte formation in the heart. a, Genetic strategy in which Kit+/MCM mice were crossed with Rosa26 targeted mice containing the membrane targeted tdTomato/eGFP (mT/mG) reporter. b,c,d,e,f, Tamoxifen was given to Kit+MCM × mT/mG mice between 8 and 10 weeks, followed 3 days later by MI injury. c, Quantitation across >50 histological sections of all eGFP+ expressing cardiomyocytes before MI (n=4 hearts) and 1 (n=4 hearts), 2 (n=5 hearts) and 4 (n=3 hearts) weeks after MI injury. Error bars represent s.e.m., *P<0.05 vs mT/mG. d, Example of a c-kit lineage derived de novo cardiomyocyte in which membrane-eGFP (green, left) is expressed and tdTomato fluorescence (red, right) is lost. e, Example of eGFP+ cardiomyocyte (green) that still contains endogenous membrane-tdTomato fluorescence (red), indicating fusion. Nuclei are stained blue. f, Quantitation of fusion percentage. *P<0.05 vs mT/mG. g, h, i, Immunohistological images from embryonic (E) day 16.5 mouse hearts that are either Kit+/Cre × R-GFP (het [h]), KitMCM/Cre × R-GFP (null, [i]) or KitMCM/Cre (null, no reporter, [g]). Red staining is α-actinin and green is eGFP. j, Higher magnification image from h, showing a definitive eGFP+ cardiomyocyte (arrow). k, Higher magnification image from i, which shows only eGFP+ non-myocytes in Kit null hearts. l, m, Histological heart images from E18.5 Kit+/Cre (het) and KitMCM/Cre (null) embryos containing the mT/mG reporter, again only the heterozygotes show examples of eGFP+ cardiomyocytes (arrow). n, Western blot showing loss of c-kit protein in KitMCM/Cre embryos (nulls) versus heterozygous controls.

Comment in

References

    1. Laflamme MA, Murry CE. Heart regeneration. Nature. 2011;473:326–335. - PMC - PubMed
    1. Orlic D, et al. Bone marrow cells regenerate infarcted myocardium. Nature. 2001;410:701–705. - PubMed
    1. Balsam LB, et al. Haematopoietic stem cells adopt mature haematopoietic fates in ischaemic myocardium. Nature. 2004;428:668–673. - PubMed
    1. Murry CE, et al. Haematopoietic stem cells do not transdifferentiate into cardiac myocytes in myocardial infarcts. Nature. 2004;428:664–668. - PubMed
    1. Anversa P, Kajstura J, Rota M, Leri A. Regenerating new heart with stem cells. J Clin Invest. 2013;123:62–70. - PMC - PubMed

Additional references

    1. Nagy A, Rossant J. In: Gene Targeting:A Practical Approach. 2 edition. Joyner Alexandra L., editor. Oxford University Press, USA; 2000.
    1. Liu Q, Sargent MA, York AJ, Molkentin JD. ASK1 regulates cardiomyocyte death but not hypertrophy in transgenic mice. Circ Res. 2009;105:1110–1117. - PMC - PubMed
    1. Nakayama H, et al. alpha1G-dependent T-type Ca2+ current antagonizes cardiac hypertrophy through a NOS3-dependent mechanism in mice. J Clin Invest. 2009;119:3787–3796. - PMC - PubMed
    1. Hosoda T, et al. Clonality of mouse and human cardiomyogenesis in vivo. Proc Natl Acad Sci U S A. 2009;106:17169–17174. - PMC - PubMed
    1. Karch J, et al. Bax and Bak function as the outer membrane component of the mitochondrial permeability pore in regulating necrotic cell death in mice. Elife. 2013;2:e00772. - PMC - PubMed

Publication types

MeSH terms