. 2014 May 7;9(5):e96655.
doi: 10.1371/journal.pone.0096655. eCollection 2014.

Transmural intestinal wall permeability in severe ischemia after enteral protease inhibition

Affiliations

Transmural intestinal wall permeability in severe ischemia after enteral protease inhibition

Angelina E Altshuler et al. PLoS One. .

Abstract

In intestinal ischemia, inflammatory mediators in the small intestine's lumen such as food byproducts, bacteria, and digestive enzymes leak into the peritoneal space, lymph, and circulation, but the mechanisms by which the intestinal wall permeability initially increases are not well defined. We hypothesize that wall protease activity (independent of luminal proteases) and apoptosis contribute to the increased transmural permeability of the intestine's wall in an acutely ischemic small intestine. To model intestinal ischemia, the proximal jejunum to the distal ileum in the rat was excised, the lumen was rapidly flushed with saline to remove luminal contents, sectioned into equal length segments, and filled with a tracer (fluorescein) in saline, glucose, or protease inhibitors. The transmural fluorescein transport was determined over 2 hours. Villi structure and epithelial junctional proteins were analyzed. After ischemia, there was increased transmural permeability, loss of villi structure, and destruction of epithelial proteins. Supplementation with luminal glucose preserved the epithelium and significantly attenuated permeability and villi damage. Matrix metalloproteinase (MMP) inhibitors (doxycycline, GM 6001), and serine protease inhibitor (tranexamic acid) in the lumen, significantly reduced the fluorescein transport compared to saline for 90 min of ischemia. Based on these results, we tested in an in-vivo model of hemorrhagic shock (90 min 30 mmHg, 3 hours observation) for intestinal lesion formation. Single enteral interventions (saline, glucose, tranexamic acid) did not prevent intestinal lesions, while the combination of enteral glucose and tranexamic acid prevented lesion formation after hemorrhagic shock. The results suggest that apoptotic and protease mediated breakdown cause increased permeability and damage to the intestinal wall. Metabolic support in the lumen of an ischemic intestine with glucose reduces the transport from the lumen across the wall and enteral proteolytic inhibition attenuates tissue breakdown. These combined interventions ameliorate lesion formation in the small intestine after hemorrhagic shock.


Conflict of interest statement

Competing Interests: The authors have read the journal's policy and have the following conflicts: Dr. Geert Schmid-Schönbein and Dr. Angelina Altshuler are scientific advisors to Leading BioSciences Inc., San Diego, which was issued licenses from University of California, San Diego for shock treatment. Dr. Geert Schmid-Schönbein owns stock in Leading Biosceinces. This does not alter the authors' adherence to all the PLOS ONE policies on sharing data and materials.

Figures

Figure 1
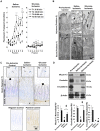
Figure 1. Fluorescein transport and tissue degradation in saline and glucose treated intestines after severe ischemia.
The intestinal lumen was flushed of all food contents and digestive enzymes. (A) Fluorescent tracer transport rates across the wall of ischemic intestinal segments located along the length of the small intestine from the proximal jejunum (position 1) to the distal ileum (position 8). The fluorescein transport rates were computed as amount (nM) of fluorescein accumulating outside of the intestinal wall over 30 min time intervals. The intestinal segments were enterally filled with fluorescein in saline without and with glucose before ischemia began. p<0.05 by 2-way ANOVA, with Tukey post hoc test significance compared to Position 2 marked by ++ (during time interval T2), * (T3), ** (T4). p<0.05 by Tukey post hoc test compared to T1 shown by † (T2), ‡ (T3) and § (T4). (B) Intestinal wall morphology in the jejunum (top) and ileum (bottom) as seen on frozen sections after Van Gieson and hematoxylin labeling. Black arrows indicate intact villi structure that best matched the structure of the pre-ischemic tissue, white arrow shows separation between the lamina propria and the mucosal epithelial layer, (*) indicates sites of damaged villi, and (§) specifies internal damage to the villi. (C) TUNEL labeling of pre-ischemic control, saline, and glucose intestine segment and the tips. Black arrows point to intact villi. Brown stained nuclei indicate TUNEL-positive cells (brown arrows) while blue labeled nuclei indicate negative labeling (blue arrows). Positive and negative controls depict brown and blue stained nuclei, respectively. * indicates TUNEL positive cells in the muscularis. (D) Immunoblots of epithelial bound mucin 13, occludin, and E-cadherin. *, p<0.05 vs. pre-ischemic control tissues and ‡ compared to saline tissues by one way ANOVA with Tukey post hoc. N = 6 rats/group for saline and N = 5 rats/group for glucose. Mean±SEM.
Figure 2
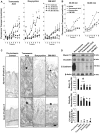
Figure 2. Protease activity in intestinal homogenates.
(A) Gelatin gel zymographies showing protease activity in the pre-ischemic jejunum (segment 2) and ileum (segment 7), with and without renaturation in tranexamic acid. (B) Quantification of bands by densitometry. *, p<0.01 by paired t-test between jejunum vs. ileum. §, p<0.01 by paired t-test between No Inhibition and Tranexamic Acid (20 mM) renaturing. N = 4/group. Mean±SEM.
Figure 3
Figure 3. MMP inhibition and intestinal wall destruction during ischemia.
(A) Fluorescein transport across the wall of ischemic intestinal segments filled with tranexamic acid, or MMP inhibitors (doxycycline, GM 6001). p<0.05 by two way ANOVA with Tukey post hoc test significance compared to Position 2 shown by ** (during T4). Significant changes (p<0.05 by Tukey post hoc test) compared to T1 shown by ‡ (T3) and § (T4). N = 3 rats/group. (B) Third order polynomial fit to measured mean fluorescein rates at each position for either the 30–60 min or 60–90 min period for tranexamic acid, doxycycline, GM 6001 and saline groups to compare fluorescein transport at 30–60 and 60–90 min of severe ischemia. Adjusted R2 values are 0.87, 0.37, 0.81, and 0.71 for 30–60 min; 0.80, 0.89, 0.97, and 0.86 for 60–90 min for saline, tranexamic acid, doxycycline and GM 6001 curves, respectively. Comparison of curve fits for tranexamic acid, doxycycline or GM 6001 with those for saline by F-test, p = 5.6×10⁻⁴, 1.3×10⁻⁴ and 9.1×10⁻⁵ for 30–60 min; p = 6.5×10⁻³, 1.8×10⁻³ and 4.3×10⁻³ for 60–90 min. (C) Representative images of the intestinal villi. Arrows indicate intact villi structure and (*) indicates sites of damaged villi after ischemia. (D) Immunoblots of epithelial bound mucin 13, occludin, and E-cadherin. *p<0.05 vs. pre-ischemic control tissues and ‡ compared to saline-ischemic tissues by one way ANOVA with Tukey post hoc. N = 6 rats/group for pre-ischemic controls and tranexamic acid; N = 3 rats/group for doxycycline and GM-6001. Mean±SEM.
Figure 4
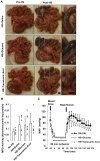
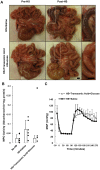
Figure 4. Glucose or tranexamic acid intervention in hemorrhagic shock.
(A) Gross morphology of the intestine in the rats before and after hemorrhagic shock. Lesions due to escape of red cells form in the HS+Saline animals and HS+Glucose treated animals (see magnified views) while the HS+Tranexamic Acid animals intestinal injury was in part reduced. (B) MPO activity measured in intestinal segments from segment 2, the region with the appearance of the most severe lesions, was elevated in all groups after hemorrhagic shock. “•” indicate individual data points for each animal. (C) Mean arterial pressure (MAP) of animals during the course of hemorrhagic shock. Data are presented as mean±SD. N = 6 rats/group for No-HS and HS+Saline; N = 7 rats/group for HS+Glucose and HS+Tranexamic Acid. Scale bar equals 5 mm. Mean±SD.
Figure 5
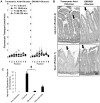
Figure 5. Tranexamic acid or GM 6001 combined with glucose fluorescein transport.
(A) Fluorescent tracer rates across the wall of ischemic intestinal segments filled with tranexamic acid+glucose or GM 6001+glucose in saline. N = 3 rats/group. (B) Representative micrographs of intestinal villi with tranexamic acid+glucose or GM 6001+glucose after ischemia. Black arrows indicate intact villi structure similar to the pre-ischemic control (Figure 1) and white arrows indicate points of separation between the lamina propria and the mucosal epithelial layer. (C) Separation between the lamina propria and the mucosal epithelial layer. *, p<0.0001 vs. pre-ischemic intestinal tissue. Refer to Figure 1B for images of pre-ischemic and glucose treated intestines. ‡, p<0.0001 for glucose vs. glucose+tranexamic acid. N = 3 rats/group. Mean±SEM.
Figure 6
Figure 6. Hemorrhagic shock with enteral tranexamic acid+glucose.
(A) Gross morphology of the intestine in rats before and after hemorrhagic shock. Lesions form in the HS+Saline animals but were reduced in the HS+Tranexamic Acid+Glucose treated animals (see magnified views). (B) MPO activity measured in intestinal segments from segment 2 trended to decrease in the HS+Tranexamic Acid+Glucose animals. “•” indicate individual data points for each animal and ‘x’ indicates an outlier. Bar graph shows mean±SD; outlier is excluded from the bar graph mean value in the HS+Tranexamic Acid+Glucose group. (C) Mean arterial pressure (MAP) of animals during the course of hemorrhagic shock. The MAP during the reperfusion period followed a linear trend for the HS+Saline animals. N = 6 rats/group for HS+Saline; N = 4 rats/group for HS+Tranexamic Acid+Glucose. Scale bar equals 5 mm. Mean±SD.

References

    1. Haglund U (1993) Systemic mediators released from the gut in critical illness. Crit Care Med 21: S15–8. - PubMed
    1. Haglund U (1994) Gut ischaemia. Gut 35: S73–6. - PMC - PubMed
    1. Hebra A, Brown MF, McGeehin K, Broussard D, Ross AJ 3rd (1993) The effects of ischemia and reperfusion on intestinal motility. J Pediatr Surg 28: 362–5 discussion 365–6. - PubMed
    1. Dauterive AH, Flancbaum L, Cox EF (1985) Blunt intestinal trauma. A modern-day review. Ann Surg 201: 198–203. - PMC - PubMed
    1. Ikeda H, Suzuki Y, Suzuki M, Koike M, Tamura J, et al. (1998) Apoptosis is a major mode of cell death caused by ischaemia and ischaemia/reperfusion injury to the rat intestinal epithelium. Gut 42: 530–537. - PMC - PubMed

Publication types

Substances