

Non-invasive prenatal detection of trisomy 13 using a single nucleotide polymorphism- and informatics-based approach
- PMID: 24805989
- PMCID: PMC4013011
- DOI: 10.1371/journal.pone.0096677
Non-invasive prenatal detection of trisomy 13 using a single nucleotide polymorphism- and informatics-based approach
Abstract
Purpose: To determine how a single nucleotide polymorphism (SNP)- and informatics-based non-invasive prenatal aneuploidy test performs in detecting trisomy 13.
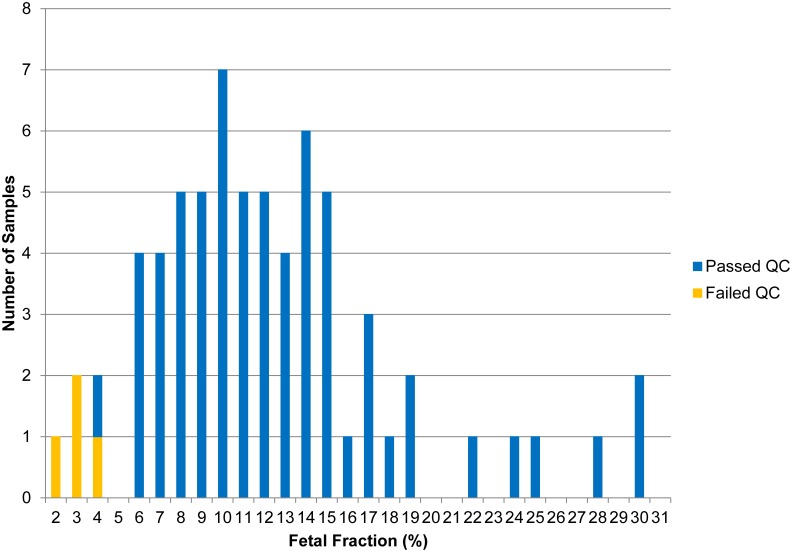
Methods: Seventeen trisomy 13 and 51 age-matched euploid samples, randomly selected from a larger cohort, were analyzed. Cell-free DNA was isolated from maternal plasma, amplified in a single multiplex polymerase chain reaction assay that interrogated 19,488 SNPs covering chromosomes 13, 18, 21, X, and Y, and sequenced. Analysis and copy number identification involved a Bayesian-based maximum likelihood statistical method that generated chromosome- and sample-specific calculated accuracies.
Results: Of the samples that passed a stringent DNA quality threshold (94.1%), the algorithm correctly identified 15/15 trisomy 13 and 49/49 euploid samples, for 320/320 correct copy number calls.
Conclusions: This informatics- and SNP-based method accurately detects trisomy 13-affected fetuses non-invasively and with high calculated accuracy.
Conflict of interest statement
Figures
Similar articles
-
SNP-based non-invasive prenatal testing detects sex chromosome aneuploidies with high accuracy.Prenat Diagn. 2013 Jul;33(7):643-9. doi: 10.1002/pd.4159. Epub 2013 Jun 20. Prenat Diagn. 2013. PMID: 23712453 Free PMC article.
-
Single-nucleotide polymorphism-based noninvasive prenatal screening in a high-risk and low-risk cohort.Obstet Gynecol. 2014 Aug;124(2 Pt 1):210-218. doi: 10.1097/AOG.0000000000000363. Obstet Gynecol. 2014. PMID: 25004354 Free PMC article.
-
Clinical experience and follow-up with large scale single-nucleotide polymorphism-based noninvasive prenatal aneuploidy testing.Am J Obstet Gynecol. 2014 Nov;211(5):527.e1-527.e17. doi: 10.1016/j.ajog.2014.08.006. Epub 2014 Aug 8. Am J Obstet Gynecol. 2014. PMID: 25111587
-
Non-invasive prenatal testing for fetal chromosomal abnormalities by low-coverage whole-genome sequencing of maternal plasma DNA: review of 1982 consecutive cases in a single center.Ultrasound Obstet Gynecol. 2014 Mar;43(3):254-64. doi: 10.1002/uog.13277. Epub 2014 Feb 10. Ultrasound Obstet Gynecol. 2014. PMID: 24339153 Review.
-
Use of cell-free fetal DNA in maternal plasma for noninvasive prenatal screening.Clin Perinatol. 2014 Dec;41(4):957-66. doi: 10.1016/j.clp.2014.08.013. Epub 2014 Oct 1. Clin Perinatol. 2014. PMID: 25459783 Review.
Cited by
-
Genomics-based non-invasive prenatal testing for detection of fetal chromosomal aneuploidy in pregnant women.Cochrane Database Syst Rev. 2017 Nov 10;11(11):CD011767. doi: 10.1002/14651858.CD011767.pub2. Cochrane Database Syst Rev. 2017. PMID: 29125628 Free PMC article.
-
Prospective prenatal cell-free DNA screening for genetic conditions of heterogenous etiologies.Nat Med. 2024 Feb;30(2):470-479. doi: 10.1038/s41591-023-02774-x. Epub 2024 Jan 22. Nat Med. 2024. PMID: 38253798
-
Chromosomal phase improves aneuploidy detection in non-invasive prenatal testing at low fetal DNA fractions.Sci Rep. 2022 Jul 14;12(1):12025. doi: 10.1038/s41598-022-14049-5. Sci Rep. 2022. PMID: 35835769 Free PMC article.
-
NIPTeR: an R package for fast and accurate trisomy prediction in non-invasive prenatal testing.BMC Bioinformatics. 2018 Dec 17;19(1):531. doi: 10.1186/s12859-018-2557-8. BMC Bioinformatics. 2018. PMID: 30558531 Free PMC article.
-
Clinical performance of DNA-based prenatal screening using single-nucleotide polymorphisms approach in Thai women with singleton pregnancy.Mol Genet Genomic Med. 2020 Jul;8(7):e1256. doi: 10.1002/mgg3.1256. Epub 2020 Apr 24. Mol Genet Genomic Med. 2020. PMID: 32329244 Free PMC article.
References
-
- Carey JC (2010) Trisomy 18 and Trisomy 13 Syndromes. In: Cassidy SB, Allanson JE, editors. Management of Genetic Syndromes. Hoboken, NJ: John Wiley & Sons, Inc.
-
- Lakovschek IC, Streubel B, Ulm B (2011) Natural outcome of trisomy 13, trisomy 18, and triploidy after prenatal diagnosis. American Journal of Medical Genetics, Part A 155: 2626–2633. - PubMed
-
- Crider KS, Olney RS, Cragan JD (2008) Trisomies 13 and 18: Population prevalences, characteristics, and prenatal diagnosis, metropolitan Atlanta, 1994–2003. American Journal of Medical Genetics, Part A 146A: 820–826. - PubMed
-
- Parker MJ, Budd JL, Draper ES, Young ID (2003) Trisomy 13 and trisomy 18 in a defined population: epidemiological, genetic and prenatal observations. Prenatal Diagnosis 23: 856–860. - PubMed
-
- Forrester MB, Merz RD (2003) First-year mortality rates for selected birth defects, Hawaii, 1986–1999. American Journal of Medical Genetics, Part A 119A: 311–318. - PubMed
Publication types
MeSH terms
LinkOut - more resources
Full Text Sources
Other Literature Sources
Medical
