. 2014 May 6;15(5):7841-64.
doi: 10.3390/ijms15057841.

Alpha-bulges in G protein-coupled receptors

Affiliations

Alpha-bulges in G protein-coupled receptors

Rob van der Kant et al. Int J Mol Sci. .

Abstract

Agonist binding is related to a series of motions in G protein-coupled receptors (GPCRs) that result in the separation of transmembrane helices III and VI at their cytosolic ends and subsequent G protein binding. A large number of smaller motions also seem to be associated with activation. Most helices in GPCRs are highly irregular and often contain kinks, with extensive literature already available about the role of prolines in kink formation and the precise function of these kinks. GPCR transmembrane helices also contain many α-bulges. In this article we aim to draw attention to the role of these α-bulges in ligand and G-protein binding, as well as their role in several aspects of the mobility associated with GPCR activation. This mobility includes regularization and translation of helix III in the extracellular direction, a rotation of the entire helix VI, an inward movement of the helices near the extracellular side, and a concerted motion of the cytosolic ends of the helices that makes their orientation appear more circular and that opens up space for the G protein to bind. In several cases, α-bulges either appear or disappear as part of the activation process.


Figures

Figure 1.
Figure 1.
Overview of G protein-coupled receptors (GPCR) helix bundle with conserved residues indicated. In most GPCR sequences, we find the following conserved residues (first digit indicates the helix number; see the GPCRDB [5,6] or other GPCR systems like the Glycoprotein-hormone Receptor Information System (GRIS) [7] for a detailed discussion of the numbering system): Gly129, Asn130, Leu220, Asp224, Asn729, Pro730 (in the ion pocket that is involved in signalling between the ligand binding site and the G-protein binding site); Cys315 (which forms a Cys–Cys bridge with Cys446 in the loop between helices IV and V), Asp339, Arg340, Tyr341 (the DRY motif, involved in activation), and Tyr528 (involved in G protein interactions); Trp 420 (purple, just visible behind the ion pocket residues; likely involved in cholesterol binding, perhaps involved in dimer contacts), Pro520, Cys617, Trp618, Pro620 (involved in ligand interaction and trigger and/or hinge for motions needed for activation) Tyr733 (just underneath the ion pocket, swings from proximity of ion pocket into direction of DRY upon activation). Rhodopsin (PDBid = 1f88 [2]) has been used for this figure.
Figure 2.
Figure 2.
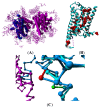
Examples of crystallization artifacts. (A) The turkey β1-adrenoceptor, PDBid = 2vt4 [16]. The asymmetric unit contains a dimer of non-natural up-side-down dimers. The A subunit in the first dimer is shown in blue while the other three monomers are shown in purple. Crystallization additives are shown in a ball representation. Residues in other molecules in the crystal that have at least one atom within 10 Å from any of the four subunits in the asymmetric unit are shown as a purple stick model; (B) Ribbon representation of bovine rhodopsin, PDBid = 1f88 [2]. All residue positions mutated for thermostabilization in any of the structures mentioned in this article are shown in a red ball-representation; and (C) Trace representation of the β2 adrenoceptor, PDBid = 2r4s [23] shown in dark blue bound to an antibody shown in magenta. The β2 adrenoceptor with PDBid = 3ny9 [12] that does not bind anything in this region is superposed and shown in light blue. Both are bound to inverse agonists. The antibody distorts helix VIII resulting in a bulge in 2r4s (shown in red) followed by an anti-bulge (310 helix) at the location where 3ny9 has a normal helix (shown in green).
Figure 3.
Figure 3.
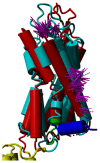
The structures of the neurotensin 1 (NTS1) receptor (red; PDBid = 4grv [19]) and rhodopsin (blue; PDBid = 1f88 [2]). The lysozyme that is cloned between helices V and VI in NTS1 is partly shown (in yellow). Helix VIII is shown in dark blue in rhodopsin and in green in NTS1. The purple lines indicate crystal packing contacts made by helix I in NTS1.
Figure 4.
Figure 4.
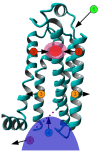
Mechanism of GPCR activation. Agonist binding (1) induces inward motions (2) of the extracellular side of helices V–VII. This is accompanied by an outward movement of the cytosolic side of helices V–VII (3), allowing the G protein (shown as solid blue blob) to bind (4) and become activated (5). Obviously, there is no fixed order in the motions. The determination of what moves where depends largely on the superposition method used.
Figure 5.
Figure 5.
Fourteen consecutive residues in helix II (starting at the conserved L at position 220) extracted from the trace amine sequence alignment from the GPCRDB. From left to right the columns contain the GPCRDB sequence number, the consensus sequence at that position, and the amino acid at that position in each of the 61 sequences in the GPCRDB trace amine family 16. Figure copied with permission from Isberg et al. [31].
Figure 6.
Figure 6.
Distances found to be important by the random forest method to separate active from inactive structures mapped on rhodopsin (PDBid = 1f88 [2]) looked at from the intracellular side. The distances indicated in magenta increase upon activation; distances indicated in yellow decrease upon activation.
Figure 7.
Figure 7.
Helix I extracted from a structural alignment of 69 structures in YASARA’s [44] Cα trace representation. The structures from which the N-terminal domain was removed (and sometimes also a small part of the extracellular end of this helix truncated), display an outward displacement of helix I away from the transmembrane helix bundle.
Figure 8.
Figure 8.
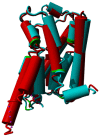
β-2 adrenoceptor in the active state (PDBid = 3sn6 [11]; red) superposed on the inactive state (PDBid = 3ny8 [12]; cyan). The superposition was performed with the WHAT IF superposition module and involved 239 residues that matched with an RMS Cα displacement of 1.34 Å. Ligands, sugars, G proteins, etc. are not shown for clarity. Prolines are colored green. The major differences observed are in helices V and VI in the lower left of the figure. In the active form, helix V is much longer and the cytosolic half of helix VI is rotated outwards by about 30 degrees (please note that this involves a rotation of the entire helix, not just the cytosolic half). Further large differences are seen in helix VII (in the centre) and in the corner between helices VII and VIII. The different orientation of helix I (right most helix) in the two structures is most likely caused by crystal packing artifacts.
Figure 9.
Figure 9.
Secondary structure distribution for residues that are common to the 69 structures used in this study. Blue: α-helix; yellow: α-bulge/π-helix; purple: 310 helix; orange: loop, strand, and turn. Each vertical bar is 69 residues high and the fraction of the bar in a certain color corresponds to the fraction of residues with the corresponding secondary structure. Secondary structures were determined with DSSP 2.0. The plot contains all transmembrane residues plus a few residues into the loop areas that all 69 structures have in common. In most α-bulge areas, one residue is therefore not counted. Small white bars represent the elements between the transmembrane regions that are not structurally conserved throughout the 69 structures. The central part of helix VII is either a regular helix, or consists of a stretch of 310 helix combined with a bulge or similar irregularity. Despite bulges and 310 stretches, the part of helix VII that ends with the conserved NP motif at positions 729 and 730 always has equally many residues so that no residue numbering differences can be observed between receptors.
Figure 10.
Figure 10.
The area around the bulge in helix-V. The S1P lipid receptor (orange, PDBid = 3v2y [45]) does not have α-bulges in helix V and is given as a reference. Rhodopsin (magenta, PDBid = 1f88 [2]) and the adenosine-2A receptor (blue, PDBid = 3eml [46]) have an α-bulge (A) between positions 516 and 517; and the adenosine-2A receptor has an extra bulge (B) between positions 511 and 512. Side chains of residues at position 520 are shown. Rhodopsin and the adenosine-2A receptor have a proline at position 520. The S1P lipid receptor, which does not have bulges in helix V, does not have a proline at position 520. Time will tell if this correlation is accidental or causal.
Figure 11.
Figure 11.
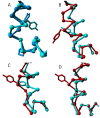
Structural variability in the intracellular part of helix VII near residue Tyr733. In all four panels the cytosolic side of helix VII and the beginning of helix VIII are shown as a trace model and the Tyr733 side chain is shown as a stick model. In all four panels helix VIII points to the right. (A) Cyan represents inactive rhodopsin (PDBid = 1f88 [2]), blue represents inactive β2 adrenoceptor (PDBid = 3ny9 [12]). After Tyr733, rhodopsin forms a normal helix and the β2 adrenoceptor forms a 310 helix, which is followed by a proline at the beginning of helix VIII. In the Panels BD, cyan represents the inactive state, red represents the active state; (B) Adenosine A2A receptor. Cyan: PDBid = 3eml [46]. Red: PDBid = 2ydo [14]; (C) β2 adrenoceptor. Cyan: PDBid = 3ny9 [12]. Red: PDBid = 3sn6 [11]; and (D) Rhodopsin. Cyan: PDBid = 1f88 [2]. Red: PDBid = 3cap [50]. In rhodopsin and the adenosine A2A receptor, a bulge is formed upon activation. In the β2 adrenoceptor the inactive state has a 310 helix, which becomes a normal helix upon activation.
Figure 12.
Figure 12.
Bulges in helix IV. Left: CXCR4 chemokine receptor (blue; PDBid = 3odu [48]) superposed on the delta opioid receptor (cyan; PDBid = 4ej4 [51]) as reference. The CXCR4 chemokine receptor has an α-bulge between positions 418 and 419; and Right: M2 muscarinic acetylcholine receptor (red; PDBid = 3uon [49]) superposed on the dopamine D3 receptor (cyan; PDBid = 3pbl [52]) as a reference. The M2 muscarinic receptor has an α-bulge between positions 428 and 429.
Figure 13.
Figure 13.
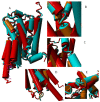
(A) Eleven adenosine 2A structures superposed. Light blue: 3vg9 [21] and 3vga [21] that each bind an inverse agonist; brown: 3eml [46], 3pwh [17], 3rey [17], 3rfm [17], 3uza [54] and 3uzc [54] that each bind an antagonist; red: 2ydo [14], 2ydv [14] and 3qak [55] that each bind an agonist. At some locations these three groups show systematic behavior that is illustrated in the blow-up of three representative structures (3vga, 3eml and 2ydo) in the panels BE; (B) Helix II shows a systematic displacement of the area around the α-bulge towards helix III in the activated receptors; (C) Helix V in the activated receptors shows a systematic displacement of the area around the α-bulge towards helices III and IV; (D) Relative to the inverse agonist bound structures (cyan), the cytosolic side of helix V moves outward when an agonist is bound and inward when an antagonist is bound; and (E) The loop between helix VII and helix VIII behaves systematically (albeit in a hard to describe way) as function of the type of ligand bound, in line with the crucial role in the activation process for mobility of Tyr733.
Figure 14.
Figure 14.
Local superposition results of A2A adenosine receptor transmembrane helices. In this figure, helices are taken out of the structure and superposed without using the rest of the molecule. (A) Helix III becomes more regular upon activation. The side chain of one of Val-322 (known in many GPCRs to be crucial for binding the endogenous ligand) is indicated as a point of reference; (B) Helix IV is highly irregular at the cytosolic side. It is not clear if this is caused by the bound ligand or if it is caused by a crystal packing artifact; (C) Helix V is seen winding up more tightly going from inverse agonist, via antagonist, to agonist bound structures; (D) Helix VI neither tilts nor kinks upon activation. Instead, the entire helix rotates. A minor tightening of the cytosolic end of the helix is observed in the agonist bound form; and (E) Helix VII forms a bulge on the intracellular side upon activation while rotating toward the centre of the seven-helix bundle. 3qak shows a different Cα trace, which correlates with the absence of a structural water near this difference.
Figure 15.
Figure 15.
(A) Seven β2 adrenoceptor structures superposed. Light blue: 2rh1 [56], 3d4s [57], 3ny8 [12] and 3ny9 [12] that each bind an inverse agonist; orange: 3nya [12] that binds to an antagonist; red: 3p0g [15] and 3sn6 [12] that each bind an agonist in combination with a nanobody and a trimeric G protein respectively to the cytosolic side. At some locations, these three groups show a systematic behavior that is illustrated in Panels BE, which show a blow-up of three representative structures (light blue: 3ny8 bound to an inverse agonist; orange: 3nya bound to an antagonist; red: 3sn6 bound to an agonist and a trimeric G protein on the cytosolic side); (B) In helix II we observe a systematic motion of the area around the a-bulge towards helix III in the activated receptor; (C) In helix V, we observe a systematic motion of the area around the α-bulge towards helix III and helix IV in the activated receptor; (D) Relative to the inverse agonist bound structure (cyan) and the antagonist bound structure (orange), the cytosolic side of helix V moves outward when an agonist and a G-protein are bound as does helix VI; and (E) The loop between helix VII and helix VIII behaves systematically (albeit in a hard to describe way) as function of the type of ligand bound.

References

    1. PubMed. [accessed on 19 April 2014]. Available online: http://www.ncbi.nlm.nih.gov/pubmed.
    1. Palczewski K., Kumasaka T., Hori T., Behnke C.A., Motoshima H., Fox B.A., le Trong I., Teller D.C., Okada T., Stenkamp R.E., et al. Crystal structure of rhodopsin: A G protein-coupled receptor. Science. 2000;289:739–745. - PubMed
    1. GPCR Network. [accessed on 19 April 2014]. Available online: http://gpcr.scripps.edu/
    1. Kouranov A., Xie L., de la Cruz J., Chen L., Westbrook J., Bourne P.E., Berman H.M. The RCSB PDB information portal for structural genomics. Nucleic Acids Res. 2006;34:D302–D305. - PMC - PubMed
    1. Vroling B., Sanders M., Baakman C., Borrmann A., Verhoeven S., Klomp J., Oliveira L., de Vlieg J., Vriend G. GPCRDB: Information system for G protein-coupled receptors. Nucleic Acids Res. 2011;39:D309–D319. - PMC - PubMed