Clinical Trial
. 2014 Aug;63(8):821-33.
doi: 10.1007/s00262-014-1556-5. Epub 2014 May 8.

Interleukin-2-stimulated natural killer cells are less susceptible to mycophenolate mofetil than non-activated NK cells: possible consequences for immunotherapy

Affiliations
Clinical Trial

Interleukin-2-stimulated natural killer cells are less susceptible to mycophenolate mofetil than non-activated NK cells: possible consequences for immunotherapy

Claudia Brehm et al. Cancer Immunol Immunother. 2014 Aug.

Abstract

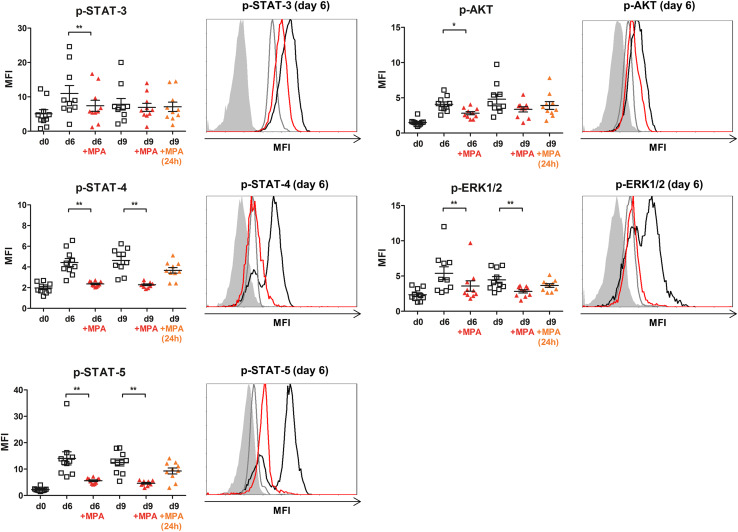
In a clinical phase I/II trial, pediatric patients with high-risk malignancies were treated with ex vivo IL-2-stimulated donor natural killer (NK) cells after transplantation with haploidentical stem cells. To evaluate the potential negative effects of the immunosuppressive drug mycophenolate mofetil (MMF) used for immunotherapy, the functionality and signaling of ex vivo NK cells was investigated. Our results show that during NK cell expansion, long-term (9 days) incubation with mycophenolic acid (MPA), the active metabolite of MMF, in therapeutically relevant concentrations led to the severe inhibition of NK cell proliferation. This correlated with a significantly reduced cytokine/chemokine secretion and the inhibited acquisition of surface receptors regarding cytotoxicity (e.g., NKp30, NKp44, NKp46, NKG2D), adhesion/migration (e.g., ICAM-1/CD54, LFA-1/CD11a, CD62L, CXCR3) and activation (e.g., CD25). Moreover, MPA prevented phosphorylation of the central signaling molecules STAT-3/-4/-5, AKT and ERK1/2. In contrast, short-term (24 h) MPA incubation of IL-2-stimulated NK cells had no or only marginal effects on the activated NK cell phenotype, including receptor expression, cytokine/chemokine secretion and intracellular signaling. Further, short-term MPA incubation only moderately affected the highly cytotoxic activity of previously IL-2-stimulated NK cells. In conclusion, while long-term MPA incubation significantly compromised ex vivo NK cell functionality, previously IL-2-activated NK cells seemed to be rather resistant to short-term MPA treatment. This finding supports the use of IL-2-activated NK cells as immunotherapy, especially for patients treated with MMF after haploidentical stem cell transplantation.


Conflict of interest statement

The authors declare that they have no conflicts of interest.

Figures

Fig. 1
Fig. 1
Dose-dependent inhibition of ex vivo NK cell proliferation by long-term MPA treatment. a Evaluation of potent MPA dose. Overlay histogram plots show a dose-dependent inhibition of the proliferation of CFSE-labeled NK cells indicated by reduced CFSE fluorescence intensity. The right overlay plot gives an overview of the tested MPA concentrations. Here, 10 µM MPA was the lowest concentration that completely inhibited proliferation. Plots gated on viable CD56+CD3 NK cells (red: IL-2-stimulated NK cells + MPA; black: IL-2-stimulated NK cells d9 (positive control); dark gray area: unstimulated NK cells d0 (negative control); light gray area: autofluorescence IL-2-stimulated NK cells). b Inhibition and reversibility of MPA. The proliferation of IL-2-stimulated NK cells was severely inhibited in the first cell divisions by 10 µM MPA. This MPA-mediated inhibition was completely reversed after the removal of MPA from the cell medium on day 3, and these NK cells also reached the 7th cell generation during 9 days of IL-2 stimulation. Plots gated on viable CD56+CD3 NK cells. c Effect in absolute cell count. Following an initial decrease in cell count, NK cells showed a mean 2.7-fold expansion. Long-term treatment with 10 µM MPA resulted in an absolute inhibition of proliferation, which correlated with a complete decrease in viable cell count (n = 10, mean ± SD). Plots gated on viable CD56+CD3 NK cells. d CD56 surface expression. Unstimulated PB NK cells showed a CD56dimCD16+ (85.8 %) and CD56brightCD16dim/− (14.3 %) phenotype. Following IL-2 stimulation, CD56 surface expression became highly up-regulated [mean fluorescence intensity (MFI) 7–73]. This was completely inhibited by long-term MPA incubation (MFI 10). Plots gated on viable CD56+CD3 NK cells. Plots show representative results of n = 10 experiments
Fig. 2
Fig. 2
NK cell cytotoxicity is significantly reduced by MPA and patient’s plasma obtained during immunosuppressive therapy. a Influence on NK cell cytotoxicity. The high cytotoxic activity of IL-2-stimulated donor NK cells (white) was significantly reduced following short-term incubation (24 h) with 10 µM MPA (red). E:T ratios 1:1, 5:1 and 10:1 against K562 cells (median/range, n = 5 donors in duplicate experiments, Table 1, donors for patients No. 1–5, p < 0.01 indicated as **, Wilcoxon matched-pairs signed rank test). b Influence on NK cell morphology. Representative snapshots of two time-lapse microscopy videos (suppl. material video 1 and 2), magnification 200-fold. Donor NK cells were co-cultured with primary NB cells growing as tumor spheroids (arrow) isolated from a tumor metastasis. IL-2-stimulated NK cells showed a typical polar morphology (left, black inverted triangle) while short-term (24 h) MPA-treated NK cells had a narrowed and rounded morphology (right, red inverted triangle). c Influence of patient PB plasma on NK cell cytotoxicity. The highly cytotoxic activity of the IL-2-activated donor NK cells (white) was significantly reduced following pre-incubation with patient PB plasma for 24 h (red). E:T ratios 1:1, 5:1 and 10:1 against K562 cells (median/range, n = 4 donors in duplicate experiments, Table 1, donors for patients No. 1–4, p < 0.01 indicated as **, Wilcoxon matched-pairs signed rank test). d Influence of steroid application during NK-DLI on NK cell cytotoxicity. Short-term incubation (24 h) of stimulated donor NK cells with patient`s PB plasma collected after single steroid application showed the most prominent reduction in cytotoxicity. The high target killing activity of 66.4 % (white) was reduced to 52.7 % after the patient`s plasma incubation alone (red) and was further reduced to 34.5 % after patient’s plasma incubation including steroids (red pattern), (mean ± SD, n = 1 donor in duplicate experiments, Table 1, donor for patient No. 1, E:T ratio 1:1 against K562 cells, p < 0.05 and p < 0.01 indicated as * and **, t-test)
Fig. 3
Fig. 3
Short- and long-term influence of MPA on surface expression of NK cell receptors. a Influence of long- and short-term MPA incubation on surface phenotype. Plots show MFI of central NK cell surface molecules involved in cytotoxicity (NKp30, NKp44, NKp46, NKG2D, NKG2A, DNAM-1), adhesion/migration (CXCR3, CCR5), CD11a/LFA-1, CD62L/L-selectin), and activation (CD25/IL2-Rα). All investigated surface molecules become highly up-regulated upon IL-2 stimulation (white square) compared with unstimulated NK cells at day 0. This was significantly inhibited by long-term MPA incubation (red triangle), while short-term (24 h) MPA treatment (orange triangle) had no effect on previously up-regulated surface receptors (n = 10, plots gated on viable CD56+CD3 NK cells, p < 0.05 and p < 0.01 indicated as * and **, Wilcoxon matched-pairs signed rank test). b Overlay plots show representative results regarding NKG2D, CD11a and CD25 expression following 9 days of IL-2 stimulation (black) ± long- (red) and short-term (orange) MPA incubation compared with unstimulated NK cells at day 0 (gray area), (MFI vs. events, plots gated on viable CD56+CD3 NK cells)
Fig. 4
Fig. 4
Long-term MPA incubation significantly inhibits phosphorylation of central intracellular signaling molecules in NK cells. Influence of long- and short-term MPA incubation on STAT-3, STAT-4, STAT-5, AKT and ERK1/2 phosphorylation. Intracellular signaling molecules became phosphorylated upon IL-2 stimulation with an activation peak at day 6 (STAT-3,-5, ERK1/2) or day 9 (STAT-4, AKT), (white square) compared with unstimulated NK cells at day 0. Long-term MPA incubation (red triangle) significantly inhibited the IL-2-induced phosphorylation/activation, while short-term (24 h) MPA treatment (orange triangle) had no or a minimal effect on previously activated signaling molecules (n = 10, plots gated on CD56+CD3 NK cells, p < 0.05 and p < 0.01 indicated as * and **, Wilcoxon matched-pairs signed rank test). Overlay plots show representative results regarding p-STAT-3, -4, -5, p-AKT and p-ERK1/2 expression following 6d IL-2 stimulation (black) ± long-time (red) MPA incubation compared with unstimulated NK cells at d0 (gray) and autofluorescence (gray area), (MFI vs. events, plots gated on CD56+CD3 NK cells)
Fig. 5
Fig. 5
Ex vivo cytokine and chemokine secretion of IL-2-stimulated NK cells ± MPA. Absolute NK cell count (left Y-axis, black) in relation to cytokine/chemokine concentration in the supernatant of NK cell culture (right Y-axis, green). An initial decrease in viable cell count was followed by the expansion of IL-2-stimulated NK cells (white bars), which was severely decreased by long-term MPA treatment (red bars). The high secretion of IFN-γ, TNF-α, CXCL8, IL-6, CCL2, CCL4 and CCL5 during IL-2 stimulation (green square, black border) was significantly inhibited by the additional treatment with MPA (green square, red border). Left Y-axis: absolute NK cell count; right Y-axis: cytokine/chemokine concentration with different scaling ranging from 0 to 400,000 pg/ml; X-axis: days of cultivation ±10 µM MPA (n = 10, mean ± SEM, gated on viable CD56+CD3 NK cells, p < 0.05 and p < 0.01 indicated as * and **, Wilcoxon matched-pairs signed rank test)

References

    1. Cooper MA, Fehniger TA, Caligiuri MA. The biology of human natural killer-cell subsets. Trends Immunol. 2001;22(11):633–640. doi: 10.1016/S1471-4906(01)02060-9. - DOI - PubMed
    1. Farag SS, Caligiuri MA. Human natural killer cell development and biology. Blood Rev. 2006;20(3):123–137. doi: 10.1016/j.blre.2005.10.001. - DOI - PubMed
    1. Ljunggren HG, Malmberg KJ. Prospects for the use of NK cells in immunotherapy of human cancer. Nat Rev Immunol. 2007;7(5):329–339. doi: 10.1038/nri2073. - DOI - PubMed
    1. Lanier LL. NK cell recognition. Annu Rev Immunol. 2005;23:225–274. doi: 10.1146/annurev.immunol.23.021704.115526. - DOI - PubMed
    1. Ljunggren HG, Karre K. In search of the ‘missing self’: MHC molecules and NK cell recognition. Immunol Today. 1990;11(7):237–244. doi: 10.1016/0167-5699(90)90097-S. - DOI - PubMed

Publication types

MeSH terms

LinkOut - more resources