. 2014;13(13):2084-100.
doi: 10.4161/cc.29104. Epub 2014 May 7.

The Down syndrome-related protein kinase DYRK1A phosphorylates p27(Kip1) and Cyclin D1 and induces cell cycle exit and neuronal differentiation

Affiliations

The Down syndrome-related protein kinase DYRK1A phosphorylates p27(Kip1) and Cyclin D1 and induces cell cycle exit and neuronal differentiation

Ulf Soppa et al. Cell Cycle. 2014.

Abstract

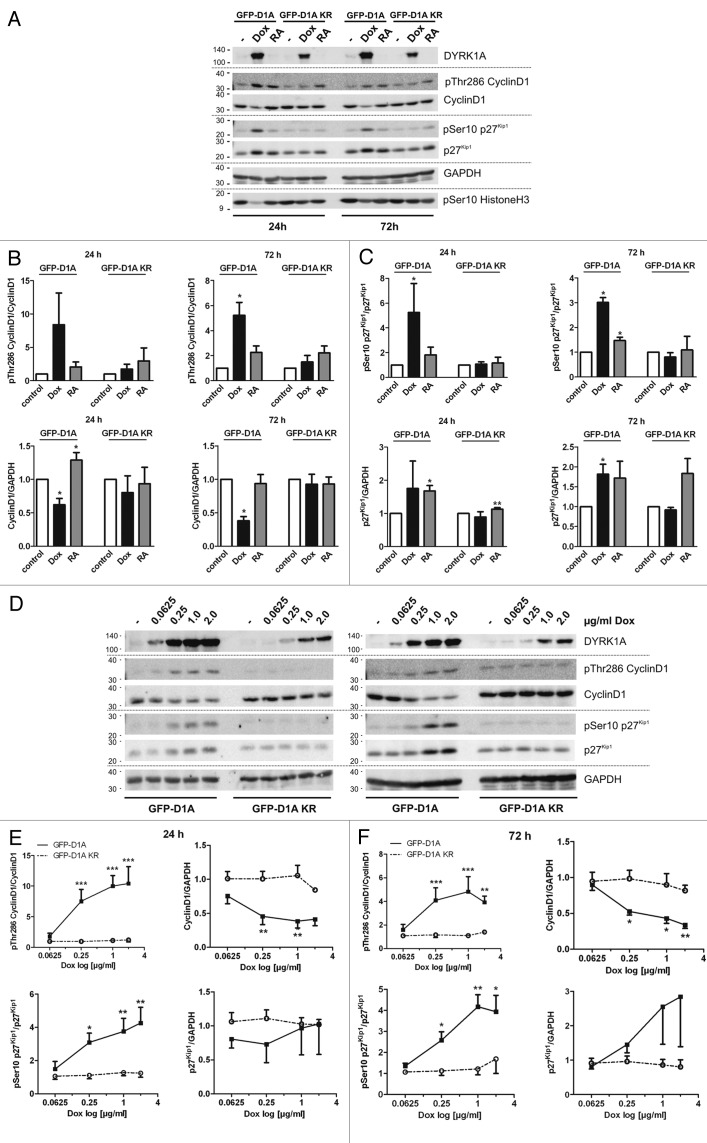
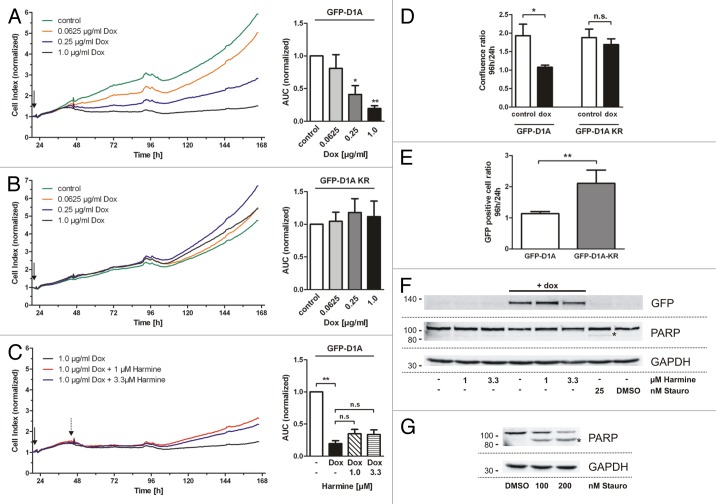
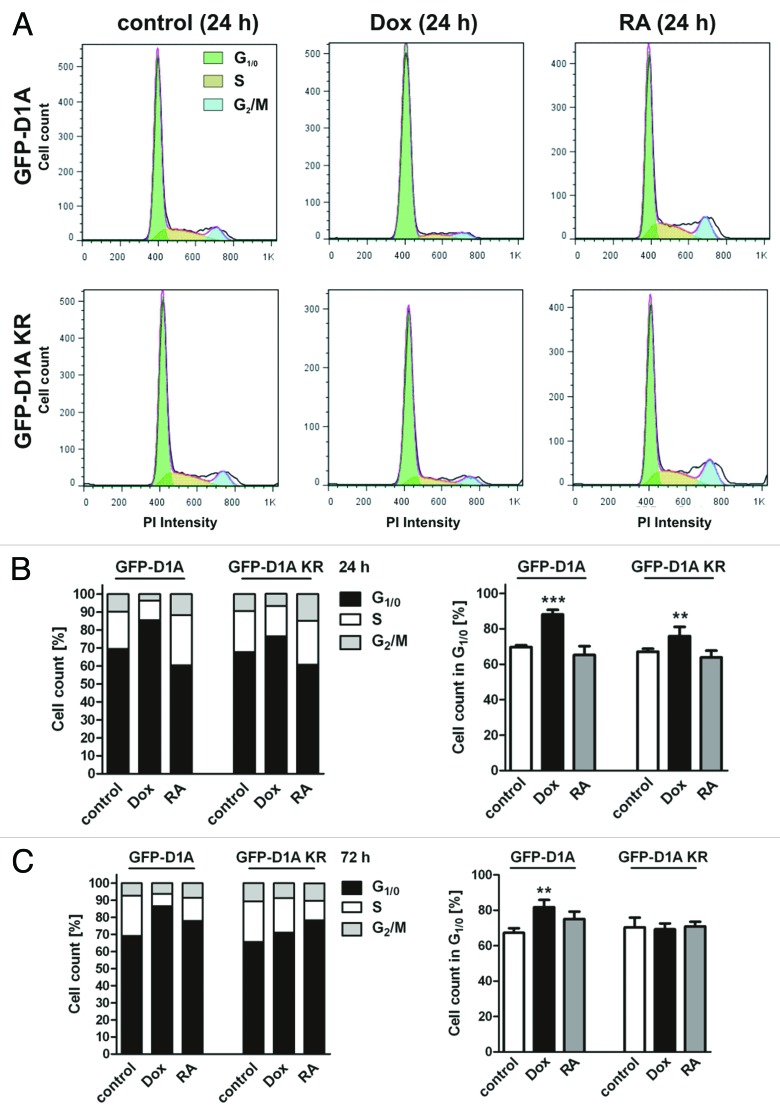
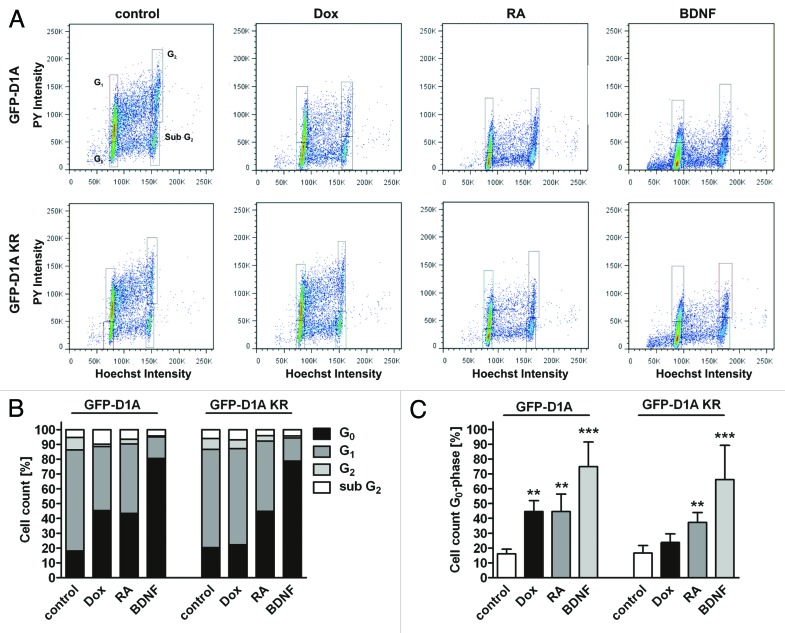
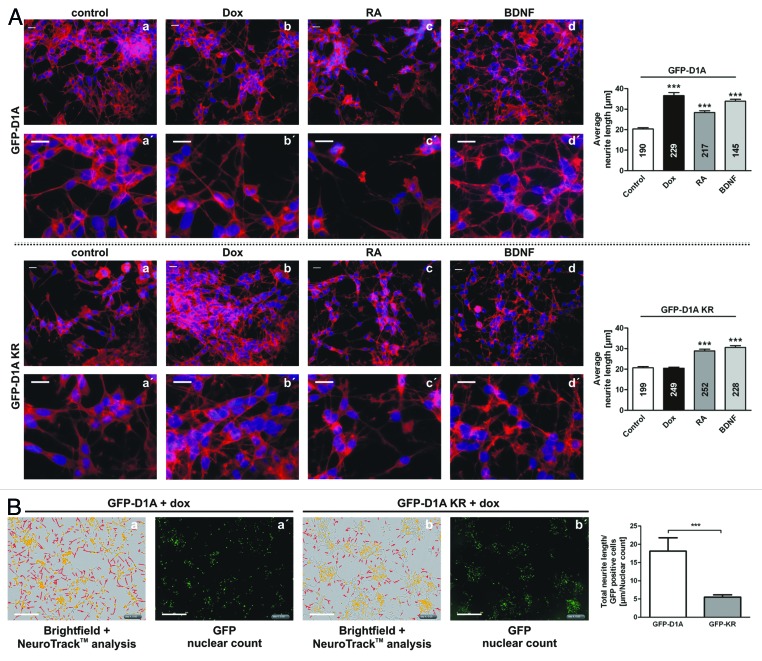
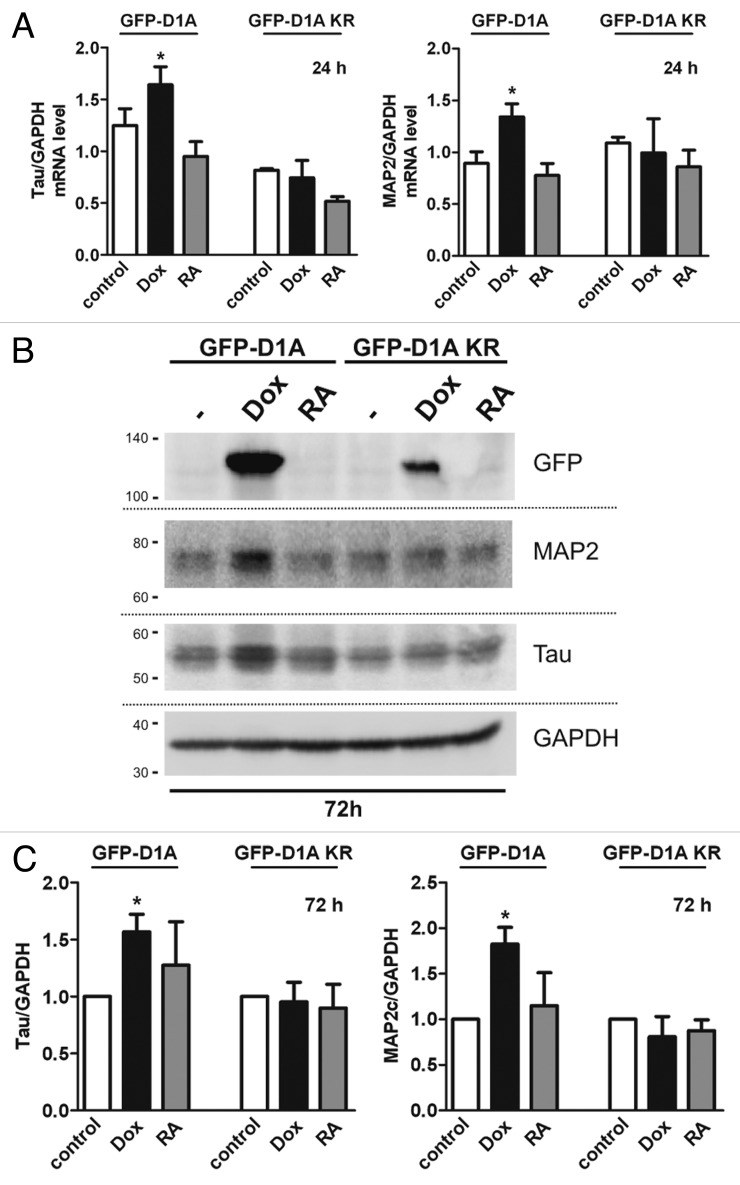
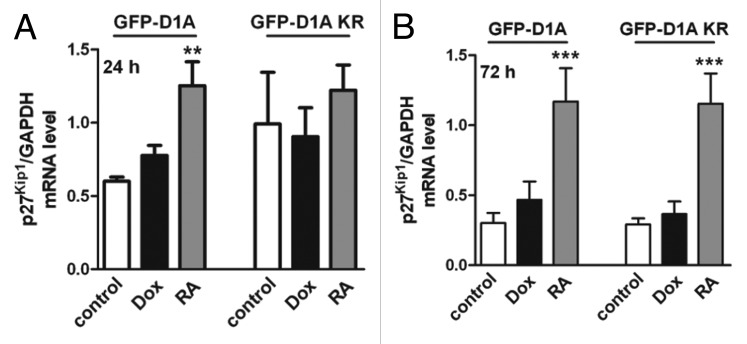
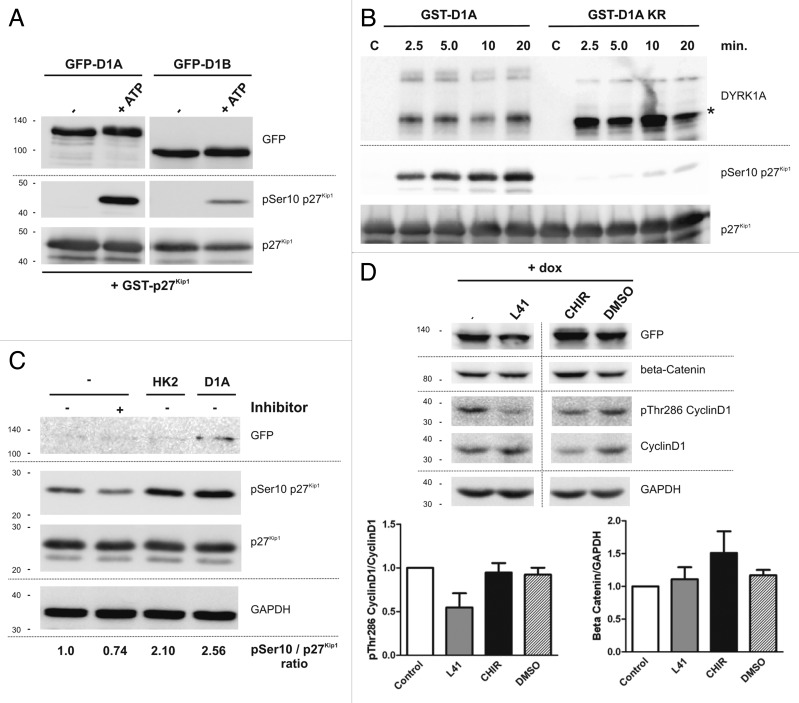
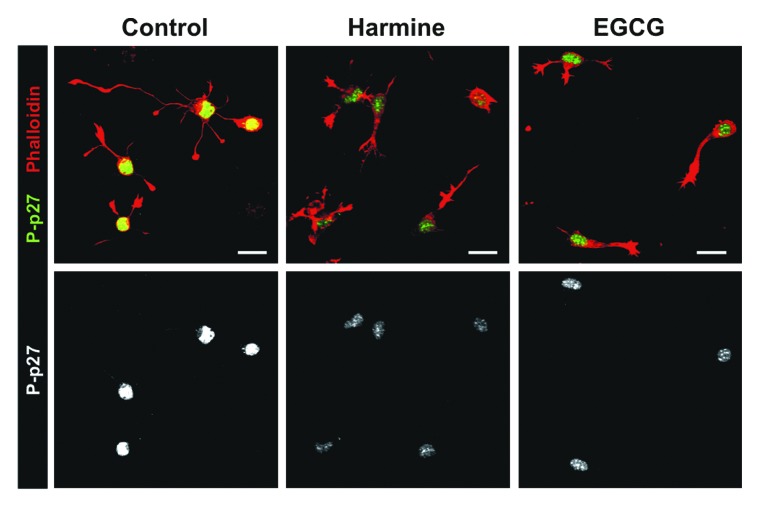
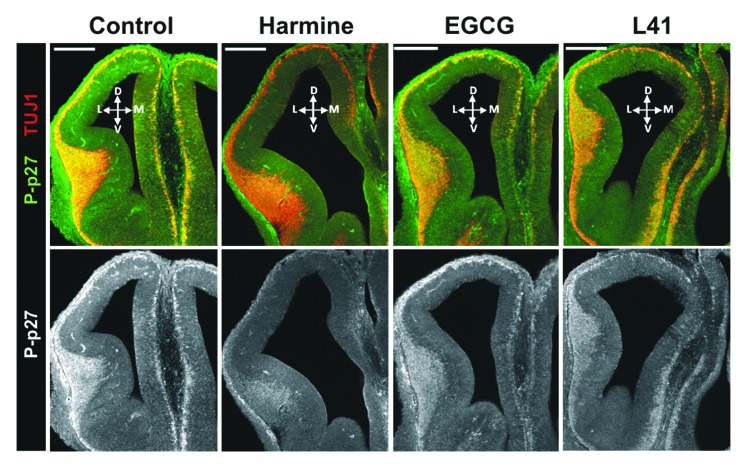
A fundamental question in neurobiology is how the balance between proliferation and differentiation of neuronal precursors is maintained to ensure that the proper number of brain neurons is generated. Substantial evidence implicates DYRK1A (dual specificity tyrosine-phosphorylation-regulated kinase 1A) as a candidate gene responsible for altered neuronal development and brain abnormalities in Down syndrome. Recent findings support the hypothesis that DYRK1A is involved in cell cycle control. Nonetheless, how DYRK1A contributes to neuronal cell cycle regulation and thereby affects neurogenesis remains poorly understood. In the present study we have investigated the mechanisms by which DYRK1A affects cell cycle regulation and neuronal differentiation in a human cell model, mouse neurons, and mouse brain. Dependent on its kinase activity and correlated with the dosage of overexpression, DYRK1A blocked proliferation of SH-SY5Y neuroblastoma cells within 24 h and arrested the cells in G₁ phase. Sustained overexpression of DYRK1A induced G₀ cell cycle exit and neuronal differentiation. Furthermore, we provide evidence that DYRK1A modulated protein stability of cell cycle-regulatory proteins. DYRK1A reduced cellular Cyclin D1 levels by phosphorylation on Thr286, which is known to induce proteasomal degradation. In addition, DYRK1A phosphorylated p27(Kip1) on Ser10, resulting in protein stabilization. Inhibition of DYRK1A kinase activity reduced p27(Kip1) Ser10 phosphorylation in cultured hippocampal neurons and in embryonic mouse brain. In aggregate, these results suggest a novel mechanism by which overexpression of DYRK1A may promote premature neuronal differentiation and contribute to altered brain development in Down syndrome.

Keywords: Cyclin D1; DYRK1A; Down syndrome; cell cycle; neuronal differentiation; p27Kip1; phosphorylation.


Figures

None
Figure 6. DYRK1A overexpression increases phosphorylation of p27Kip1 and Cyclin D1 in SH-SY5Y cells and alters their protein levels. (A) Western blot analysis of total protein extracts from SH-SY5Y cells. Cells were treated with 2 µg/ml doxycycline to induce overexpression of DYRK1A or DYRK1A-K188R or with 10 µM RA. Control cells were left untreated (−). Whole-cell lysates were prepared 24 h or 72 h after induction of DYRK1A overexpression or differentiation and analyzed by immunoblotting with the indicated antibodies. Migration of mass standards is indicated in kDa (left). Densitometric evaluation of 3 independent experiments (means + SD) is shown in panels (B; Cyclin D1) and (C; p27Kip1). (D) Overexpression of DYRK1A or DYRK1A-K188R was gradually induced using increasing concentrations of doxycyclin as indicated. Cells were lysed 24 h (left panel) or 72 h (right panel) after induction of DYRK1A overexpression, and whole-cell lysates were subjected to western blot analysis. Densitometric evaluation of 3 independent experiments (means + SEM) is summarized in panels (E) (24 h) and (F) (72 h). Ser10 and Thr286 phosphorylation were normalized to p27Kip or Cyclin D1 total protein and p27Kip or Cyclin D1 levels are shown relative to the loading control (GAPDH). One-sample t test was used to compare columns to normalized controls (B and C). One-way ANOVA + Bonferroni post-test was used to analyze effects of increasing dox concentrations. Significances are indicated for comparison of GFP-D1A with GFP-D1A-KR (F and G). p27Kip1/GAPDH data (F) was tested using Kruskal–Wallis test and Dunn multiple comparison post-test; *P ≤ 0.05.; **P ≤ 0.01***P ≤ 0.001.
None
Figure 1. DYRK1A overexpression induces proliferation arrest of SH-SY5Y cells but not apoptosis. (A–C) The curves show representative real-time impedance measurements of proliferating SH-SY5Y cells after induced overexpression of wild-type DYRK1A (A; GFP-D1A) or the kinase deficient mutant DYRK1A-K188R (B; GFP-D1A KR). Panel (C) shows the proliferation of SH-SY5Y cells treated with harmine 24 h after induction of GFP-DYRK1A overexpression. DYRK1A overexpression was induced 24 h after plating with doxycycline as indicated (arrow). Column diagrams illustrate the quantitative evaluation (means + SD) of 3 independent experiments (AUC, area under the curve from 24–168 h, normalized to the untreated control cells). In panel (C), the AUCs were normalized to the untreated control cells (A). (D and E) Analysis of SH-SY5Y cell proliferation by continuous live cell imaging using the IncuCyte kinetic imaging system. Relative confluence of cells expressing wild-type DYRK1A or kinase-deficient DYRK1A-K188R and the number of GFP-positive cells were automatically evaluated using the IncuCyte software at 24 h and 96 h of doxycycline treatment. Untreated cells served as control. Confluence (D) and cell counts (E) after 96 h were standardized to the 24-h values (means + SD, n = 4 independent experiments). (F) Analysis of apoptosis in SH-SY5Y cells that were treated with doxycycline and harmine under the same conditions as in (A and C). Total protein was extracted after 72 h of treatment and analyzed for PARP activation by western blotting. Cells treated with staurosporine for 24 h served as positive control (F and G). Cleaved and activated PARP is indicated by an asterisk. GAPDH served as loading control. Statistical significance was tested with one-sample t test if comparing columns to normalized control (A–C) or one-way ANOVA and Bonferroni post-test if comparing multiple not-normalized columns (C). Kruskal–Wallis-test + Dunn multiple comparison post-test (D) and Student t test (E) were used. *P ≤ 0.05; **P ≤ 0.01; n.s, not significant.
None
Figure 2. DYRK1A overexpression induces G1/0 cell cycle arrest of SH-SY5Y cells. (A) Flow cytometry. Representative plots of SH-SY5Y cells after DNA staining with propidium iodide (PI). Overexpression of DYRK1A (upper panel) or DYRK1A-K188R (lower panel) was induced with 2 µg/ml doxycycline (Dox). For comparison, cell differentiation was induced with 10 µM retinoic acid (RA). Column diagrams show the cell cycle phase distribution 24 h (B) or 72 h (C) after induction of DYRK1A overexpression or RA-induced differentiation. The left panels show the quantitative evaluation of representative experiments. The right panels summarize the results of 3 independent experiments (means + SD). *P ≤ 0.05; **P ≤ 0.01; ***P ≤ 0.001; analyzed by one-way ANOVA + Bonferroni post-test comparing DYRK1A or DYRK1A-K188R data to the respective untreated controls.
None
Figure 3. DYRK1A overexpression induces cell cycle exit of SH-SY5Y cells. For 2-dimensional analyses of cellular DNA and RNA and contents, SH-SY5Y cells were stained with Hoechst 33342 and pyronin Y (PY). DNA and RNA contents were analyzed by flow cytometry after 5 d of treatment with doxycycline (Dox), 10 µM RA only, or treatment with 10 µM RA followed by 50 ng/ml BDNF. Representative plots of one experiment (A), quantification of cells in G1/0- and G2-phase in this experiment (B) and the evaluation of average cell counts in G0-phase of 3 independent experiments (C). The cell population with 4n DNA content and low RNA staining is referred to as sub-G2. Means + SD; *P ≤ 0.05; **P ≤ 0.01; ***P ≤ 0.001; analyzed by 1-way ANOVA + Bonferroni post-test comparing DYRK1A or DYRK1A-K188R data to the respective untreated controls.
None
Figure 4. DYRK1A overexpression induces neurite outgrowth of SH-SY5Y cells. (A) Fluorescence microscopic analysis of actin labeling. Cells were plated on coverslips and DYRK1A (upper panels) or DYRK1A-K188R overexpression (lower panels) was induced with 2 µg/ml doxycycline (Dox) (b). As positive control, cells were differentiated with 10 µM RA solely (c) or with 10 µM RA followed by 50 ng/ml BDNF (d). Control cells were left untreated (a). After 5 d cells were fixed and F-actin labeled with phalloidin-Alexa®-546 to visualize cellular processes. Nuclei were stained with DAPI. Scale bar = 20 µm. (a’–d’) show magnified cutouts of the respective images (a–d). Quantification of the average neurite lengths is illustrated in the column diagrams. Means + SEM; ***P ≤ 0.001; analyzed by 1-way ANOVA + Bonferroni post-test comparing DYRK1A or DYRK1A-K188R data to untreated controls. The number of measured neurites is indicated in each column. To exclude effects on neuritogenesis resulting from different cell densities, proliferation differences were compensated by plating adjusted cell numbers as described in the “Material and Methods” section. (B) Analysis of neuritogenesis using automated live cell microscopy. Overexpression of DYRK1A or DYRK1A-KR was induced with 2 µg/ml doxycycline (+dox). Total neurite length was quantified after 96 h using an IncuCyte kinetic imaging system with the integrated automated NeuroTrack image acquisition. Panels (a and b) show representative bright field images taken after 96 h with an overlay of the NeuroTrack analysis (red) and the automatically assessed count of GFP positive nuclei (yellow) as shown in (a’ and b’). Scale bar = 300 µm. The column diagram illustrates evaluation of total neurite length standardized to the total count of GFP-positive nuclei. Data are shown as means + SEM of 4 independent experiments and was analyzed using Student t test. ***, P ≤ 0.001.
None
Figure 5. DYRK1A overexpression upregulates neuronal markers in SH-SY5Y cells. (A) SH-SY5Y cells overexpressing DYRK1A or DYRK1A-K188R were treated with 2 µg/ml dox or 10 µM RA for 24 h before total RNA was extracted and analyzed by qRT-PCR. Tau and MAP2 mRNA levels were quantified relative to GAPDH mRNA. (B) Representative western blot of total protein extracts from SH-SY5Y cells 72 h after induction of DYRK1A overexpression or RA treatment. Migration of mass standards is indicated in kDa (left). (C) Densitometric evaluation of Tau and MAP2c immunoreactivity relative to GAPDH. n = 3, means + SD; *P ≤ 0.05; analyzed by one-way ANOVA + Bonferroni post-test to compare columns to none normalized controls (A) or one-sample t test to compare columns to normalized control (C).
None
Figure 7. DYRK1A overexpression has no effect on p27Kip1 mRNA level in SH-SY5Y cells. SH-SY5Y cells were treated with doxycycline or RA for 24 h (A) or 72 h (B) before p27Kip1 mRNA levels were analyzed by qRT-PCR. p27Kip1 mRNA levels are shown as relative quantification to GAPDH mRNA levels. n = 3, means + SD; **P ≤ 0.01; ***P ≤ 0.001, analyzed by 1-way ANOVA + Bonferroni post-test to compare DYRK1A or DYRK1A-K188R data with the respective untreated controls.
None
Figure 8. Phosphorylation of p27Kip1 and Cyclin D1 by DYRK1A in vitro and in cells. (A) In vitro kinase assay. Kinase assay with GFP-DYRK1A and GFP-DYRK1B immunoprecipitated from HeLa cells and subjected to a kinase assay with recombinant GST-p27Kip1. The phosphorylation reaction was started by ATP addition (+ ATP). No ATP addition served as negative control. (B) In vitro kinase assay with bacterial GST fusion proteins of DYRK1A or kinase-deficient DYRK1A-K188R and p27Kip1. Aliquots of the kinase reaction were taken at the indicated time points. Control lanes (c) were loaded only with GST-p27Kip1. The majority of GST-DYRK1A is isolated from E. coli as a catalytically active C-terminally truncated product (marked by an asterisk). (C) Phosphorylation of p27Kip1 by DYRK1A in HeLa cells. HeLa cells were transiently transfected with expression plasmids for p27Kip1, GFP-DYRK1A, and GFP-HIPK2 as indicated. To analyze p27Kip1 phosphorylation by endogenous DYRK1A, cells were treated with 1 µM of the DYRK1A inhibitor AnnH31 for 5 h before cell lysis. Total protein extracts then were analyzed for p27Kip1 phosphorylation by western blotting with the indicated antibodies. Relative phosphorylation of Ser10 is indicated below the bottom panel. GFP-HIPK2 was not resolved on this gel due to its large size. One representative blot from n = 3 each. (D) DYRK1A induces Cyclin D1 Thr286 phosphorylation independently of GSK3β. SH-SY5Y cells were treated with 0.5 µg/ml doxycycline (+dox) to induce DYRK1A overexpression. After 5 h, cells were additionally treated with the DYRK1A inhibitor leucettine L41 (1 µM) or the GSK3β inhibitor CHIR99021 (3 µM) for further 24 h before total cellular protein was analyzed by western blotting with the indicated antibodies. Stabilization of β catenin due to reduced GSK3β-mediated phosphorylation was used to validate GSK3β inhibition. The vertical line indicates where an irrelevant lane was deleted from the final image. Column diagrams show the densitometric quantification of Cyclin D1 Thr286 phosphorylation and total β catenin protein levels from 3 independent experiments.
None
Figure 9. Inhibition of DYRK1A decreases Ser10 phosphorylation of p27Kip1 in early differentiating mouse hippocampal neurons. Fluorescence microscopic analysis of p27Kip1 Ser10 phosphorylation in post-mitotic, differentiating mouse hippocampal neurons. Cells were cultured on coverslips in the presence of the DYRK1A inhibitors harmine (2 µM), EGCG (5 µM), or without inhibitor (control) for 20 h before cells were fixed and immunostained for pSer10 p27Kip1 (P-p27). F-actin was labeled with phalloidin-rhodamine. The upper panels show overlays of pSer10 p27Kip1 and phalloidin signals and the lower panels show pSer10 p27Kip1 only. Scale bar = 25 µm. One representative experiment is shown from n = 3.
None
Figure 10. Inhibition of DYRK1A decreases Ser10 phosphorylation of p27Kip1 in the embryonic mouse telencephalon. Confocal images of one hemisphere showing the telencephalon of E12 mouse embryos cultured for 6 h in the presence of the DYRK1A inhibitors harmine (4 µM), EGCG (10 µM), leucettine L41 (8 µM), or without inhibitor (control). Brain slices were stained for pSer10 p27Kip1 (P-p27) and β-III-tubulin (TUJ1) as indicated. The dorso–ventral (D-V) and medial–lateral (M-L) orientation is indicated. Scale bar = 200 µm. One representative experiment is shown from n = 3.

Similar articles

Cited by

References

    1. Frank CL, Tsai L-H. Alternative functions of core cell cycle regulators in neuronal migration, neuronal maturation, and synaptic plasticity. Neuron. 2009;62:312–26. doi: 10.1016/j.neuron.2009.03.029. - DOI - PMC - PubMed
    1. Salomoni P, Calegari F. Cell cycle control of mammalian neural stem cells: putting a speed limit on G1. Trends Cell Biol. 2010;20:233–43. doi: 10.1016/j.tcb.2010.01.006. - DOI - PubMed
    1. Hindley C, Philpott A. Co-ordination of cell cycle and differentiation in the developing nervous system. Biochem J. 2012;444:375–82. doi: 10.1042/BJ20112040. - DOI - PMC - PubMed
    1. Calegari F, Haubensak W, Haffner C, Huttner WB. Selective lengthening of the cell cycle in the neurogenic subpopulation of neural progenitor cells during mouse brain development. J Neurosci. 2005;25:6533–8. doi: 10.1523/JNEUROSCI.0778-05.2005. - DOI - PMC - PubMed
    1. Doetsch F, Verdugo JM-G, Caille I, Alvarez-Buylla A, Chao MV, Casaccia-Bonnefil P. Lack of the cell-cycle inhibitor p27Kip1 results in selective increase of transit-amplifying cells for adult neurogenesis. J Neurosci. 2002;22:2255–64. - PMC - PubMed

Publication types

MeSH terms