. 2014 Oct 15;31(20):1677-88.
doi: 10.1089/neu.2013.3252. Epub 2014 Jul 21.

CCR2 deficiency impairs macrophage infiltration and improves cognitive function after traumatic brain injury

Affiliations

CCR2 deficiency impairs macrophage infiltration and improves cognitive function after traumatic brain injury

Christine L Hsieh et al. J Neurotrauma. .

Abstract

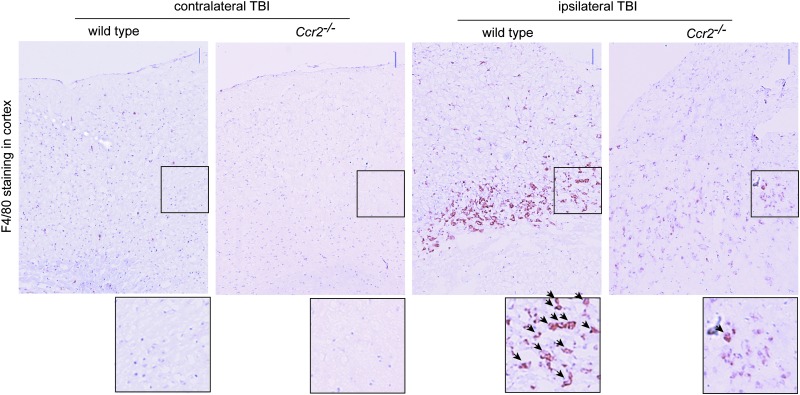
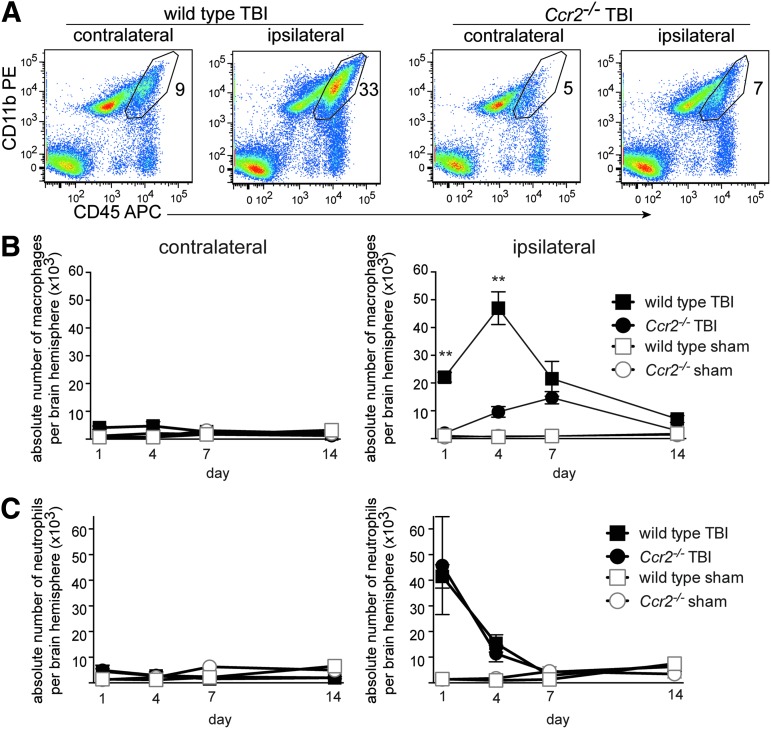
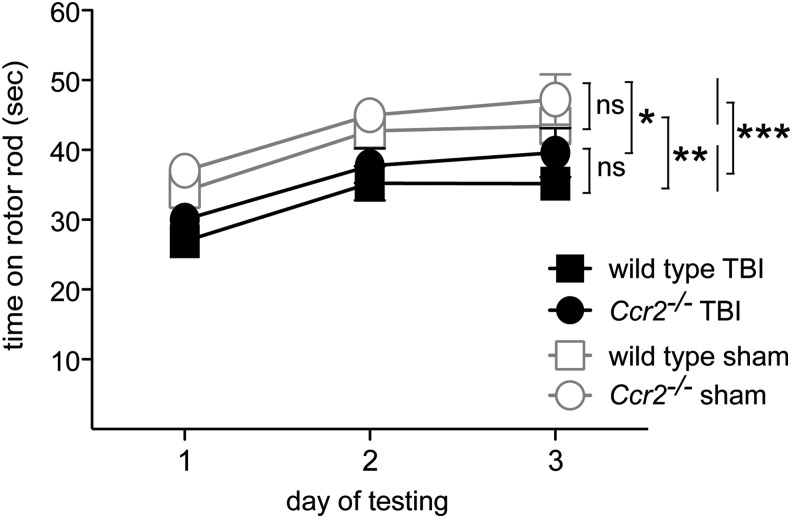
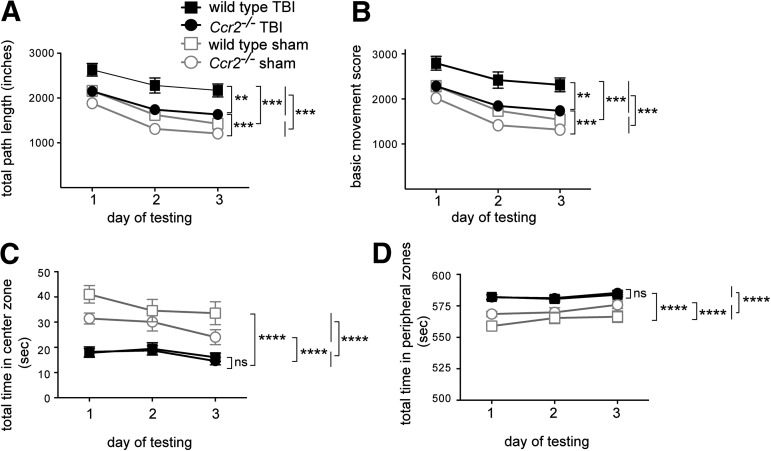
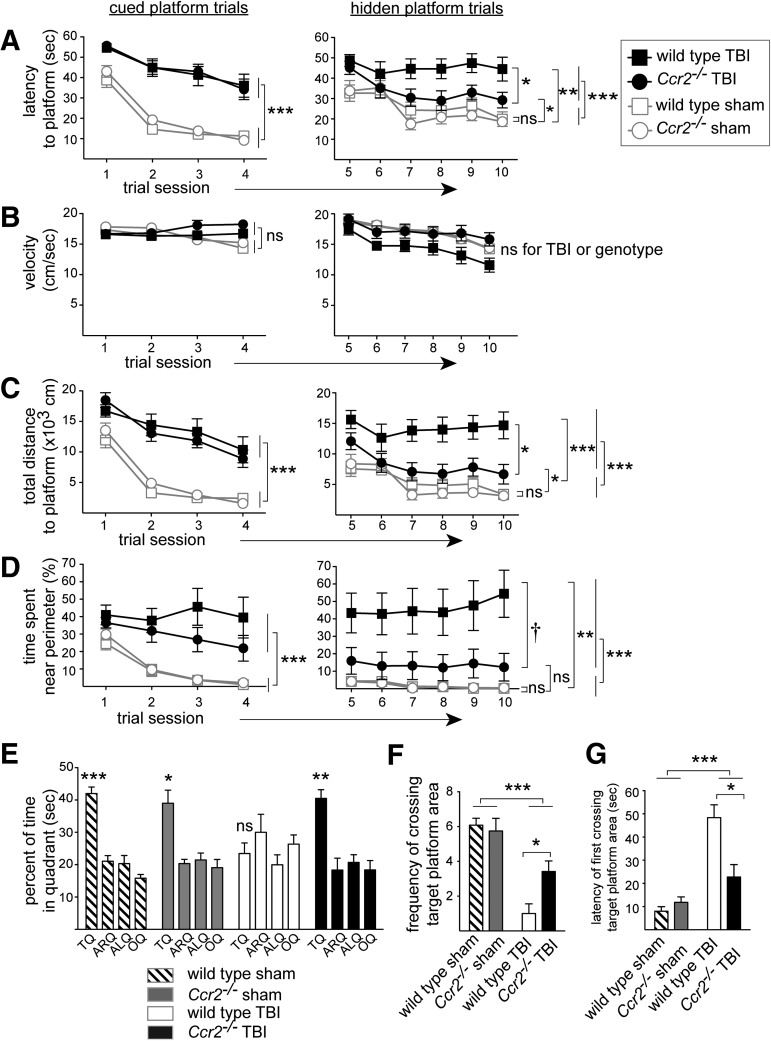
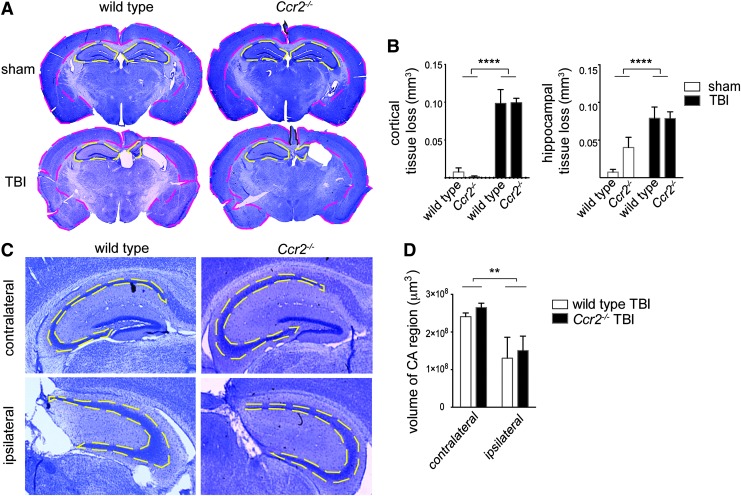
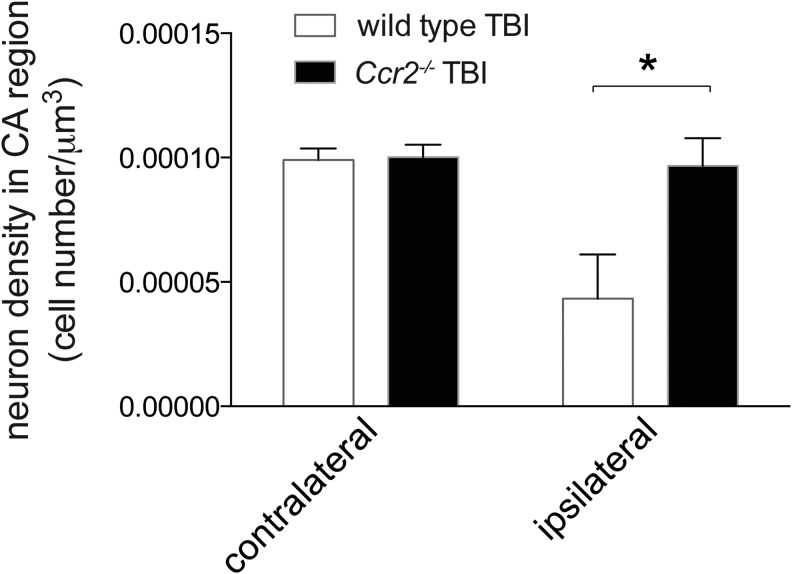
Traumatic brain injury (TBI) provokes inflammatory responses, including a dramatic rise in brain macrophages in the area of injury. The pathway(s) responsible for macrophage infiltration of the traumatically injured brain and the effects of macrophages on functional outcomes are not well understood. C-C-chemokine receptor 2 (CCR2) is known for directing monocytes to inflamed tissues. To assess the role of macrophages and CCR2 in TBI, we determined outcomes in CCR2-deficient (Ccr2(-/-)) mice in a controlled cortical impact model. We quantified brain myeloid cell numbers post-TBI by flow cytometry and found that Ccr2(-/-) mice had greatly reduced macrophage numbers (∼80-90% reduction) early post-TBI, compared with wild-type mice. Motor, locomotor, and cognitive outcomes were assessed. Lack of Ccr2 improved locomotor activity with less hyperactivity in open field testing, but did not affect anxiety levels or motor coordination on the rotarod three weeks after TBI. Importantly, Ccr2(-/-) mice demonstrated greater spatial learning and memory, compared with wild-type mice eight weeks after TBI. Although there was no difference in the volume of tissue loss, Ccr2(-/-) mice had significantly increased neuronal density in the CA1-CA3 regions of the hippocampus after TBI, compared with wild-type mice. These data demonstrate that Ccr2 directs the majority of macrophage homing to the brain early after TBI and indicates that Ccr2 may facilitate harmful responses. Lack of Ccr2 improves functional recovery and neuronal survival. These results suggest that therapeutic blockade of CCR2-dependent responses may improve outcomes following TBI.

Keywords: CCR2; brain injury; chemotaxis; inflammation; macrophage.


Figures

<b>FIG. 1.</b>
FIG. 1.
C-C-chemokine receptor 2-deficient (Ccr2−/−) mice show reduced presence of F4/80+cells near the injury site after traumatic brain injury (TBI). Brain sections from wild-type and Ccr2−/− mice 4 d after TBI were immunostained for F4/80 antigen (brown staining), a marker on macrophages and microglia. Sections were counterstained with hematoxylin (purple). Areas of the contralateral and ipsilateral cortex were imaged. Enlarged images of selected regions (boxed) are shown below. Arrows in insets point out F4/80+cells. n=3 animals per group. Scale bars indicate 50 μm. Color image is available online at www.liebertpub.com/neu
<b>FIG. 2.</b>
FIG. 2.
Early macrophage infiltration is markedly reduced in Ccr2−/− mice after traumatic brain injury (TBI). (A) Representative flow cytometry plots of brain cell preparations isolated from contralateral and ipsilateral brain hemispheres 4 d after TBI. Gated cells represent the proportion of CD45hi CD11b+cells identified as macrophages in the brain cell preparation. Ly6G+CD45hiCD11b+granulocyte cells were excluded from these plots (n=6–8 animals per group). (B) Absolute number of brain macrophages following TBI in contralateral and ipsilateral hemispheres in wild-type and Ccr2−/− mice sacrificed at 1, 4, 7, and 14 d after surgery (mean±standard error of the mean) was assessed. Two-way ANOVA for main effects of genotype and TBI was conducted at each time point. The main effect of genotype was significant at days 1 and 4, F(1,20)=13.9, **p=0.001, and F(1,18)=15.1,**p=0.001, respectively. The effect of TBI on mean macrophage number was also significant at days 1 and 4, F(1,20)=16.4, p=0.0006, and F(1,18)=33.4, p<0.0001. A significant interaction effect was found on days 1 and 4, F(1,20)=12.4, p=0.002, and F(1,19)=15.5, p=0.001), indicating the effect of injury on mean macrophage number was greater among wild-type mice than among Ccr2−/− mice. However, on days 7 and 14, there were neither significant interaction effects nor main effects of genotype, although there were significant main effects of TBI, F(1,9)=12.6, p=0.006, and F(1,14)=5.16, p=0.039, for day 7 and day 14, respectively). Group sizes for wild-type TBI groups in B and C are as follows: day 1, n=14; day 4, n=8; day 7, n=4; and day 14, n=8). Group sizes for Ccr2−/− TBI mice are: day 1, n=5; day 4, n=6; day 7, n=5; day 14, n=6. Sham group sizes for all time points are 2 to 4. (C) Absolute number of neutrophils in the brain following TBI in contralateral and ipsilateral hemispheres was assessed. Although significant effects of TBI were found on days 1 and 4, F(1,18)=10.8, p=0.004, and F(1,18)=13.9, p=0.002, respectively, there were no significant effects of interaction or genotype at any time point. Color image is available online at www.liebertpub.com/neu
<b>FIG. 3.</b>
FIG. 3.
Ccr2−/− and wild-type animals show similar motor function deficiency in rotarod tests three weeks after TBI. Average fall latencies during a 3-d rotarod test of wild-type and Ccr2−/− mice after TBI or sham surgery±standard error of the mean (n=20/group). All mice exhibited motor learning as evidenced by progressively increasing latency on the rod over 3 d. Although TBI induced impairment in the rotarod performance, compared with sham controls (***p<0.0001; Ccr2−/−, *p<0.05; wild-type, **p<0.01), there was no significant difference in latency between the wild-type and Ccr2−/− mice with TBI (post hoc test, p>0.2).
<b>FIG. 4.</b>
FIG. 4.
Deficiency in CCR2 partially rescues traumatic brain injury (TBI)-induced hyperactivity in the novel open field test. The open field test was performed over three consecutive days to test mice three weeks post-TBI (mean±SEM, n=20/group). (A) TBI-induced a hyperactive phenotype as shown by increased path length, compared with sham controls (***p<0.0001; post hoc test, **p<0.005). Lack of CCR2 improved hyperactivity levels in TBI mice, and to a lesser degree in sham-operated mice, compared with wild-type mice (post hoc test, **p<0.001). (B) TBI increased basic movement scores, compared with sham controls (***p<0.0001; post hoc test, **p<0.005). CCR2 deficiency improved hyperactivity after TBI, compared with wild-type mice (**p<0.005). (C) TBI-induced anxiety in mice as shown by reduced time spent in the center zone of the open field, compared with sham controls (****p<0.0001). CCR2 deficiency did not affect the time spent in the center zone after TBI, compared with wild-type TBI mice (p>0.05). (D) TBI-induced anxiety in mice as shown by increased time spent in the peripheral zones of the open field (****p<0.0001). CCR2 deficiency did not affect the time spent in the peripheral zones after TBI (p>0.05).
<b>FIG. 5.</b>
FIG. 5.
Ccr2−/− mice demonstrate improved spatial memory and learning following traumatic brain injury (TBI). The Morris water maze was used to assess cognitive function eight weeks following TBI (n=12/group). Animals were trained to locate a cued platform for 2 d (A–D, left column), and a hidden platform for 3 d (A–D, right column). Cued platform graphs show statistical results for the effect of TBI. Hidden platform graphs show statistical results for the effect of TBI and post-hoc analyses, and when a genotype effect achieved significance in a repeated measure analyses of variance with post-hoc analyses. Mean±standard error of the mean is shown. (A) TBI prolonged the time (latency) to reach the platform (***p<0.001). For the hidden platform trials, the Ccr2−/− TBI group performed better than the wild-type TBI group by finding the hidden platform quicker (post hoc test, *p<0.05). (B) Swim velocity for all animal groups were statistically identical. (C) TBI increased the animals' total distance from the platform during the trials (***p<0.001). For the hidden platform trials, the Ccr2−/− TBI group performed better than the wild-type TBI group by being closer to the hidden platform at all times (post hoc test, *p<0.05). (D) TBI induced thigmotaxic behavior as shown by increased time spent near the perimeter during the platform search (***p<0.001). For the hidden platform trials, the Ccr2−/− TBI group showed decreased thigmotaxic behavior, compared with the wild-type TBI group, as indicated by reduced time spent near the perimeter (post hoc test, †p=0.05), indicating that Ccr2−/− mice had improved spatial learning and more productive search strategies post-TBI, compared with wild-type mice. (E) Ccr2−/− mice had improved memory retention as assessed during a probe trial of the Morris water maze. The percent of time spent searching in each quadrant of the pool is shown. Sham groups and the Ccr2−/− TBI group preferentially searched in the target quadrant, while the wild-type TBI group failed this test (most stringent student's t-test result: wild-type sham, ***p<0.001;, Ccr2−/− sham, *p<0.05; wild-type TBI, p>0.05; Ccr2−/− TBI, **p<0.01). (F) TBI impaired memory retention as assessed by the animals' crossing frequency over the area of the target platform during a probe trial (***p<0.0001). Ccr2−/− TBI mice crossed the target platform area more frequently, compared with wild-type TBI mice (post hoc test, *p<0.05). (G) TBI delayed the first encounter to the target platform position during the probe trial (***p<0.0001). Ccr2−/− TBI mice came across the target platform location much sooner than wild-type TBI mice (post hoc test, *p<0.05).
<b>FIG. 6.</b>
FIG. 6.
Ccr2−/− and wild-type mice have similar levels of tissue loss and hippocampal volume after traumatic brain injury (TBI). (A) Brains from wild-type and Ccr2−/− animals nine weeks after sham or TBI surgery were sectioned and stained with cresyl violet. Representative low-power images shown (20×) are from approximately 1.82 mm posterior from the bregma point. Contralateral (left) and ipsilateral (right) cortical (pink dashed lines) and hippocampal areas (yellow dashed lines) were traced in multiple sections per animal to estimate area. Area assessments were used to calculate the volume of each substructure (cortex or hippocampus). The tissue loss per brain substructure was calculated as a difference in volume between left and right substructures. (B) Quantification of tissue loss in sham and TBI animals of wild-type and Ccr2−/− mice. TBI animals demonstrated significant tissue loss in the cortex and hippocampus, F(1,21)=113.3, ****p<0.0001, and F(1, 21)=23.6, ****p<0.0001, however, there was no genotype effect or interaction effect. Lesion volume was calculated as (contralateral area − ipsilateral area)×0.24 mm3. Groups sizes for sham controls were n=5–6, for wild-type TBI mice n=5, and for Ccr2−/− TBI mice n=9. (C) The volume of the collective CA (CA1-CA3) adjacent to the TBI lesion in wild-type and Ccr2−/− mice was assessed nine weeks post-TBI (mean±standard error of the mean). Images are representative cresyl violet stained brain sections of the hippocampus at approximately−2.30 mm posterior of the bregma. Yellow dashed lines indicate the CA region. (D) Ccr2−/− and wild-type mice have similar volumes of CA1-CA3 after TBI. TBI decreased the volume of the CA region on the ipsilateral side, compared with the contralateral side, F(1,16)=10.5, **p=0.005, but there was no effect of genotype or interaction (p>0.05). n=5 animals per group.
<b>FIG. 7.</b>
FIG. 7.
Ccr2−/− preserves neuronal density in the hippocampal CA region after traumatic brain injury (TBI). Stereological assessment of neuronal density in the hippocampal CA1-CA3 regions adjacent to the TBI-induced cavity in contralateral and ipsilateral sides nine weeks after TBI was performed. CCR2-deficient mice had preserved neuronal density in the ipsilateral side, compared with wild-type mice after TBI. Two-way analysis of variance results show a significant interaction (p=0.03). There were significant effects of genotype and TBI on neuronal density, F(1,16)=6.2, *p=0.02, and F(1,16)=7.3, p=0.01, respectively). These data indicate that injury had a greater effect on wild-type mice than Ccr2−/− mice. n=5 animals per group.

References

    1. Potts M.B., Koh S.E., Whetstone W.D., Walker B.A., Yoneyama T., Claus C.P., Manvelyan H.M., and Noble-Haeusslein L.J. (2006). Traumatic injury to the immature brain: inflammation, oxidative injury, and iron-mediated damage as potential therapeutic targets. NeuroRx 3, 143–153 - PMC - PubMed
    1. Jain K.K. (2008). Neuroprotection in traumatic brain injury. Drug Discov. Today 13, 1082–1089 - PubMed
    1. Okie S. (2005). Traumatic brain injury in the war zone. N. Engl. J. Med. 352, 2043–2047 - PubMed
    1. Smith D.H., Johnson V.E., and Stewart W. (2013). Chronic neuropathologies of single and repetitive TBI: substrates of dementia? Nat. Rev. Neurol. 9, 211–221 - PMC - PubMed
    1. Gomez C.R., Boehmer E.D., and Kovacs E.J. (2005). The aging innate immune system. Curr. Opin. Immunol. 17, 457–462 - PubMed

Publication types

MeSH terms