. 2014 Sep-Oct;90(5):1126-35.
doi: 10.1111/php.12286. Epub 2014 May 26.

Combination of oral vitamin D3 with photodynamic therapy enhances tumor cell death in a murine model of cutaneous squamous cell carcinoma

Affiliations

Combination of oral vitamin D3 with photodynamic therapy enhances tumor cell death in a murine model of cutaneous squamous cell carcinoma

Sanjay Anand et al. Photochem Photobiol. 2014 Sep-Oct.

Abstract

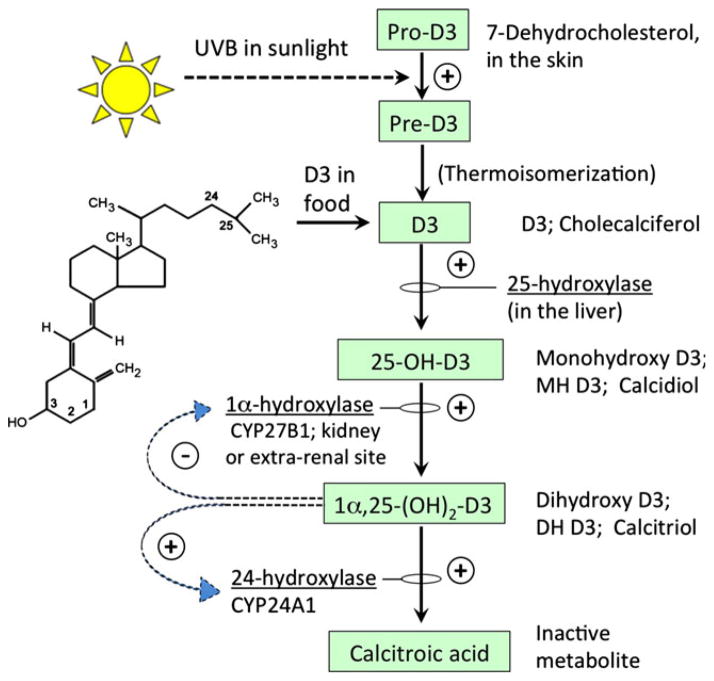
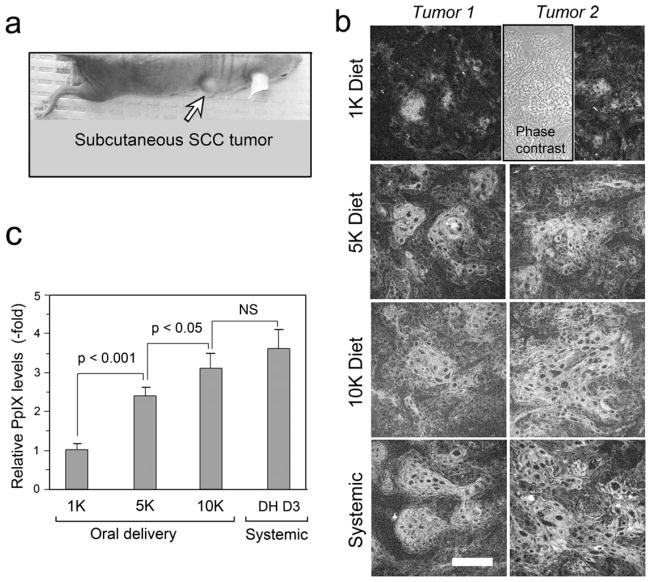
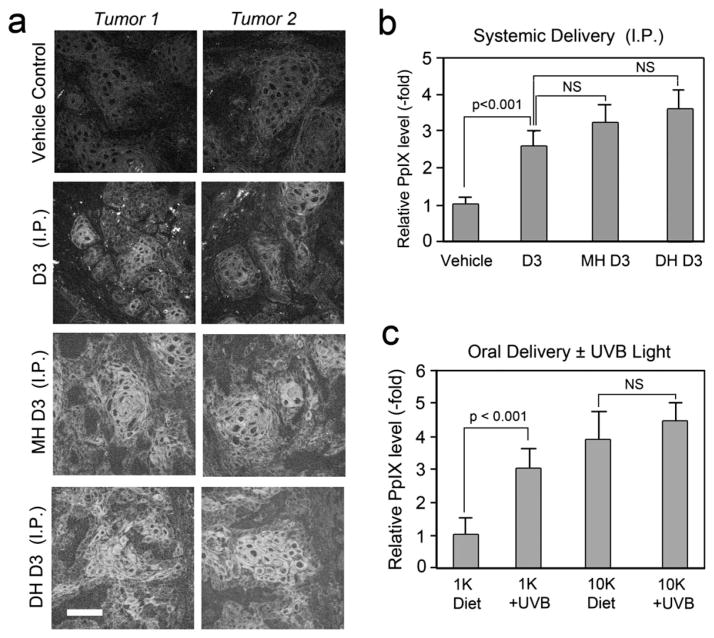
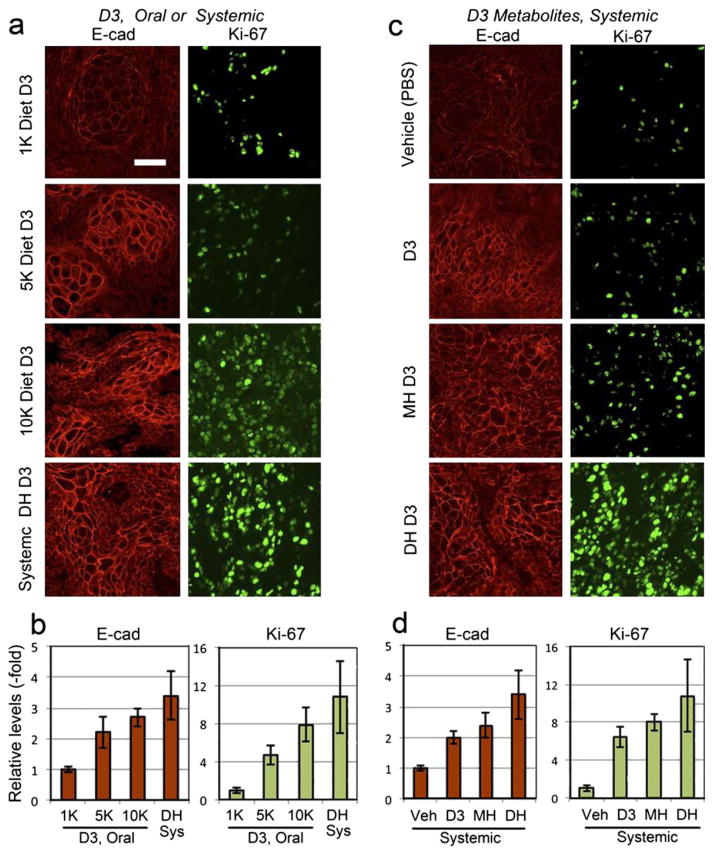
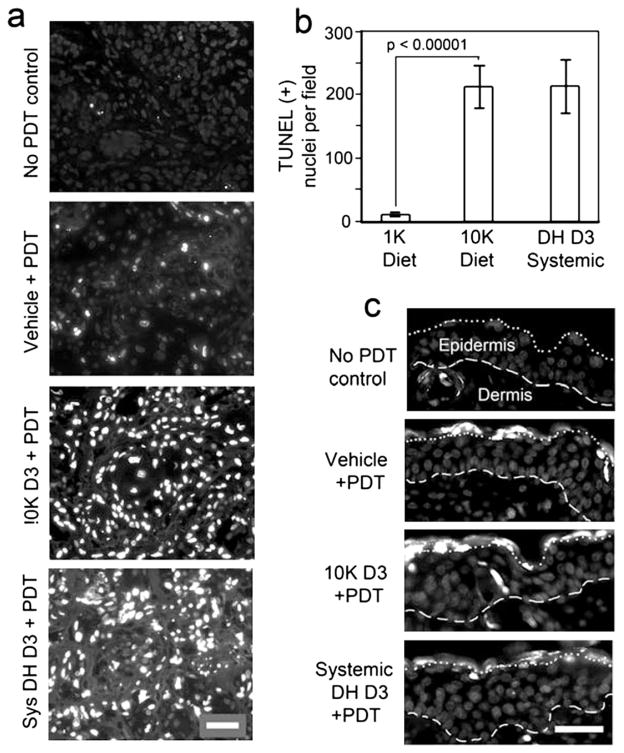
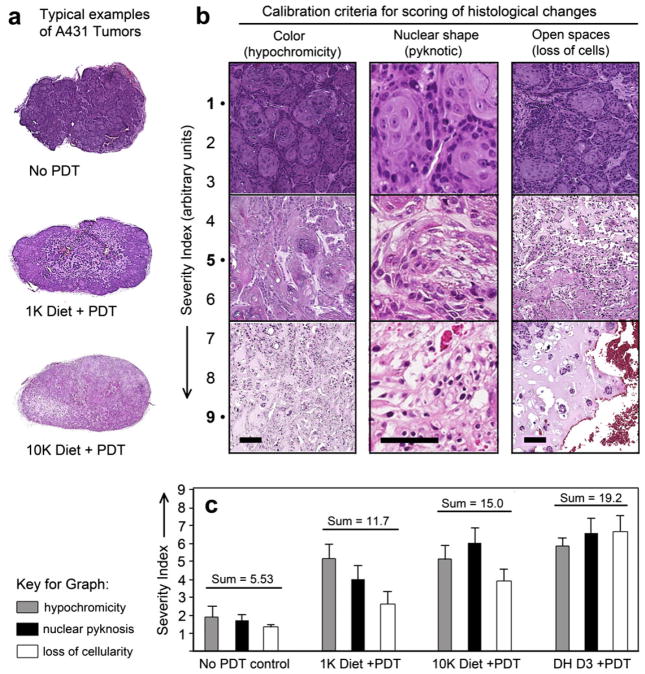
Photodynamic therapy (PDT), in which 5-ALA (a precursor for protoporphyrin IX, PpIX) is administered prior to exposure to light, is a nonscarring treatment for skin cancers. However, for deep tumors, ALA-PDT is not always effective due to inadequate production of PpIX. We previously developed and reported a combination approach in which the active form of vitamin D3 (calcitriol) is given systemically prior to PDT to improve PpIX accumulation and to enhance PDT-induced tumor cell death; calcitriol, however, poses a risk of hypercalcemia. Here, we tested a possible strategy to circumvent the problem of hypercalcemia by substituting natural dietary vitamin D3 (cholecalciferol; D3 ) for calcitriol. Oral D3 supplementation (10 days of a 10-fold elevated D3 diet) enhanced PpIX levels 3- to 4-fold, and PDT-mediated cell death 20-fold, in subcutaneous A431 tumors. PpIX levels and cell viability in normal tissues were not affected. Hydroxylated metabolic forms of D3 were only modestly elevated in serum, indicating minimal hypercalcemic risk. These results show that brief oral administration of cholecalciferol can serve as a safe neoadjuvant to ALA-PDT. We suggest a clinical study, using oral vitamin D3 prior to PDT, should be considered to evaluate this promising new approach to treating human skin cancer.


Figures

Figure 1
Figure 1
Metabolic pathway for vitamin D3 synthesis in mammals. Cholecalciferol (D3), its precursor (Pre-D3), and its downstream metabolites are shown within boxes. Enzymes that regulate each step are noted, and feedback regulation is indicated by the curved arrows [see references (–30) for details].
Figure 2
Figure 2
Analysis of PpIX levels in the murine A431 tumor model. (a), Photograph of A431 subcutaneous tumor on a nude mouse. (b), Examples of confocal images, showing PpIX in tumors either after 10 days of dietary pretreatment with a D3-supplemented diet (5 K or 10 K), or after a normal control diet (1 K), followed by 4 h of systemic ALA to induce PpIX synthesis. Systemic, a positive control in which calcitriol (1,25(OH)2-D3; dihydroxy-D3; DH D3) was given by i.p. injection at 1 μg kg−1 dose for 3 days, followed by ALA. Phase, A matching phase contrast image is shown in a representative panel to exhibit the tumor morphology. (c), Quantitation of PpIX-specific fiuorescence from digital images using IPLab software (see Methods). Mean ± SEM from 8–10 tumors per treatment group, three images per tumor, is shown. P values from an unpaired two-sided Student’s t-test are shown above the brackets. NS, not significant. Scale bar, 50 μm.
Figure 3
Figure 3
Effect of different metabolic forms of D3, and of UVB exposure, upon PpIX levels in tumors. (a), Confocal images showing PpIX levels in A431 tumors after 3 days of systemic pretreatment with D3, monohydroxy-D3 (MH D3), dihydroxy-D3 (DH D3), or saline as a vehicle control (i.p. delivery) followed by 4 h of ALA. Scale bar 50 μm. (b), Quantitation of PpIX-specific fiuorescence after systemic D3 analogs. Digital images were analyzed using IPLab software; mean ± SEM from three images from each of 4–8 tumors per treatment group. (c), Quantitation of PpIX with/without UVB irradiation. Mice with A431 tumors were fed a Vit D3 supplemented (10 K) or a normal (1 K) diet, and then exposed to low-dose UVB radiation to induce D3 synthesis (see Methods for details). Mean ± SEM of three images from each of three to four tumors per treatment group is shown. In both graphs, P values from unpaired two-sided t-test are shown above the brackets.
Figure 4
Figure 4
Physiological differentiation and proliferation responses to D3 preconditioning in A431 tumors. (a, c) Images of paraffin sections from A431 tumors, immunostained with antibodies to: a differentiation marker, E-cadherin (E-Cad), or a proliferation marker, Ki-67, following dietary and systemic supplementation with D3 or its metabolites. (b, d), Fluorescence from the secondary antibody probe was quantified in the corresponding graphs shown beneath the immunostained panels; mean ± SEM from three images from each of three to four tumors per treatment group. Scale bar 50 μm.
Figure 5
Figure 5
Photodynamic therapy (PDT)-induced cell death is preferentially enhanced by D3 pretreatment in A431 tumors. (a), TUNEL labeling of apoptotic nuclei at 24 h after PDT exposure (100 J cm−2) is enhanced by pretreatment with dietary (10 K D3) or systemic (DH D3), in comparison to the vehicle-pretreated group. (b), Quantitation of cell death in A431 tumors after preconditioning with dietary or systemic D3 followed by ALA-PDT. Note that the apoptosis-enhancing effect of dietary preconditioning is similar to that of systemic preconditioning. Mean ± SEM from three images from each of five to nine tumors per treatment group; P values from unpaired two-sided t-test is shown above the brackets. (c), Tumor specificity of D3 apoptotic enhancement. PDT-induced cell death in normal skin adjacent to the tumor was minimal, and very similar after pretreatment with D3 or DH D3 as after pretreatment with vehicle alone. Dashed line, basement membrane between dermis and epidermis. Dotted line, junction between stratum corneum (above) and viable epidermis (below). Scale bars 50 μm.
Figure 6
Figure 6
Tumor morphology at 24 h post-PDT, with or without D3 pretreatment. (a), H&E-stained images of whole A431 tumors, showing the overall effect of D3 pretreatment upon the histological appearance after PDT-induced damage. (b), Magnified areas, showing examples of a 9-point scale (Severity Index) that was used to rate each tumor in these experiments, using three criteria: Loss of staining color (hypochromicity); shrinkage of nuclei (pyknosis); and open, cell-free zones (loss of cellularity). Scale bars, 50 μm. (c). Quantitation of cell death in tumors using the 9-point severity index. All specimens were scored by three independent observers, and the results pooled (mean ± SEM from three images each from six to eight tumors per treatment group). Note the increase in all three parameters following ALA-PDT and further increase after combination with Vit D3 prior to ALA-PDT. The sum of all three parameters is shown above each experimental condition.

References

    1. Rogers HW, Weinstock MA, Harris AR, Hinckley MR, Feldman SR, Fleischer B, Coldiron BM. Incidence estimate of nonmelanoma skin cancer in the United States, 2006. Arch Dermatol. 2010;146:283–287. - PubMed
    1. Donaldson MR, Coldiron BM. No end in sight: the skin cancer epidemic continues. Semin Cutan Med Surg. 2011;30:3–5. - PubMed
    1. Anand S, Ortel BJ, Pereira SP, Hasan T, Maytin EV. Biomodulatory approaches to photodynamic therapy for solid tumors. Cancer Lett. 2012;326:8–16. - PMC - PubMed
    1. Hasan T, Ortel B, Solban N, Pogue BW. Photodynamic therapy of cancer. In: Kufe D, Bast R, Hait W, Hong W, Pollock R, Weichselbaum R, Holland J, Frei E, editors. Cancer Medicine. 7. BC Decker, Inc; Hamilton, ON: 2006. pp. 537–548.
    1. Ortel B, Shea CR, Calzavara-Pinton P. Molecular mechanisms of photodynamic therapy. Front Biosci. 2009;14:4157–4172. - PubMed

Publication types

MeSH terms

LinkOut - more resources