

MgcRacGAP interacts with cingulin and paracingulin to regulate Rac1 activation and development of the tight junction barrier during epithelial junction assembly
- PMID: 24807907
- PMCID: PMC4072573
- DOI: 10.1091/mbc.E13-11-0680
MgcRacGAP interacts with cingulin and paracingulin to regulate Rac1 activation and development of the tight junction barrier during epithelial junction assembly
Abstract
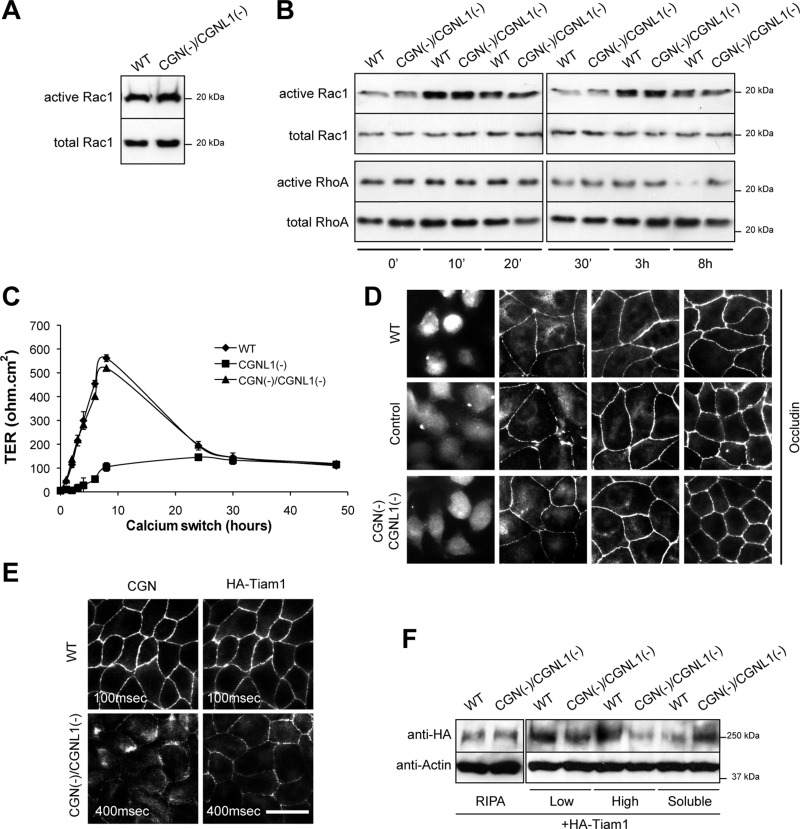
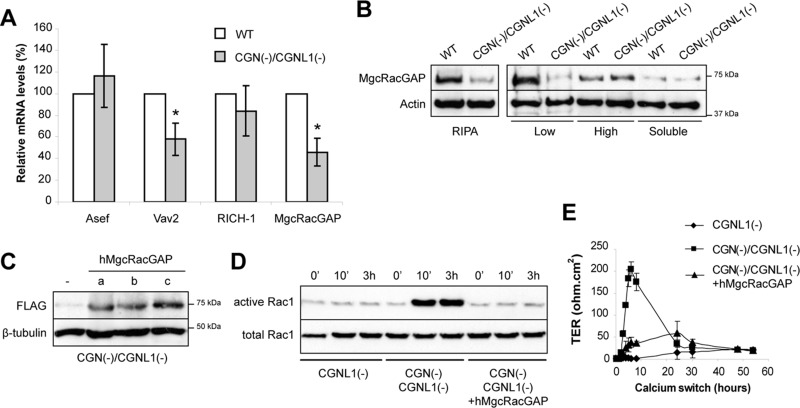
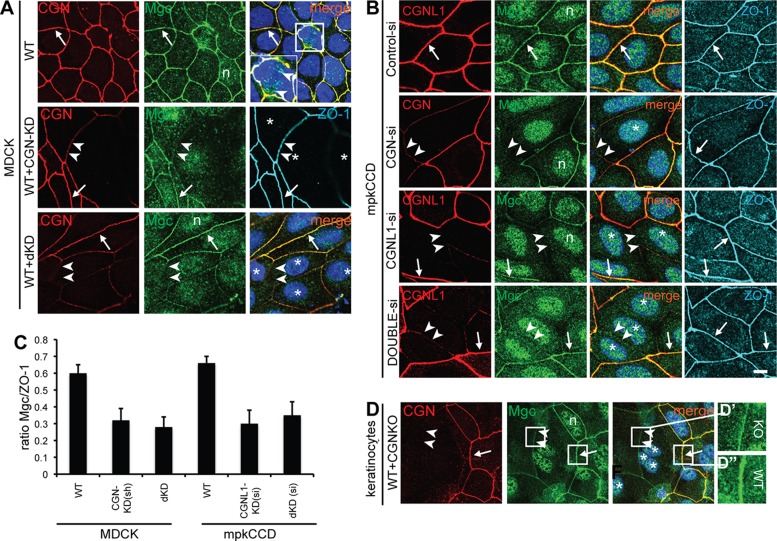
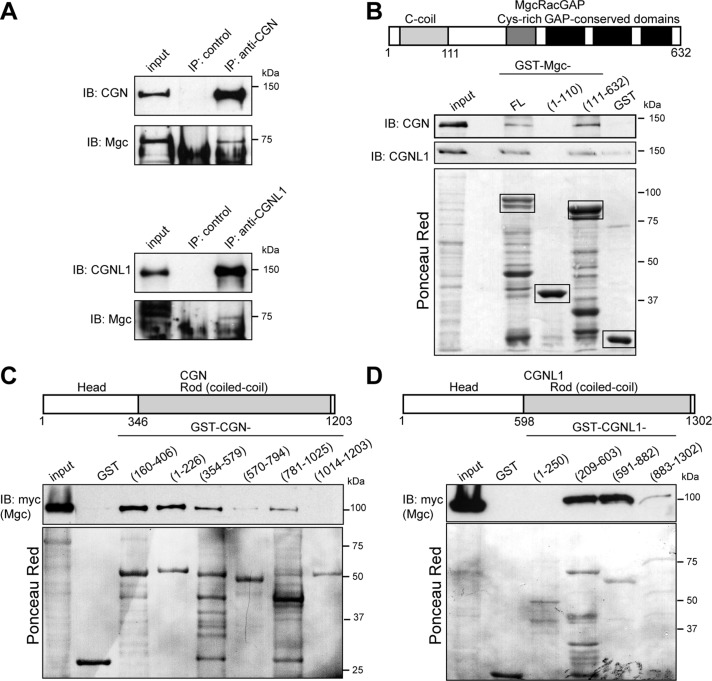
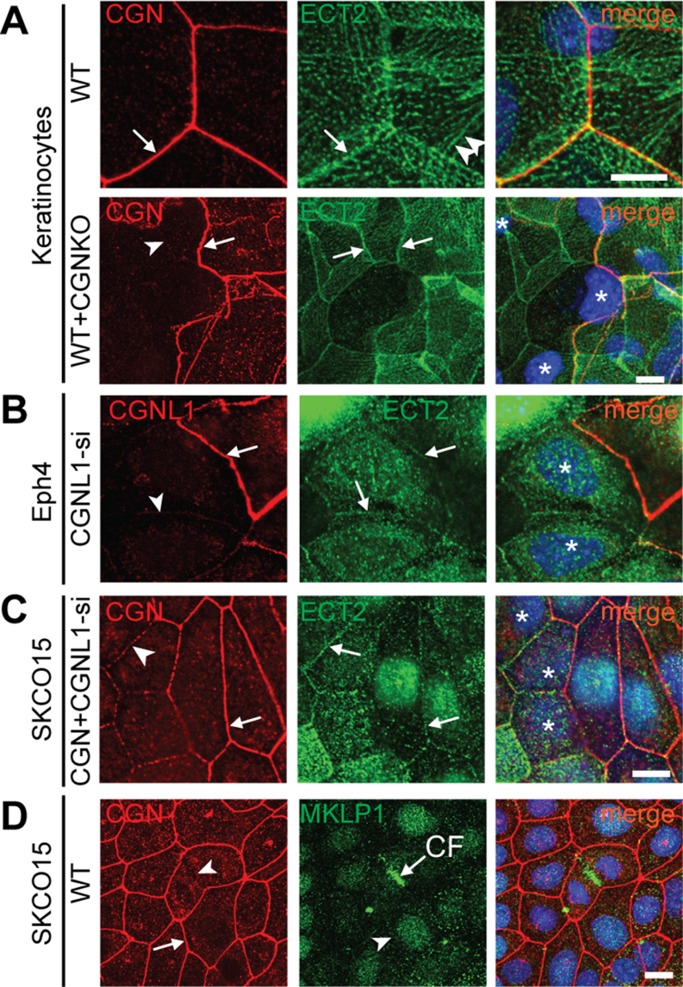
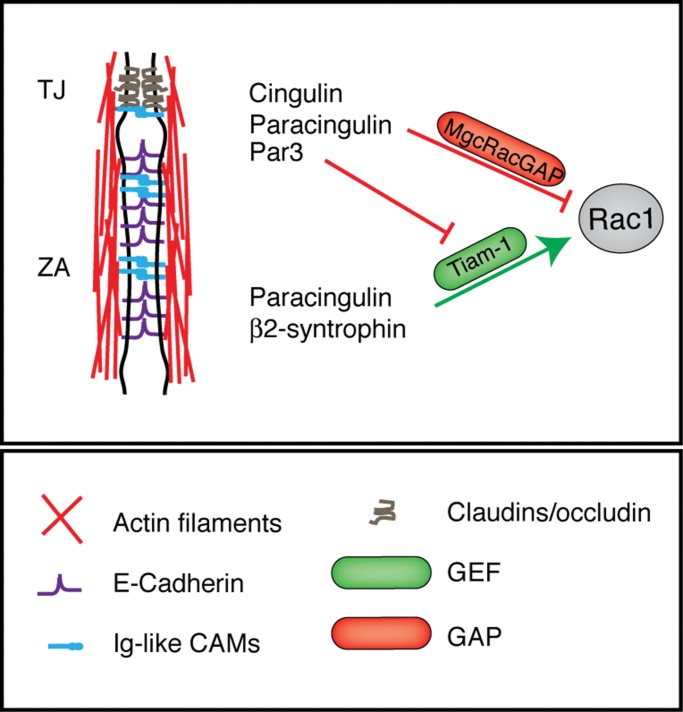
The regulation of Rho-family GTPases is crucial to direct the formation of cell-cell junctions and tissue barriers. Cingulin (CGN) and paracingulin (CGNL1) control RhoA activation in epithelial cells by interacting with RhoA guanidine exchange factors. CGNL1 depletion also inhibits Rac1 activation during junction assembly. Here we show that, unexpectedly, Madin-Darby canine kidney epithelial cells depleted of both CGN and CGNL1 (double-KD cells) display normal Rac1 activation and tight junction (TJ) formation, despite decreased junctional recruitment of the Rac1 activator Tiam1. The expression of the Rac1 inhibitor MgcRacGAP is decreased in double-KD cells, and the barrier development and Rac1 activation phenotypes are rescued by exogenous expression of MgcRacGAP. MgcRacGAP colocalizes with CGN and CGNL1 at TJs and forms a complex and interacts directly in vitro with CGN and CGNL1. Depletion of either CGN or CGNL1 in epithelial cells results in decreased junctional localization of MgcRacGAP but not of ECT2, a centralspindlin-interacting Rho GEF. These results provide new insight into coordination of Rho-family GTPase activities at junctions, since apical accumulation of CGN and CGNL1 at TJs during junction maturation provides a mechanism to spatially restrict down-regulation of Rac1 activation through the recruitment of MgcRacGAP.
© 2014 Guillemot et al. This article is distributed by The American Society for Cell Biology under license from the author(s). Two months after publication it is available to the public under an Attribution–Noncommercial–Share Alike 3.0 Unported Creative Commons License (http://creativecommons.org/licenses/by-nc-sa/3.0).
Figures
Similar articles
-
Epithelial junctions and Rho family GTPases: the zonular signalosome.Small GTPases. 2014;5(4):1-15. doi: 10.4161/21541248.2014.973760. Small GTPases. 2014. PMID: 25483301 Free PMC article. Review.
-
Knock Out of CGN and CGNL1 in MDCK Cells Affects Claudin-2 but Has a Minor Impact on Tight Junction Barrier Function.Cells. 2023 Aug 5;12(15):2004. doi: 10.3390/cells12152004. Cells. 2023. PMID: 37566083 Free PMC article.
-
Paracingulin regulates the activity of Rac1 and RhoA GTPases by recruiting Tiam1 and GEF-H1 to epithelial junctions.Mol Biol Cell. 2008 Oct;19(10):4442-53. doi: 10.1091/mbc.e08-06-0558. Epub 2008 Jul 23. Mol Biol Cell. 2008. PMID: 18653465 Free PMC article.
-
Cingulin, paracingulin, and PLEKHA7: signaling and cytoskeletal adaptors at the apical junctional complex.Ann N Y Acad Sci. 2012 Jun;1257:125-32. doi: 10.1111/j.1749-6632.2012.06506.x. Ann N Y Acad Sci. 2012. PMID: 22671598 Review.
-
Cingulin binds to the ZU5 domain of scaffolding protein ZO-1 to promote its extended conformation, stabilization, and tight junction accumulation.J Biol Chem. 2022 Apr;298(4):101797. doi: 10.1016/j.jbc.2022.101797. Epub 2022 Mar 5. J Biol Chem. 2022. PMID: 35259394 Free PMC article.
Cited by
-
Cingulin and actin mediate midbody-dependent apical lumen formation during polarization of epithelial cells.Nat Commun. 2016 Aug 3;7:12426. doi: 10.1038/ncomms12426. Nat Commun. 2016. PMID: 27484926 Free PMC article.
-
The ACE2 Receptor for Coronavirus Entry Is Localized at Apical Cell-Cell Junctions of Epithelial Cells.Cells. 2022 Feb 11;11(4):627. doi: 10.3390/cells11040627. Cells. 2022. PMID: 35203278 Free PMC article.
-
Shared mechanisms regulate spatiotemporal RhoA-dependent actomyosin contractility during adhesion and cell division.Small GTPases. 2020 Mar;11(2):113-121. doi: 10.1080/21541248.2017.1366966. Epub 2017 Dec 31. Small GTPases. 2020. PMID: 29291271 Free PMC article. Review.
-
RhoGTPases, actomyosin signaling and regulation of the epithelial Apical Junctional Complex.Semin Cell Dev Biol. 2014 Dec;36:194-203. doi: 10.1016/j.semcdb.2014.09.003. Epub 2014 Sep 16. Semin Cell Dev Biol. 2014. PMID: 25223584 Free PMC article. Review.
-
TSC1 regulates osteoclast podosome organization and bone resorption through mTORC1 and Rac1/Cdc42.Cell Death Differ. 2018 Sep;25(9):1549-1566. doi: 10.1038/s41418-017-0049-4. Epub 2018 Jan 22. Cell Death Differ. 2018. PMID: 29358671 Free PMC article.
References
-
- Aijaz S, D'Atri F, Citi S, Balda MS, Matter K. Binding of GEF-H1 to the tight junction-associated adaptor cingulin results in inhibition of Rho signaling and G1/S phase transition. Dev Cell. 2005;8:777–786. - PubMed
-
- Ban R, Irino Y, Fukami K, Tanaka H. Human mitotic spindle-associated protein PRC1 inhibits MgcRacGAP activity toward Cdc42 during the metaphase. J Biol Chem. 2004;279:16394–16402. - PubMed
Publication types
MeSH terms
Substances
LinkOut - more resources
Full Text Sources
Other Literature Sources
Research Materials
