

Risk of adverse health outcomes with increasing duration and regularity of opioid therapy
- PMID: 24808111
- PMCID: PMC6660001
- DOI: 10.3122/jabfm.2014.03.130290
Risk of adverse health outcomes with increasing duration and regularity of opioid therapy
Abstract
Purpose: The purpose of this study was to examine trends in frequency and daily dosage of opioid use and related adverse health outcomes in a commercially insured population.
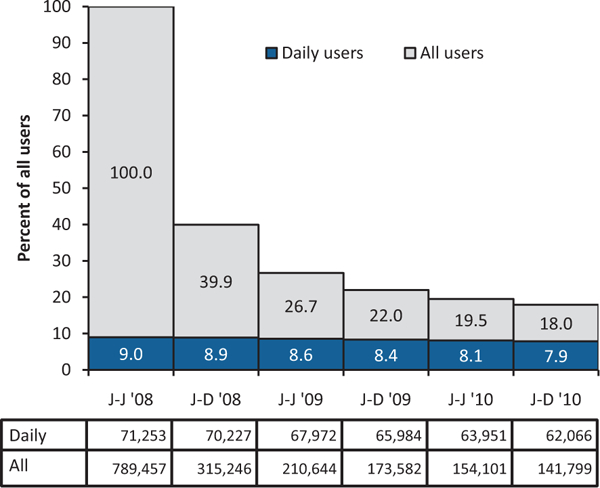
Methods: We examined medical claims from the Truven Health MarketScan commercial claims database for 789,457 continuously enrolled patients ages 18 to 64 years to whom opioids were dispensed during the first half of 2008. We tracked them every 6 months until either opioid use was discontinued or the end of 2010. We compared outcomes among all opioid users with those for patients who used opioids with only limited interruptions during the index period, referred to as "daily users." We contrasted the experience of daily users, other users, and nonusers for various outcomes.
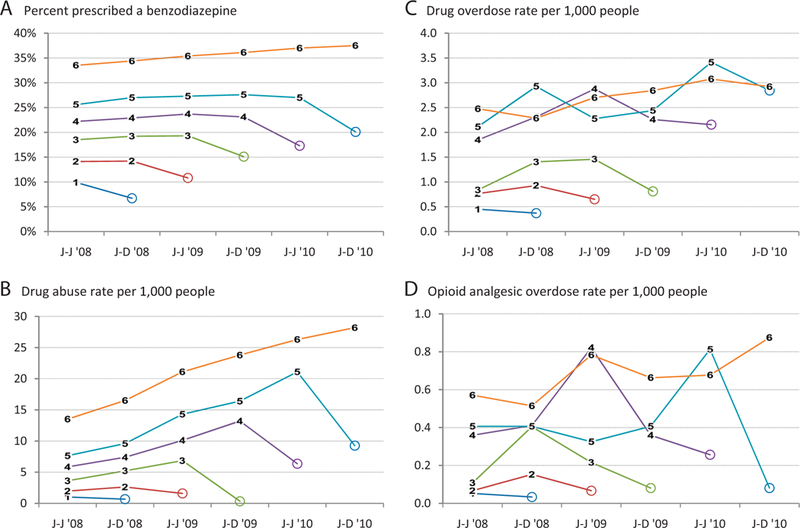
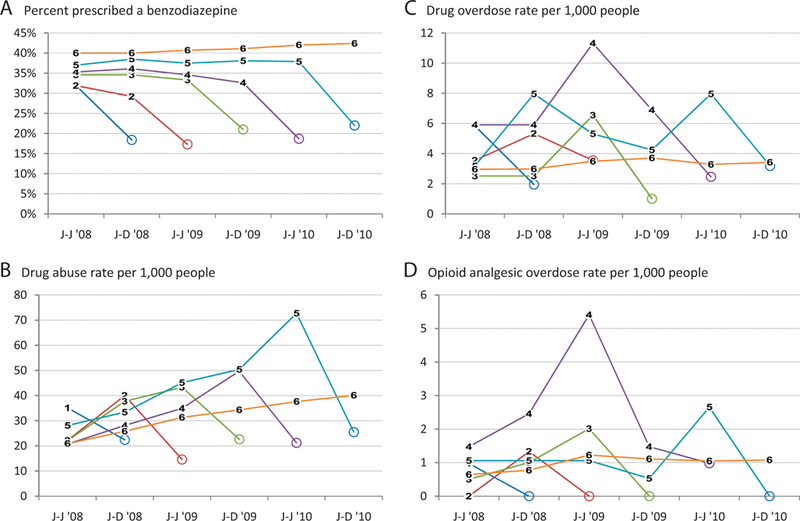
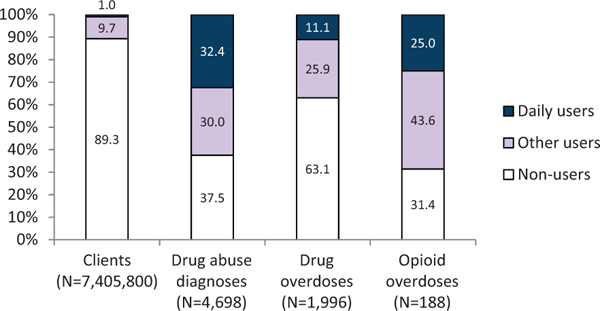
Results: Of all claimants, 10.7% had at least one opioid prescription during the first 6 months of 2008. Of these, 39.9% continued through a second 6-month period, and 18.0% continued through the end of 2010. Only 9.0% of all users qualified as daily users, but 87.1% of them continued some use of opioids through the end of 2010. Only 43.8% of all users who continued use through 2010 initially qualified as daily users. Among all users who continued use through 2010, days of use and daily dosage increased with duration of use. Among daily users, only dosage increased, rising from 101 to 114 morphine milligram equivalents/day over the 3 years. The prevalence of benzodiazepine use was greater for daily than all users, exceeding 40% among daily users who continued opioid use for 3 years. Drug abuse and overdose rates increased with longer use. Daily users accounted for 25.0%, other users for 43.6%, and nonusers for 31.4% of opioid analgesic overdoses.
Conclusions: Adverse health outcomes can increase with accumulating opioid use and increasing dosage. Existing guidelines developed by specialty societies for managing patients using opioids daily or nearly daily do not address the larger number of patients who use opioids intermittently over periods of years. Practitioners should consider applying such guidelines to patients who use opioids less frequently.
Keywords: Analgesics; Drug Abuse; Pain Management; Poisoning.
Conflict of interest statement
Figures
References
-
- Compton WM, Volkow ND. Major increases in opioid analgesics abuse in the United States: concerns and strategies. Drug Alcohol Depend 2006;81: 103–7. - PubMed
-
- The use of medicines in the United States: review of 2011. Parsippany, NJ: IMS Institute for Healthcare Informatics; 2012. Available from: http://www.imshealth.com/ims/Global/Content/Insights/IMS%20Institute%20f... Accessed March 11, 2014.
-
- Roe CM, McNamara AM, Motheral BR. Gender- and age-related prescription drug use patterns. Ann Pharmacother 2002;36:30–9. - PubMed
Publication types
MeSH terms
Substances
Grants and funding
LinkOut - more resources
Full Text Sources
Other Literature Sources