Deletion of CD24 impairs development of heat shock protein gp96-driven autoimmune disease through expansion of myeloid-derived suppressor cells
- PMID: 24808359
- PMCID: PMC4185284
- DOI: 10.4049/jimmunol.1302755
Deletion of CD24 impairs development of heat shock protein gp96-driven autoimmune disease through expansion of myeloid-derived suppressor cells
Abstract
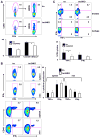
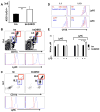
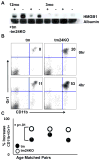
CD24 binds to and suppresses inflammation triggered by danger-associated molecular patterns such as heat shock proteins (HSPs) and high-mobility group box 1. Paradoxically, CD24 has been shown to enhance autoimmune disease. In this study, we attempt to reconcile this paradox by deletion of CD24 (24KO) in a lupus-like disease model driven by forced expression of HSP gp96 at the cell surface (transgenic mice [tm]). As expected, tm24KO mice showed increased CD11c(+) dendritic cell activation coupled to a significant increase in dendritic cell-specific IL-12 production compared with tm mice. However, tm24KO mice showed less CD4 T cell activation and peripheral inflammatory cytokine production in comparison with tm mice. We characterized an enhanced immune suppressive milieu in tm24KO mice distinguished by increased TGF-β and greater regulatory T cell-suppressive capacity. We found greater absolute numbers of myeloid-derived suppressor cells (MDSCs) in tm24KO mice and showed that the Ly6C(+) MDSC subset had greater suppressive capacity from tm24KO mice. Deletion of CD24 in tm mice led to diminished lupus-like pathology as evidenced by anti-nuclear Ab deposition and glomerulonephritis. Finally, we show that expanded MDSC populations were mediated by increased free high-mobility group box 1 in tm24KO mice. Thus, the deletion of CD24 in an HSP-driven model of autoimmunity led to the unexpected development of regulatory T cell and MDSC populations that augmented immune tolerance. Further study of these populations as possible negative regulators of inflammation in the context of autoimmunity is warranted.
Copyright © 2014 by The American Association of Immunologists, Inc.
Figures


Similar articles
-
Heightened TLR7/9-Induced IL-10 and CXCL13 Production with Dysregulated NF-ҝB Activation in CD11chiCD11b+ Dendritic Cells in NZB/W F1 Mice.Int J Mol Sci. 2019 Sep 19;20(18):4639. doi: 10.3390/ijms20184639. Int J Mol Sci. 2019. PMID: 31546763 Free PMC article.
-
In vivo ablation of plasmacytoid dendritic cells inhibits autoimmunity through expansion of myeloid-derived suppressor cells.J Immunol. 2013 Mar 15;190(6):2631-40. doi: 10.4049/jimmunol.1201897. Epub 2013 Feb 4. J Immunol. 2013. PMID: 23382560 Free PMC article.
-
Tumor-induced myeloid-derived suppressor cell subsets exert either inhibitory or stimulatory effects on distinct CD8+ T-cell activation events.Eur J Immunol. 2013 Nov;43(11):2930-42. doi: 10.1002/eji.201343349. Epub 2013 Aug 25. Eur J Immunol. 2013. PMID: 23878002
-
CD24: from A to Z.Cell Mol Immunol. 2010 Mar;7(2):100-3. doi: 10.1038/cmi.2009.119. Epub 2010 Feb 15. Cell Mol Immunol. 2010. PMID: 20154703 Free PMC article. Review.
-
MDSC in autoimmunity.Int Immunopharmacol. 2011 Jul;11(7):789-93. doi: 10.1016/j.intimp.2011.01.026. Epub 2011 Feb 21. Int Immunopharmacol. 2011. PMID: 21310255 Free PMC article. Review.
Cited by
-
Monocytic Myeloid-Derived Suppressor Cells in Chronic Infections.Front Immunol. 2018 Jan 4;8:1895. doi: 10.3389/fimmu.2017.01895. eCollection 2017. Front Immunol. 2018. PMID: 29354120 Free PMC article. Review.
-
The Pathophysiological Role of Heat Shock Response in Autoimmunity: A Literature Review.Cells. 2021 Oct 1;10(10):2626. doi: 10.3390/cells10102626. Cells. 2021. PMID: 34685607 Free PMC article. Review.
-
CD24: from a Hematopoietic Differentiation Antigen to a Genetic Risk Factor for Multiple Autoimmune Diseases.Clin Rev Allergy Immunol. 2016 Feb;50(1):70-83. doi: 10.1007/s12016-015-8470-2. Clin Rev Allergy Immunol. 2016. PMID: 25666875 Review.
-
The endoplasmic reticulum-resident E3 ubiquitin ligase Hrd1 controls a critical checkpoint in B cell development in mice.J Biol Chem. 2018 Aug 17;293(33):12934-12944. doi: 10.1074/jbc.RA117.001267. Epub 2018 Jun 15. J Biol Chem. 2018. PMID: 29907570 Free PMC article.
-
CD24 blunts oral squamous cancer development and dampens the functional expansion of myeloid-derived suppressor cells.Oncoimmunology. 2016 Sep 26;5(10):e1226719. doi: 10.1080/2162402X.2016.1226719. eCollection 2016. Oncoimmunology. 2016. PMID: 27853649 Free PMC article.
References
-
- Harris HE, Andersson U, Pietsky DS. HMGB1: a multifunctional alarmin driving autoimmune and inflammatory disease. Nat Rev Rheumatol. 2012;31:195–202. - PubMed
-
- Weber CK, Haslbeck M, Englbrecht M, Sehnert B, Mielenz D, Graef D, Distler JH, Mueller RB, Burkhardt H, Schett G, Voll RE, Furnrohr BG. Antibodies to the endoplasmic reticulum-resident chaperones calnexin, BiP and Grp94 in patients with rheumatoid arthritis and systemic lupus erythematosus. Rheumatology. 2010;49:2255–2263. - PubMed
Publication types
MeSH terms
Substances
Grants and funding
LinkOut - more resources
Full Text Sources
Other Literature Sources
Medical
Research Materials

