

Does sleep deprivation alter functional EEG networks in children with focal epilepsy?
- PMID: 24808832
- PMCID: PMC4010773
- DOI: 10.3389/fnsys.2014.00067
Does sleep deprivation alter functional EEG networks in children with focal epilepsy?
Abstract
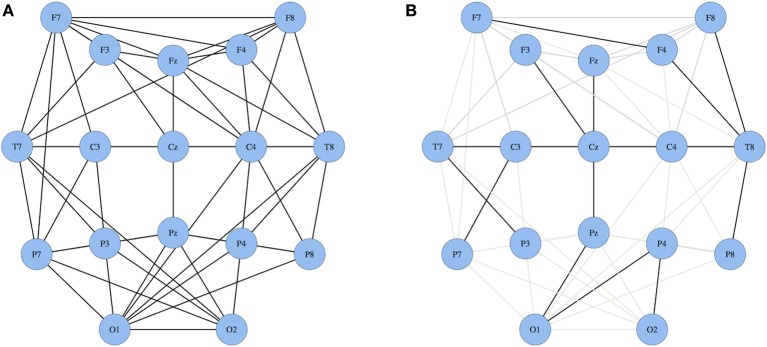
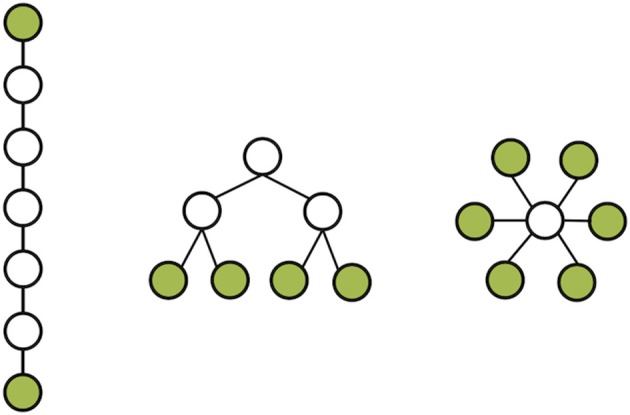
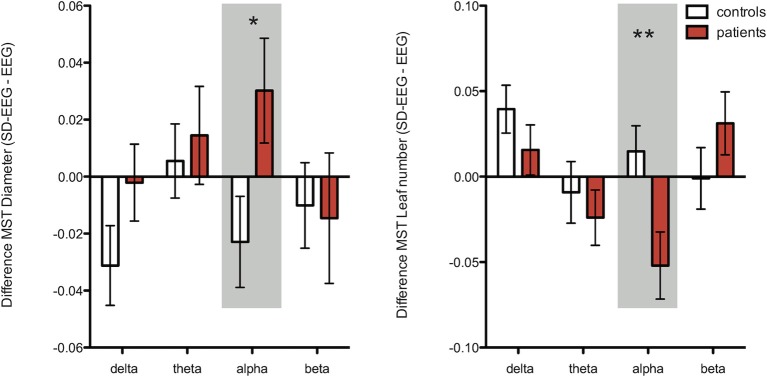
Electroencephalography (EEG) recordings after sleep deprivation increase the diagnostic yield in patients suspected of epilepsy if the routine EEG remains inconclusive. Sleep deprivation is associated with increased interictal EEG abnormalities in patients with epilepsy, but the exact mechanism is unknown. In this feasibility study, we used a network analytical approach to provide novel insights into this clinical observation. The aim was to characterize the effect of sleep deprivation on the interictal functional network organization using a unique dataset of paired routine and sleep deprivation recordings in patients and controls. We included 21 children referred to the first seizure clinic of our center with suspected new onset focal epilepsy in whom a routine interictal and a sleep deprivation EEG (SD-EEG) were performed. Seventeen children, in whom the diagnosis of epilepsy was excluded, served as controls. For both time points weighted functional networks were constructed based on interictal artifact free time-series. Routine and sleep deprivation networks were characterized at different frequency bands using minimum spanning tree (MST) measures (leaf number and diameter) and classical measures of integration (path length) and segregation (clustering coefficient). A significant interaction was found for leaf number and diameter between patients and controls after sleep deprivation: patients showed a shift toward a more path-like MST network whereas controls showed a shift toward a more star-like MST network. This shift in network organization after sleep deprivation in patients is in accordance with previous studies showing a more regular network organization in the ictal state and might relate to the increased epileptiform abnormalities found in patients after sleep deprivation. Larger studies are needed to verify these results. Finally, MST measures were more sensitive in detecting network changes as compared to the classical measures of integration and segregation.
Keywords: EEG; epilepsy; graph theory; minimum spanning tree; network analysis; sleep deprivation.
Figures
Similar articles
-
EEG after sleep deprivation is a sensitive tool in the first diagnosis of idiopathic generalized but not focal epilepsy.Clin Neurophysiol. 2016 Jan;127(1):209-213. doi: 10.1016/j.clinph.2015.06.012. Epub 2015 Jun 18. Clin Neurophysiol. 2016. PMID: 26118491
-
Yield of Sleep Deprivation EEG in Suspected Epilepsy. A Retrospective Study.Clin EEG Neurosci. 2024 Mar;55(2):235-240. doi: 10.1177/15500594221142397. Epub 2022 Nov 27. Clin EEG Neurosci. 2024. PMID: 36437607
-
[The importance of sleep deprivation as a mechanism for activating interictal epileptiform paroxysms].Rev Neurol. 2016 Apr 1;62(7):289-95. Rev Neurol. 2016. PMID: 26988166 Spanish.
-
Prognostic significance of interictal epileptiform discharges in newly diagnosed seizure disorders.J Clin Neurophysiol. 2010 Aug;27(4):239-48. doi: 10.1097/WNP.0b013e3181ea4288. J Clin Neurophysiol. 2010. PMID: 20634717 Review.
-
[The value of EEG after sleep deprivation for the diagnosis of epileptic seizures, epilepsy and other cerebral disorders].Wien Klin Wochenschr. 1982 Nov 12;94(21):569-83. Wien Klin Wochenschr. 1982. PMID: 6820222 Review. German.
Cited by
-
Minimum spanning tree analysis of brain networks: A systematic review of network size effects, sensitivity for neuropsychiatric pathology, and disorder specificity.Netw Neurosci. 2022 Jun 1;6(2):301-319. doi: 10.1162/netn_a_00245. eCollection 2022 Jun. Netw Neurosci. 2022. PMID: 35733422 Free PMC article.
-
Decreased Global Network Efficiency in Young Male Smoker: An EEG Study during the Resting State.Front Psychol. 2017 Sep 15;8:1605. doi: 10.3389/fpsyg.2017.01605. eCollection 2017. Front Psychol. 2017. PMID: 28951727 Free PMC article.
-
Epilepsy self-management during a pandemic: Experiences of people with epilepsy.Epilepsy Behav. 2020 Oct;111:107238. doi: 10.1016/j.yebeh.2020.107238. Epub 2020 Jun 25. Epilepsy Behav. 2020. PMID: 32593874 Free PMC article.
-
Brain Network Organization in Focal Epilepsy: A Systematic Review and Meta-Analysis.PLoS One. 2014 Dec 10;9(12):e114606. doi: 10.1371/journal.pone.0114606. eCollection 2014. PLoS One. 2014. PMID: 25493432 Free PMC article.
-
Eyes-closed task-free electroencephalography in clinical trials for Alzheimer's disease: an emerging method based upon brain dynamics.Alzheimers Res Ther. 2014 Dec 19;6(9):86. doi: 10.1186/s13195-014-0086-x. eCollection 2014. Alzheimers Res Ther. 2014. PMID: 25621017 Free PMC article.
References
-
- Boersma M., Smit D. J., Boomsma D. I., De Geus E. J., Delemarre-Van De Waal H. A., Stam C. J. (2013). Growing trees in child brains: graph theoretical analysis of electroencephalography-derived minimum spanning tree in 5- and 7-year-old children reflects brain maturation. Brain Connect. 3, 50–60 10.1089/brain.2012.0106 - DOI - PubMed
LinkOut - more resources
Full Text Sources
Other Literature Sources