. 2014 May 8;10(5):e1003602.
doi: 10.1371/journal.pcbi.1003602. eCollection 2014 May.

Linear superposition and prediction of bacterial promoter activity dynamics in complex conditions

Affiliations

Linear superposition and prediction of bacterial promoter activity dynamics in complex conditions

Daphna Rothschild et al. PLoS Comput Biol. .

Abstract

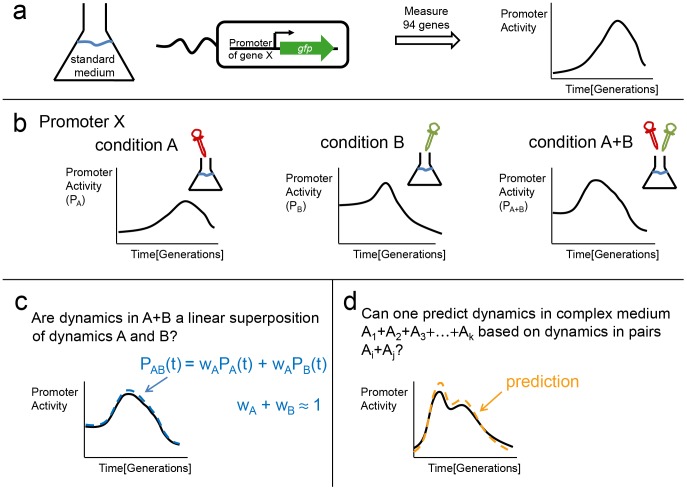
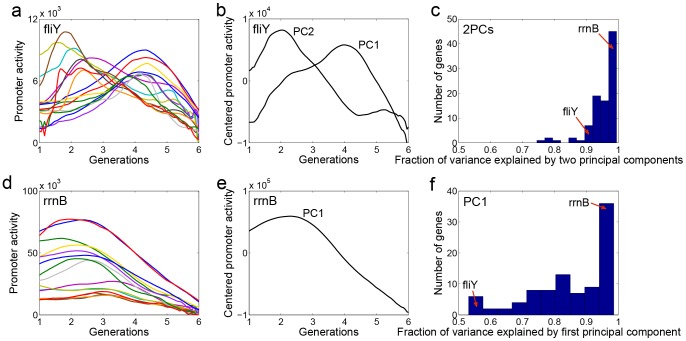
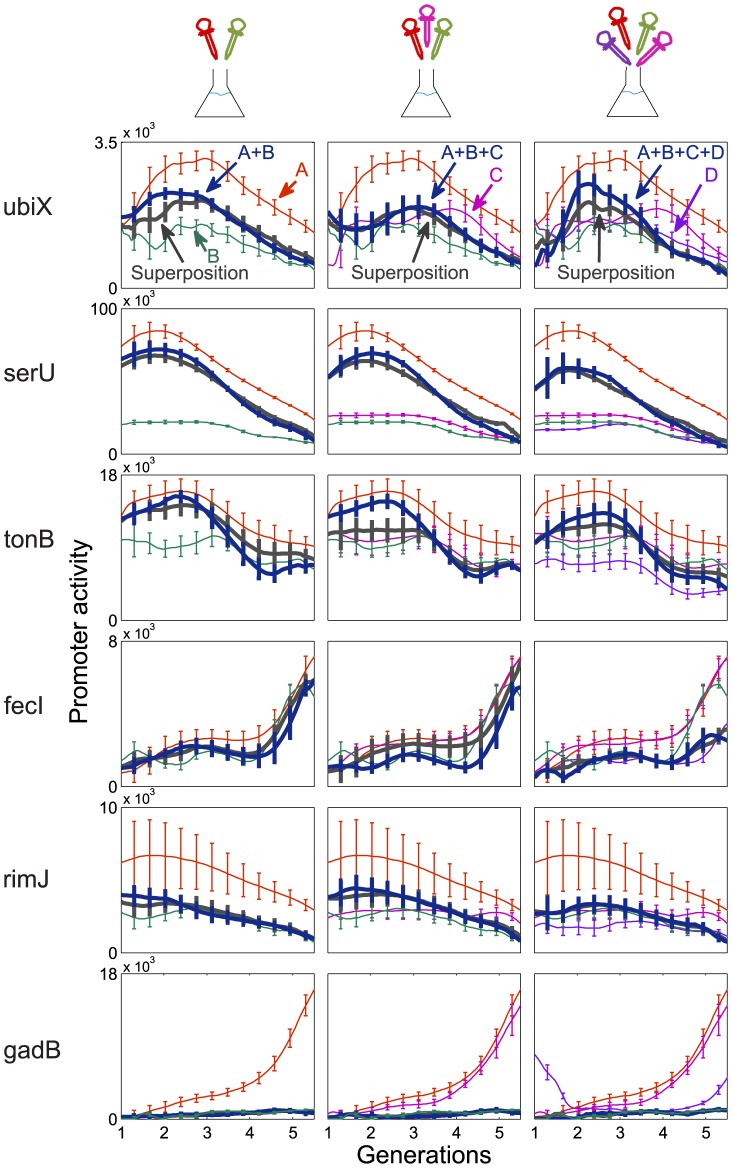
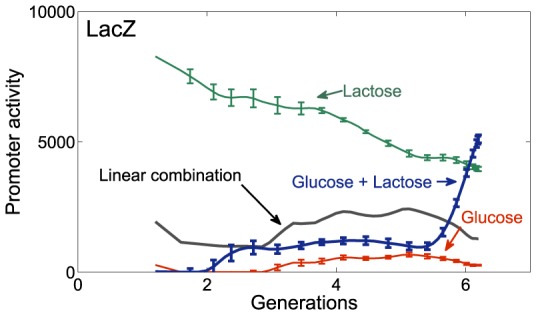
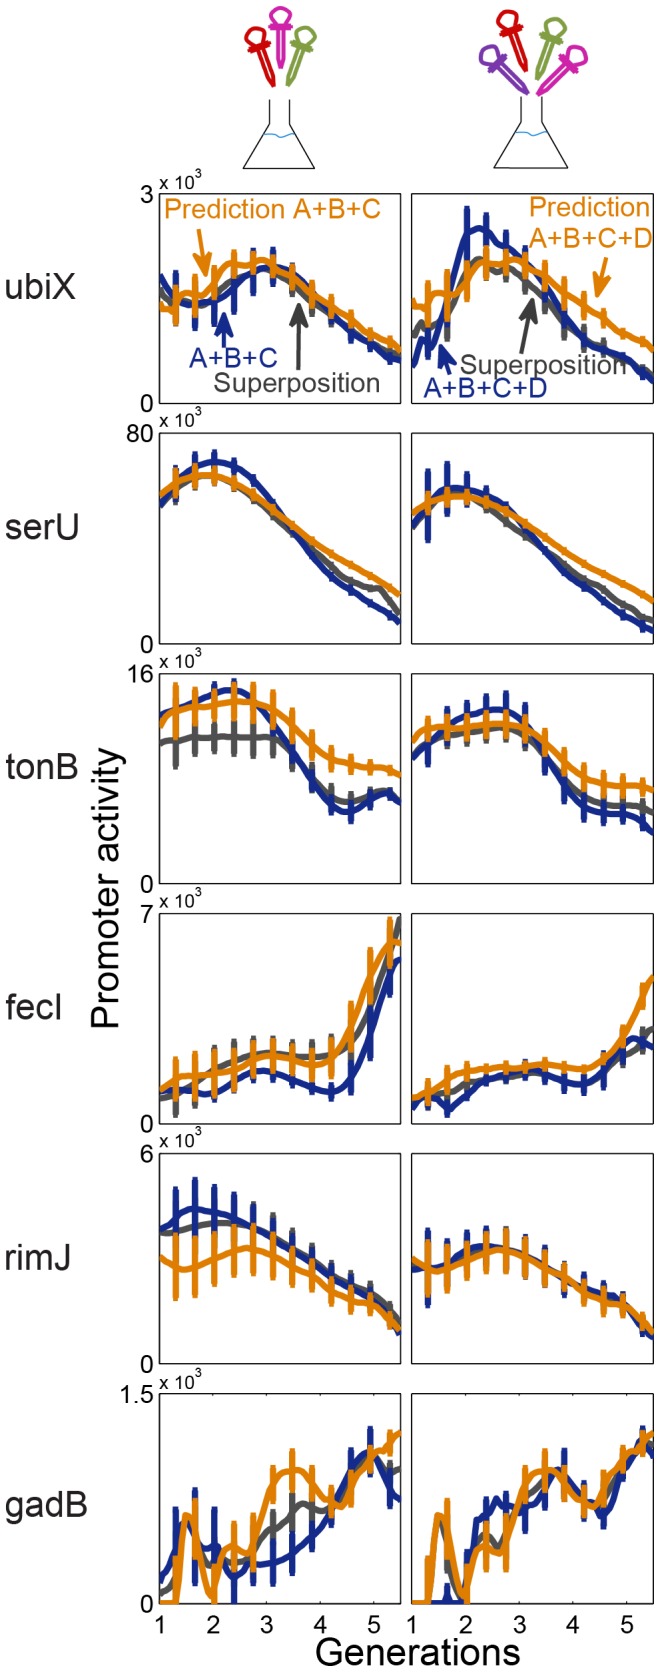
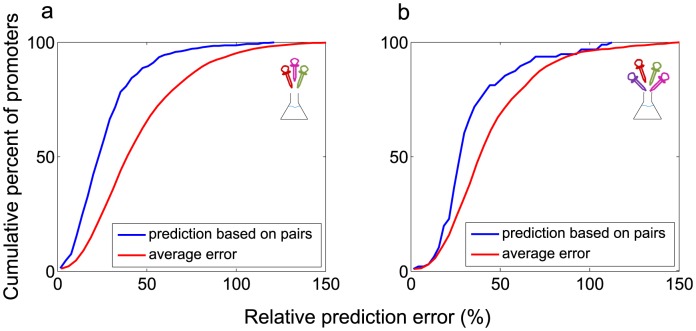
Bacteria often face complex environments. We asked how gene expression in complex conditions relates to expression in simpler conditions. To address this, we obtained accurate promoter activity dynamical measurements on 94 genes in E. coli in environments made up of all possible combinations of four nutrients and stresses. We find that the dynamics across conditions is well described by two principal component curves specific to each promoter. As a result, the promoter activity dynamics in a combination of conditions is a weighted average of the dynamics in each condition alone. The weights tend to sum up to approximately one. This weighted-average property, called linear superposition, allows predicting the promoter activity dynamics in a combination of conditions based on measurements of pairs of conditions. If these findings apply more generally, they can vastly reduce the number of experiments needed to understand how E. coli responds to the combinatorially huge space of possible environments.


Conflict of interest statement

The authors have declared that no competing interests exist.

Figures

Figure 1
Figure 1. Schematic overview of workflow for measuring promoter activity dynamics and the analysis testing linear superposition of dynamics in different conditions.
(a) E. coli reporter strains were grown in defined media conditions in 96-well plates and promoter activity – the rate of GFP accumulation per cell – was found as a function of time. (b) Promoter activity dynamics was measured in four conditions and all of their possible pair, triplet and quadruplet combinations. (c) We tested whether the dynamics in a combined condition is a linear combination (weighted average) of the dynamics in each individual condition. We further asked whether the weights sum up to one, signifying a linear superposition. (d) Finally, we asked whether dynamics in triplet and quadruplet conditions can be predicted based on dynamics in pairs of conditions.
Figure 2
Figure 2. Promoter activities of genes can be well-described by one or two principal components.
(a) fliY promoter activity dynamics in 15 different measured conditions (15 combinations of conditions A,B,C,D). (b) First two principal components dynamics of fliY, according to principal component analysis of fliY dynamics in all conditions and combinations. (c) Fraction of variance explained by the first two principal components for all 94 promoters in 15 environments. Red arrows: fliY and rrnB with 91% and 99% explained variance. (d) rrnB promoter activity dynamics in 15 different measured conditions (e) The first PC of rrnB according to principal component analysis of rrnB expression dynamics in all conditions and combinations. (f) Fraction of variance explained by only the first principal components for all 94 promoters in 15 environments. Red arrows fliY and rrnB with 53% and 98% explained variance.
Figure 3
Figure 3. Promoter activity dynamics in combined conditions is diverse and well-described as a linear superposition of dynamics in individual conditions.
Six representative promoters are shown (each row belongs to one promoter. The Promoter name is indicated on the left). First column shows individual and pair conditions A+B, second column shows a triplet condition (A+B+C), and the third column a quadruplet (A+B+C+D). A = 0.05% casamino acids, B = 3% Ethanol, C = 10 µM H2O2, D = 300 mM NaCl, all added to M9+0.2% glucose defined medium. Dynamics in the combined condition (blue curve) are well-described by the best fit linear superposition of individual condition dynamics (black curve). Error bars are standard error between 4 independent experiments on different days.
Figure 4
Figure 4. An example of deviation from linear combination is found in the LacZ promoter in a diauxic shift experiment.
Promoter activity dynamics in a mixture of 0.04% glucose and 0.4% lactose (Blue line) is far from the best fit linear combination of dynamics of glucose or lactose alone (Black line). Error bars are standard error between three independent experiments on different days.
Figure 5
Figure 5. Dynamics in triplets and quadruplet is well-predicted by a formula that employs dynamics in pairs.
Right column - prediction of triplet A+B+C (combination of casamino acids, ethanol and H2O2) – in orange line – follows the measured shape of the dynamics – blue curve. Shown are six representative promoters. The black curve is the best fit linear combination. Left column - same for the quadruplet A+B+C+D (combination of casamino acids, ethanol, H2O2 and NaCl). Error bars are standard error between 4 independent experiments on different days.
Figure 6
Figure 6. The prediction of dynamics in complex conditions based on pairs of conditions has an error that is smaller than the average expected error.
(a) Cumulative histogram of prediction errors of all 4 triplet combinations (in blue) and of the average errors of all other measured conditions (in red) (b) same for the quadruplet.

References

    1. Hengge R, Storz G, American Society for Microbiology (2011) Bacterial stress responses.
    1. Hoch JA, Silhavy TJ (1995) Two-component signal transduction. Washington, D.C.: ASM Press.
    1. Martínez-Antonio A, Janga SC, Salgado H, Collado-Vides J (2006) Internal-sensing machinery directs the activity of the regulatory network in Escherichia coli. Trends Microbiol 14: 22–27 10.1016/j.tim.2005.11.002 - DOI - PubMed
    1. Neidhardt FC (1996) Escherichia coli and Salmonella typhimurium: cellular and molecular biology. Washington, D.C.: American Society for Microbiology.
    1. Ptashne M, Gann A (2002) Genes and Signals. CSHL Press. 214 p.

Publication types

MeSH terms

Substances