. 2014 May 8;9(5):e97007.
doi: 10.1371/journal.pone.0097007. eCollection 2014.

Brain remodelling following endothelin-1 induced stroke in conscious rats

Affiliations

Brain remodelling following endothelin-1 induced stroke in conscious rats

Hima C S Abeysinghe et al. PLoS One. .

Abstract

The extent of stroke damage in patients affects the range of subsequent pathophysiological responses that influence recovery. Here we investigate the effect of lesion size on development of new blood vessels as well as inflammation and scar formation and cellular responses within the subventricular zone (SVZ) following transient focal ischemia in rats (n = 34). Endothelin-1-induced stroke resulted in neurological deficits detected between 1 and 7 days (P<0.001), but significant recovery was observed beyond this time. MCID image analysis revealed varying degrees of damage in the ipsilateral cortex and striatum with infarct volumes ranging from 0.76-77 mm3 after 14 days, where larger infarct volumes correlated with greater functional deficits up to 7 days (r = 0.53, P<0.05). Point counting of blood vessels within consistent sample regions revealed that increased vessel numbers correlated significantly with larger infarct volumes 14 days post-stroke in the core cortical infarct (r = 0.81, P<0.0001), core striatal infarct (r = 0.91, P<0.005) and surrounding border zones (r = 0.66, P<0.005; and r = 0.73, P<0.05). Cell proliferation within the SVZ also increased with infarct size (P<0.01) with a greater number of Nestin/GFAP positive cells observed extending towards the border zone in rats with larger infarcts. Lesion size correlated with both increased microglia and astrocyte activation, with severely diffuse astrocyte transition, the formation of the glial scar being more pronounced in rats with larger infarcts. Thus stroke severity affects cell proliferation within the SVZ in response to injury, which may ultimately make a further contribution to glial scar formation, an important factor to consider when developing treatment strategies that promote neurogenesis.


Conflict of interest statement

Competing Interests: The authors have declared that no competing interests exist.

Figures

Figure 1
Figure 1. Neurological outcome 14 days after ET-1 induced stroke.
Combined neurological deficit scores (A). Data presented as box plots include hinges extending from the 25th to 75th percentiles, the median line within the box and whiskers extending to the minimum and maximum values of the dataset. ***P<0.0001 vs 0 hr pre-stroke score (n = 19, non-parametric ANOVA). Latency to touch (B) and remove an adhesive (C) on the contralateral (stroke affected) forelimb compared with the ipsilateral forelimb. Data presented as mean ± SEM, *P<0.05 compared with the ipsilateral forelimb at the same time measurement (ANOVA). Scatter plots depicting correlation between infarct volumes and stroke severity rating (r = 0.88, P<0.0001; D) (Pearson product moment correlation coefficients). A significant correlation was found between total infarct volume and neurological deficit score at 24 (r = 0.52, P<0.05; E), 48 (r = 0.70, P<0.001; F), 72 hr (r = 0.60, P<0.01; G), and 7 day (r = 0.54, P<0.05; H) post-stroke but not thereafter (r = 0.16; I) (Pearson product moment correlation coefficients). MCID images of coronal sections taken from three animals with stroke ratings ranging from low to high; stroke rating #2 (J), #3 (K), and #4 (L) displaying damage to varying degrees within the cortex and striatum marked by the black dotted line. Consistent regions used for quantification within the infarcted cortex and striatum can be visualised by the red boxes (J–L).
Figure 2
Figure 2. Angiogenesis and infarct volume 14 days post-stroke.
Scatter plots depict a significant correlation found between degree of angiogenesis and infarct volume within cortex core (r = 0.81, P<0.0001, n = 19; A), cortex border (r = 0.66, P<0.005, n = 19; B), striatum core (r = 0.91, P<0.005, n = 8; C) and striatum border (r = 0.73, P<0.05, n = 8; D) (Pearson product moment correlation coefficients). Scatter plots of blood vessels (vWF+) from sham-operated (n = 3) and 14 day post-stroke animals (n = 19) revealed a significant increase in the number of blood vessels within the ipsilateral cortical and striatal core and border regions only (non-parametric ANOVA; E–H). Data presented as mean ± SEM, *P<0.05, **P<0.01, ****P<0.0001 compared with the contralateral hemisphere of ET-1 stroke affected animals and either hemisphere of sham-operated animals. No significant differences were observed between the contralateral hemisphere of ET-1 stroke affected animals and either hemisphere of sham-operated animals. Angiogenesis and neuronal loss within the stroke damaged brain (I–K). Immunohistochemical localisation of neurons (red) and blood vessels (green) in the cortex of stroke affected rat brains with total infarct volumes ranging from 0.76–77 mm3. Increased angiogenesis is observed in regions with greatest neuronal loss (ipsilateral columns I, J and K). Scale bar: I–K 100 µm.
Figure 3
Figure 3. SVZ cell proliferation/migration, neural differentiation and infarct correlation 7 days post-stroke.
Scatter plots of proliferating SVZ cells (Ki67+) from sham-operated (n = 3), 7 day post-stroke (n = 15) and 14 day post-stroke groups (n = 19) revealed a significant increase in the number of proliferating SVZ cells 7 days post-stroke (non-parametric ANOVA; A). Data presented as mean ± SEM, *P<0.05 compared with sham-operated animals and #P<0.05 compared with 7 day post-stroke animals. A significant correlation was found between proliferating SVZ cells (Ki67+) and infarct volume 7 days post-stroke (r = 0.73, P<0.005, n = 15; B) but not at 14 days (r = 0.07; C) (Pearson product moment correlation coefficients). Scatter plots depict a significant increase in proliferating radial glial cells within the SVZ at 7 days post-stroke (Mann Whitney test; D). Data presented as mean ± SEM, *P<0.05 compared with sham-operated animals. Within the SVZ, a positive correlation was observed between infarct volumes and the number of proliferating radial glial cells (Ki67+/GFAP+; r = 0.73, P<0.005; E) 7 days post-stroke (Pearson product moment correlation coefficients). Scatter plots depict a significant increase in the number of immature neuronal cells within the SVZ at 7 days post-stroke (DCX+, Mann Whitney test; F). Data presented as mean ± SEM, *P<0.05 compared with sham-operated animals. Infarct volume significantly correlated with the number of immature neurons generated from the SVZ 7 days post-stroke (DCX+; r = 0.77, P<0.001; G) (Pearson product moment correlation coefficients).
Figure 4
Figure 4. SVZ cell proliferation, migration, neural differentiation and scar formation across varied infarct volumes.
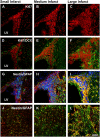
Representative photomicrographs of proliferating cells (Ki67+; red; A–C) and non-proliferating immature neuronal cells (Ki67+/DCX+; red/green respectively; D–F) lining the ipsilateral SVZ, radial glial cells migrating from the ipsilateral SVZ (Nestin+/GFAP+; green/red respectively with co-expression giving a yellow appearance; G–I) and new activated astrocytes located within the cortical penumbra contributing to the glial scar (Nestin+/GFAP+; J–L). Images were taken from animals with small, medium and large infarcts. LV: Lateral ventricle. Scale bar: A–L 50 µm.
Figure 5
Figure 5. Immunohistochemical analysis of microglia and macrophages 14 days post-stroke.
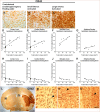
Immunohistochemical images of OX42 labelled microglia/macrophages within the contralateral undamaged hemisphere (A), ipsilateral core cortex of a small infarct (B) versus a large infarct (C). Within the ipsilateral hemisphere, a positive correlation was observed between infarct volume and the number of microglia and macrophages in the core cortex (r = 0.88, P<0.0001, n = 19; D), surrounding cortex (r = 0.70, P<0.001, n = 19; E), core striatum (r = 0.86, P<0.01, n = 8); F), and border striatum (r = 0.77, P<0.05, n = 8; G). In contrast, the number of microglia and macrophages in the mirror image areas on the contralateral side negatively correlated with infarct volumes within the core cortex (r = 0.81, P<0.0001, n = 19; H), border cortex (r = 0.75, P<0.0005, n = 19; I), core striatum (r = 0.75, P<0.05, n = 8; J), and border striatum (r = 0.75, P<0.05, n = 8; K) (Pearson product moment correlation coefficients). Activated microglia can be observed within the corpus callosum, and potentially represent microglia migrating from the contralateral undamaged hemisphere to sites of damage within the ipsilateral hemisphere (L). Magnified immunohistochemical images that correspond to boxes labelled (M to O) in (L) illustrate the possible migration pathway of microglia along the corpus callosum as indicated by the arrows. Scale bar: (A–C) 100 µm, (L) 2500 µm, (M–O) 50 µm.
Figure 6
Figure 6. Analysis of activated and diffuse astrocytic morphologies 14 days post-stroke.
Immunohistochemical images of GFAP positive astrocytes of a quiescent appearance found within the contralateral hemisphere (A), activated astrocytes surrounding a small infarct (B) and diffuse astrocytes bordering a large infarct (C). Within the core cortex, no activated astrocytes were found (D) and diffuse astrocytes were in very low numbers (E). In regions bordering the infarct, infarct volumes either negatively correlated with the number of activated astrocytes (r = 0.87, P<0.0001, n = 19; F) or positively correlated with the number of diffuse astrocytes (r = 0.96, P<0.0001, n = 19; G). No activated astrocytes were detected within the striatum core (H). A modest correlation was observed between infarct size and diffuse astrocytes within the core striatum (r = 0.93, P<0.001, n = 8; I). In areas surrounding the striatum, infarct sizes either negatively correlated with activated astrocytes (r = 0.85, P<0.01, n = 8; J) or positively correlated with diffuse astrocytes (r = 0.89, P<0.005, n = 8; K) (Pearson product moment correlation coefficients). Scale bar: A–C 100 µm.

References

    1. Lansberg MG, Straka M, Kemp S, Mlynash M, Wechsler LR, et al. (2012) MRI profile and response to endovascular reperfusion after stroke (DEFUSE 2): a prospective cohort study. Lancet Neurol 11: 860–867. - PMC - PubMed
    1. Dirnagl U, Iadecola C, Moskowitz MA (1999) Pathobiology of ischaemic stroke: an integrated view. Trends Neurosci 22: 391–397. - PubMed
    1. Lo EH, Dalkara T, Moskowitz MA (2003) Mechanisms, challenges and opportunities in stroke. Nat Rev Neurosci 4: 399–415. - PubMed
    1. Huang IJ, Chen CY, Chung HW, Chang DC, Lee CC, et al. (2001) Time course of cerebral infarction in the middle cerebral arterial territory: deep watershed versus territorial subtypes on diffusion-weighted MR images. Radiology 221: 35–42. - PubMed
    1. Taylor C, Weston RM, Dusting GJ, Roulston CL (2013) NADPH Oxidase and Angiogenesis Following Endothelin-1 Induced Stroke in Rats: Role for Nox2 in Brain Repair. Brain Sci 3: 294–317. - PMC - PubMed

Publication types

MeSH terms