. 2014 May 8;10(5):e1004125.
doi: 10.1371/journal.ppat.1004125. eCollection 2014 May.

Epstein-Barr virus down-regulates tumor suppressor DOK1 expression

Affiliations

Epstein-Barr virus down-regulates tumor suppressor DOK1 expression

Maha Siouda et al. PLoS Pathog. .

Abstract

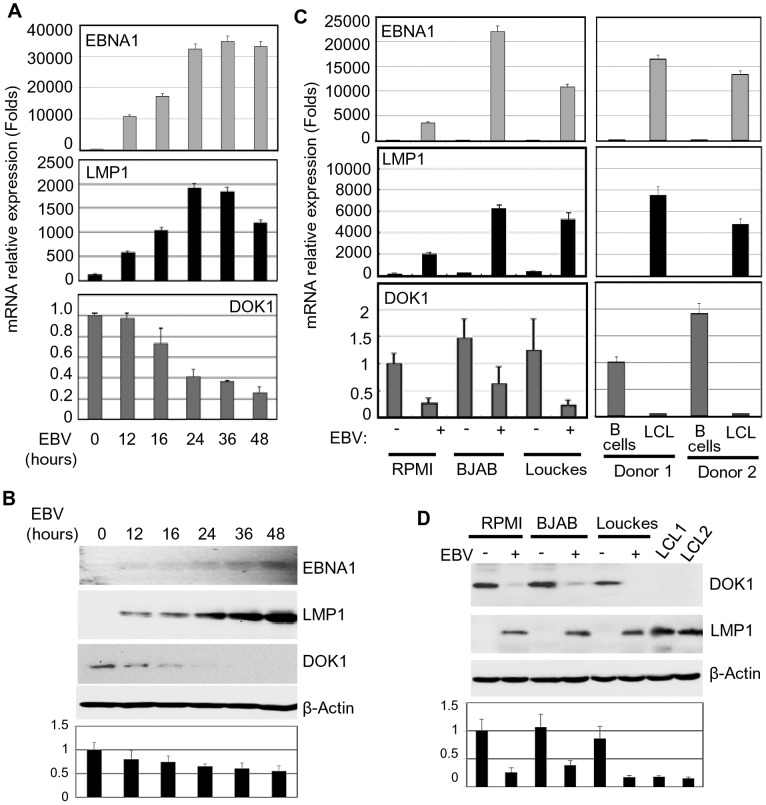
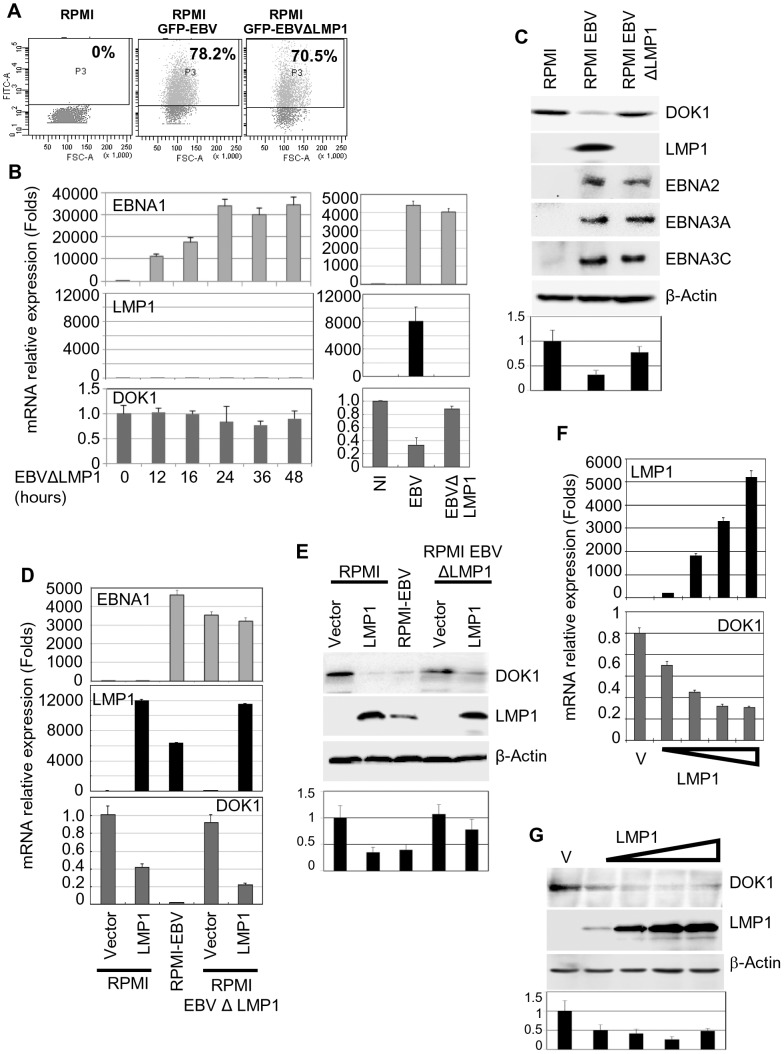
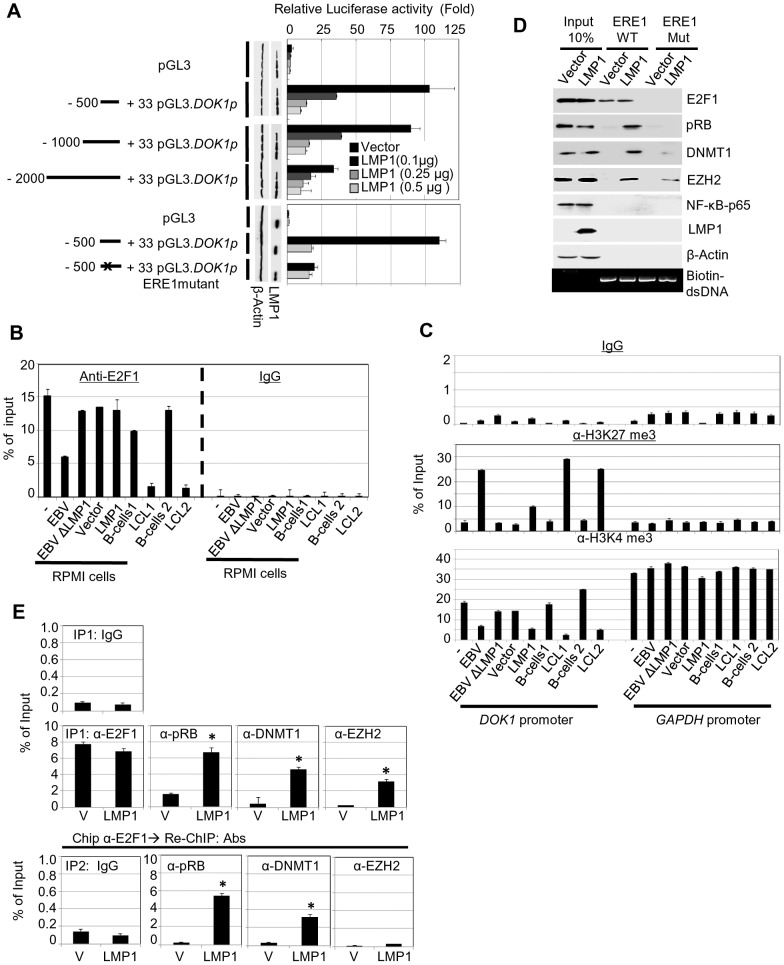
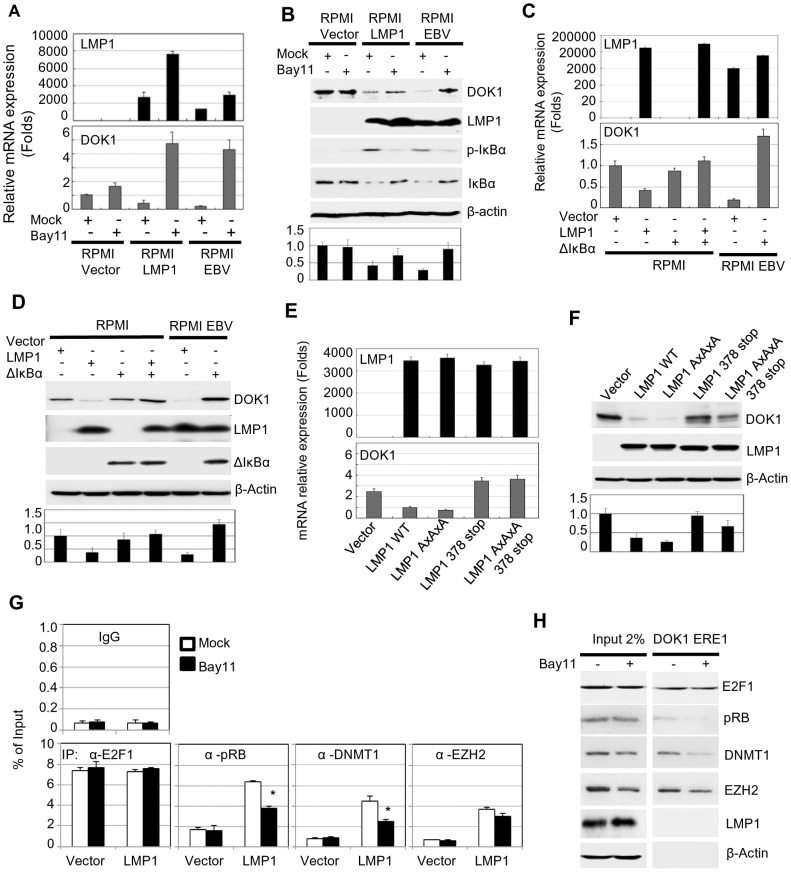
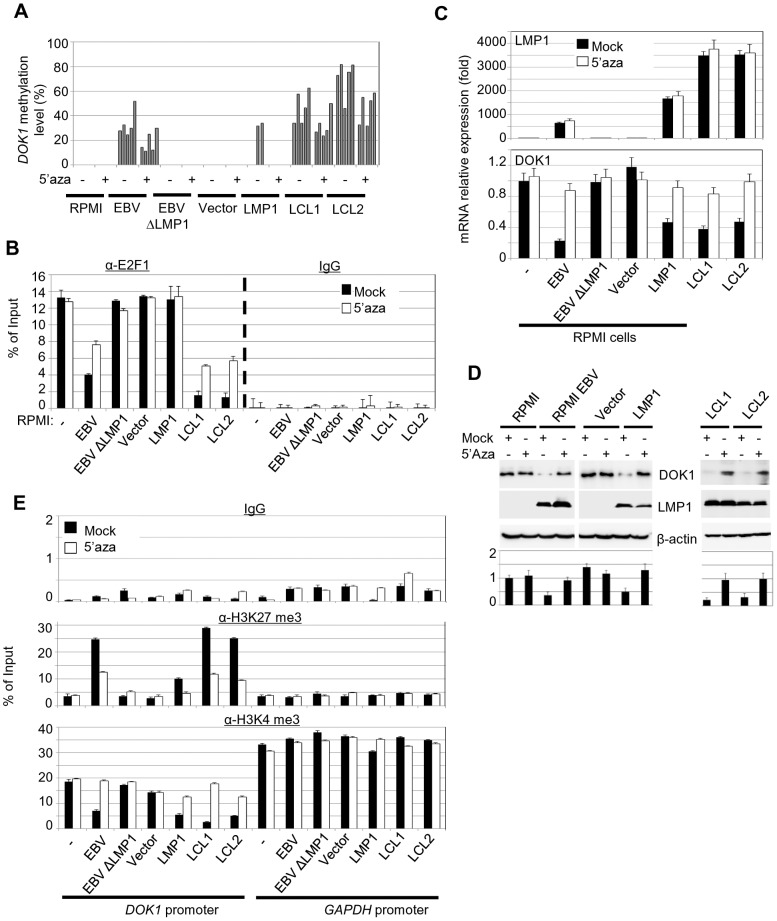
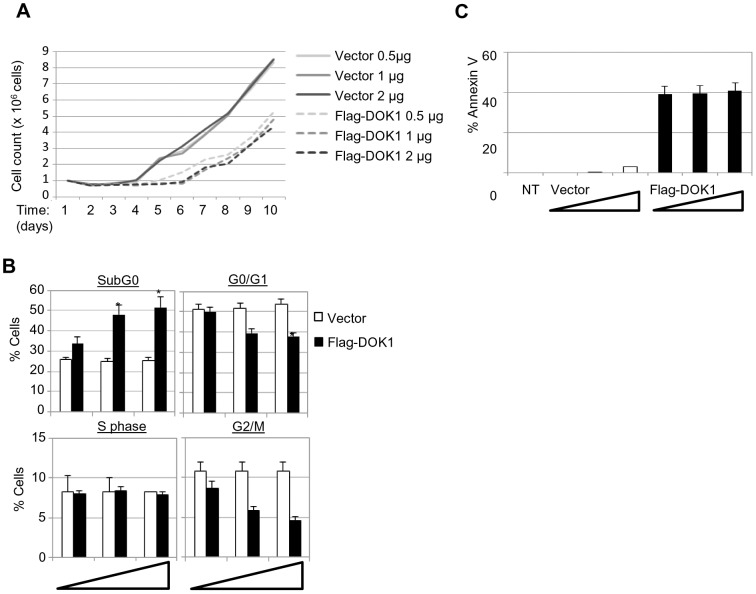
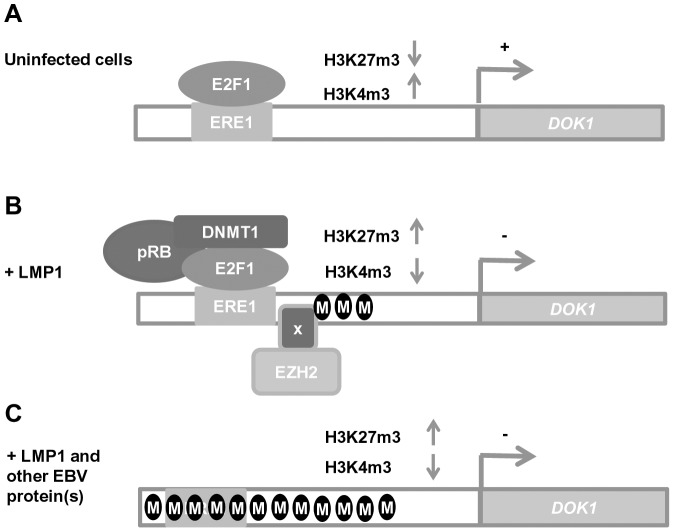
The DOK1 tumor suppressor gene encodes an adapter protein that acts as a negative regulator of several signaling pathways. We have previously reported that DOK1 expression is up-regulated upon cellular stress, via the transcription factor E2F1, and down-regulated in a variety of human malignancies due to aberrant hypermethylation of its promoter. Here we show that Epstein Barr virus (EBV) infection of primary human B-cells leads to the down-regulation of DOK1 gene expression via the viral oncoprotein LMP1. LMP1 alone induces recruitment to the DOK1 promoter of at least two independent inhibitory complexes, one containing E2F1/pRB/DNMT1 and another containing at least EZH2. These events result in tri-methylation of histone H3 at lysine 27 (H3K27me3) of the DOK1 promoter and gene expression silencing. We also present evidence that the presence of additional EBV proteins leads to further repression of DOK1 expression with an additional mechanism. Indeed, EBV infection of B-cells induces DNA methylation at the DOK1 promoter region including the E2F1 responsive elements that, in turn, lose the ability to interact with E2F complexes. Treatment of EBV-infected B-cell-lines with the methyl-transferase inhibitor 5-aza-2'-deoxycytidine rescues DOK1 expression. In summary, our data show the deregulation of DOK1 gene expression by EBV and provide novel insights into the regulation of the DOK1 tumor suppressor in viral-related carcinogenesis.


Conflict of interest statement

The authors have declared that no competing interests exist.

Figures

Figure 1
Figure 1. EBV infection in vitro inhibits DOK1 gene expression.
Primary B-cells were isolated from healthy donor blood using negative selection, and then infected with GFP-EBV recombinant virus. (A) mRNA levels of EBNA1, LMP1, and DOK1 were measured using real time PCR at different time points 12, 16, 24, 36, and 48 hours post infection and normalized to GAPDH expression. The isolated primary B-cells were used as a control (time point 0). Data are average of three independent experiments. (B) DOK1, LMP1, EBNA1, and β-actin protein levels were determined by western blotting. (C) Total mRNA was extracted from RPMI, BJAB and Louckes cells two weeks after infection with GFP-EBV recombinant virus. The respective non-infected cells were used as control. Similarly, mRNA was extracted from two LCLs and their original primary B-cells. The expression levels of EBNA1, LMP1, and DOK1 were measured by real time PCR and normalized to GAPDH expression. (D) DOK1, LMP1 and β-actin protein levels were determined by western blotting. DOK1 protein levels were quantified from two independent immunoblots and normalized to the corresponding β-actin level (bottom of B and D).
Figure 2
Figure 2. LMP1 plays a key role in EBV-mediated DOK1 silencing.
RPMI cells were infected with GFP recombinant EBV wild type (GFP-EBV) or lacking LMP1 (EBVΔLMP1). (A) The infection was monitored using flow cytometry for GFP expression. (B and C) mRNA levels of EBNA1, LMP1, GAPDH and DOK1 in these cells were determined using real time PCR and the indicated proteins expression were analyzed using western blotting. Both RPMI and RPMI-EBVΔLMP1 cells were transduced using retroviral vector pLXSN empty (Vector) or expression vector pLXSN-LMP1. The cells were collected for mRNA and protein analysis. (D and E) The mRNA levels of EBNA1, LMP1, and DOK1 in these cells were determined using real time PCR and normalized to GAPDH expression, while the indicated proteins expression were analyzed using western blot. RPMI cells were transiently transfected with increasing amounts of pcDNA3 empty plasmid (Vector) or expression vector pcDNA3-LMP1. (F) Cells were collected for mRNA and protein analysis. LMP1and DOK1 gene expressions were measured using real time PCR for RNA levels and normalized to GAPDH expression. (G) The indicated protein levels were detected using western blotting. DOK1 protein levels were quantified from two independent immunoblots and normalized to the corresponding β-actin level (bottom of C, E and G).
Figure 3
Figure 3. LMP1 represses DOK1 promoter activity through the recruitment of E2F1/pRB/DNMT1 inhibitory complex.
(A) RPMI cells were transfected with the indicated firefly luciferase reporter pGL3-DOK1 promoter constructs along with increasing amounts of pcDNA3 LMP1. Renilla luciferase was used as an internal control for the reporter assay. After 48 hours, cells were collected and processed for luciferase activity measurement. The data are average of three independent experiments. (B) RPMI cells, RPMI cells infected with GFP-EBV recombinant virus, or GFP-EBVΔLMP1, RPMI cells transduced with empty pLXSN (V) or expression vector pLXSN-LMP1, and LCLs and their original primary B-cells were subjected to quantitative ChIP assay using anti-E2F1 (KH 95) antibody or IgG. The DOK1 promoter was amplified by real-time PCR using specific primers flanking the E2F-response element located at (−498/−486). Data were calculated as percentages of enrichment of input. Error bars indicate the standard deviation from three independent experiments performed in triplicate. (C) The same cells from (B) were subjected to ChIP assay using the anti-H3K27 trimethylation antibody, anti-H3K4 trimethylation antibody or IgG. The DOK1 promoter and GAPDH promoter were amplified by real-time PCR. (D) In vitro DNA pull-down assay. The DOK1 promoter region containing the original E2F-response element located at (−498/−486) or a mutated one (obtained by replacing the core GGCG of the consensus sequence with AAAA), was amplified by PCR using specific 5′biotinylated primers. The PCR products (agarose gel, bottom panel) were incubated with total lysate from RPMI cells transduced with empty pLXSN (Vector) or expression vector pLXSN-LMP1, and then pulled down using streptavidin-agarose beads. Immunoblotting was used to check the recruitment of E2F1, pRB, DNMT1, EZH2 and p65 to the different PCR fragments. β-Actin was used as a negative control of binding to DNA. (E) Transduced RPMI cells with empty pLXSN (Vector) or expression vectorpLXSN-LMP1 were used for quantitative ChIP Re-ChIP assay. To assess the individual recruitment of E2F1, pRB, DNMT1, and EZH2 to the DOK1 promoter, chromatin was immuno-precipitated (IP 1) with the indicated antibodies and IgG was used as a negative control (top). To determine the E2F1 association with the indicated factors, E2F1 chromatin complex (IP 1) was subjected to Re-ChIP (IP 2) using the indicated antibodies (bottom). The DOK1 promoter was amplified using real time PCR and data from IP 1 and IP 2 were calculated as percentage of total input.
Figure 4
Figure 4. LMP1-mediated NF-κB activation is required for EBV-related DOK1 down-regulation.
RPMI cells transduced with empty retroviral pLXSN (Vector), expression vector pLXSN-LMP1, or infected with GFP-EBV recombinant virus were treated with Bay11 or the equivalent volume of DMSO (Mock). (A) mRNA levels of LMP1 and DOK1 were measured by real time PCR, and normalized to GAPDH expression. (B) The indicated proteins were detected using western blotting. RPMI cells were transfected with pcDNA3 empty plasmid (Vector), expression vector pcDNA3-LMP1 and/or expressing the super-repressor IκBα (ΔIκBα), while RPMI cells infected with GFP-EBV recombinant virus were transfected only with pcDNA3 empty (Vector) or expression vector of the super-repressor IκBα (ΔIκBα). After 48 hours, cells were collected for analysis. (C) mRNA levels of LMP1 and DOK1 were measured by real time PCR, and normalized to GAPDH expression. (D) The indicated proteins were detected using western blotting. RPMI cells were transfected with empty pLXSN (Vector), or expression vector pLXSN-LMP1 wild type (WT), LMP1 mutant for the CTAR1 domain (AxAxA), and CTAR2 domain (378 stop), or both CRAT1 and 2 domains (AxAxA/378 stop). After 48 hours, cells were harvested for expression analysis. (E) mRNA levels of LMP1, GAPDH and DOK1 were measured using real time PCR. (F) The indicated proteins were detected using western blotting. DOK1 protein levels were quantified from two independent immunoblots and normalized to the corresponding β-actin level (bottom of B, D and F). Stable RPMI cells with empty pLXSN (Vector), or expression vector pLXSN-LMP1, were treated with Bay11 or the equivalent volume of DMSO (Mock). (G) Cells were subjected to quantitative ChIP assay using the indicated antibody or IgG. The DOK1 promoter was amplified by real-time PCR using specific primers flanking the E2F-response element located at −498/−486. Data were calculated as percentages of enrichment of total input. Error bars indicate the standard deviation from two independent experiments performed in triplicate. (H) In vitro DNA pull-down assay. The DOK1 promoter region containing ERE1 was incubated with total lysate from RPMI cells expressing LMP1 treated with Mock or Bay11, and then pulled down using streptavidin-agarose beads. Immunoblotting was used to check the recruitment of E2F1, pRB, DNMT1, EZH2. β-Actin was used as a negative control of binding to DNA.
Figure 5
Figure 5. 5-Aza treatment rescue DOK1 expression in EBV infected cells.
Cells were treated with 1 µM methyl-transferase inhibitor 5-Aza-2′deoxycytidine (5-Aza) for 4 days or equivalent volume of DMSO (Mock), then collected for analysis. (A) DNA methylation levels of the DOK1 promoter were measured using pyrosequencing. Each bar represents the percentage of methylation for individual CpG sites. (B) Quantitative ChIP assay using anti-E2F1 (KH 95) antibody or IgG. The DOK1 promoter was amplified by real-time PCR using specific primers flanking the E2F-response element located at (−498/−486). Data were calculated as percentages of enrichment of input. Error bars indicate the standard deviation (SD) from two independent experiments performed in triplicate. (C) The mRNA expression levels of LMP1, GAPDH and DOK1 were determined using real time PCR. (D) The indicated proteins were analyzed using western blotting. DOK1 protein levels were quantified from two independent immunoblots and normalized to the corresponding β-actin level (bottom). (E) ChIP assays were carried out using anti-H3K27 trimethylation antibody, anti-H3K4 trimethylation antibody or IgG. The DOK1 promoter and GAPDH promoter were amplified by real-time PCR. Data were calculated as percentages of enrichment of input.
Figure 6
Figure 6. (A) LCL cells were transfected with the indicated amounts of empty pcDNA3 (Vector) or expression vector pcDNA3-Flag-DOK1.
After 24(B) LCL cells were monitored for cell cycle analysis 48 hours after being transfected with the indicated amounts of pcDNA3 empty (Vector) or expression vector pcDNA3-Flag-DOK1. Cells in different cycle phases (SubG0, G0/G1, S, or G2/M) are represented as percentage of total cells. (C) The same cells from (B) were monitored for apoptosis using Annexin V staining. Non transfected cells were used as control (NT). Error bars indicate the SD from two independent experiments. Data were analyzed using Student's t test (*, P<0.05).
Figure 7
Figure 7. Schematic model of DOK1 gene regulation in EBV-infected cells.
(A) In uninfected cells, DOK1 expression is activated via the recruitment of the active form of the E2F1 transcription factor to its response element located at (−498/−486) on the DOK1 promoter. (B) In cells expressing the oncoprotein LMP1, DOK1 is down-regulated through the recruitment of the inhibitory complexes E2F1/pRB/DNMT1 and EZH2 to its promoter region. These complexes lead to the induction of partial DNA methylation and the increase of H3K27 trimethylation levels, respectively. (C) In EBV-infected cells, DOK1 is repressed through heavy DNA methylation of its promoter region and the increase in H3K27 trimethylation level. These events likely induce conformational changes in the chromatin, which become less permissive to E2F1 transcription factor recruitment.

References

    1. Mashima R, Hishida Y, Tezuka T, Yamanashi Y (2009) The roles of Dok family adapters in immunoreceptor signaling. Immunol Rev 232: 273–285. - PubMed
    1. Di Cristofano A, Niki M, Zhao M, Karnell FG, Clarkson B, et al. (2001) p62(dok), a negative regulator of Ras and mitogen-activated protein kinase (MAPK) activity, opposes leukemogenesis by p210(bcr-abl). J Exp Med 194: 275–284. - PMC - PubMed
    1. Berger AH, Niki M, Morotti A, Taylor BS, Socci ND, et al. (2010) Identification of DOK genes as lung tumor suppressors. Nature Genetics 42: 216–U227. - PMC - PubMed
    1. Yasuda T, Shirakata M, Iwama A, Ishii A, Ebihara Y, et al. (2004) Role of Dok-1 and Dok-2 in myeloid homeostasis and suppression of leukemia. J Exp Med 200: 1681–1687. - PMC - PubMed
    1. Yasuda T, Bundo K, Hino A, Honda K, Inoue A, et al. (2007) Dok-1 and Dok-2 are negative regulators of T cell receptor signaling. Int Immunol 19: 487–495. - PubMed

Publication types

MeSH terms

LinkOut - more resources