

The role of neighbours selection on cohesion and order of swarms
- PMID: 24809718
- PMCID: PMC4014465
- DOI: 10.1371/journal.pone.0094221
The role of neighbours selection on cohesion and order of swarms
Abstract
We introduce a multi-agent model for exploring how selection of neighbours determines some aspects of order and cohesion in swarms. The model algorithm states that every agents' motion seeks for an optimal distance from the nearest topological neighbour encompassed in a limited attention field. Despite the great simplicity of the implementation, varying the amplitude of the attention landscape, swarms pass from cohesive and regular structures towards fragmented and irregular configurations. Interestingly, this movement rule is an ideal candidate for implementing the selfish herd hypothesis which explains aggregation of alarmed group of social animals.
Conflict of interest statement
Figures
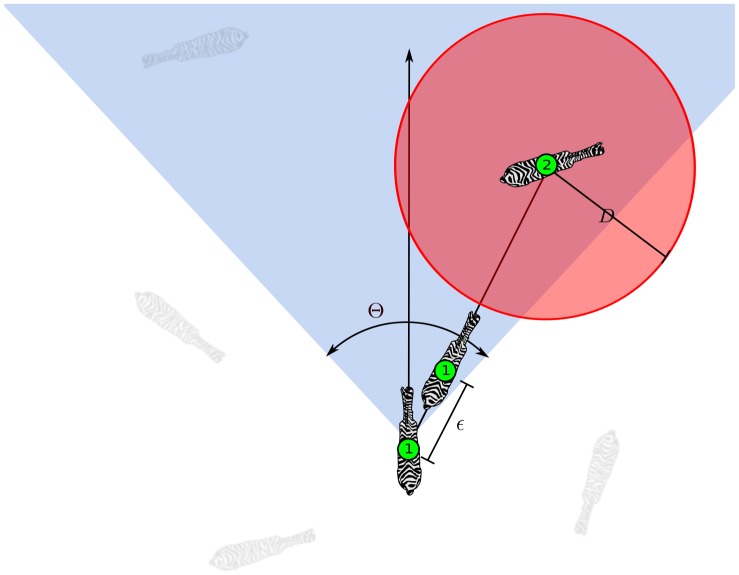
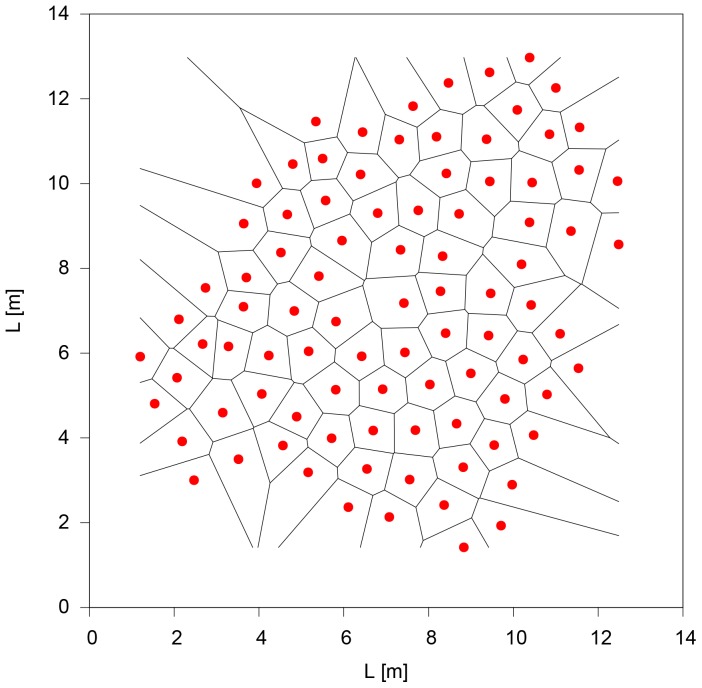
 towards individual 2 which is the nearest neighbour encompassed by the attention field, the blue region characterised by the angle
  . The stress zone of individual 2 is the red disk of radius
  .
.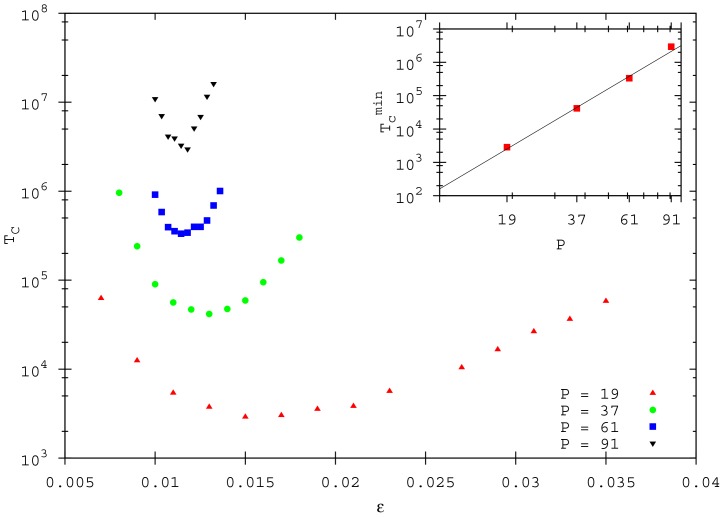
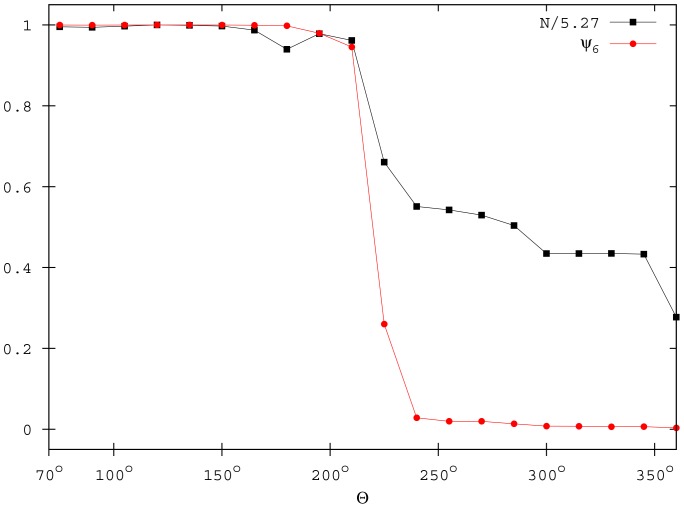
 different simulations, where the individual initial distribution is different. In the inset:
  as a function of
  . The continuous line is the fitted relation:
  .
.
 ,
,  ,
,  , and
, and  .
.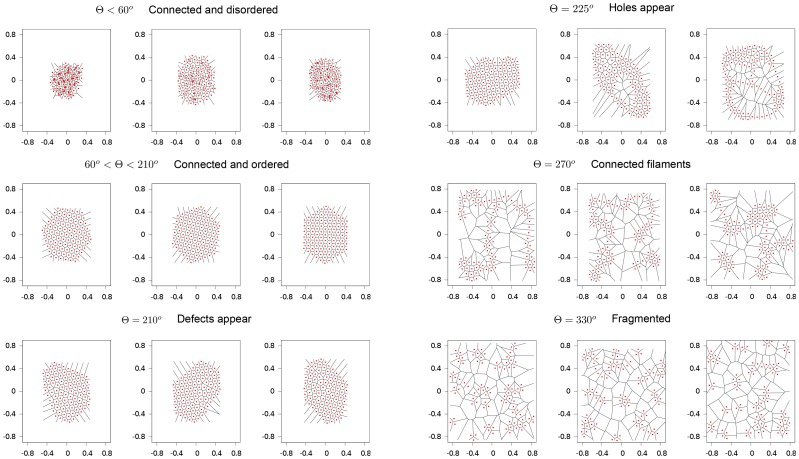
 ,
,  , and
, and  ).
).
 ,
,  , and
, and  ).
).
 ,
,  ,
,  and
and  ).
).
Similar articles
-
Geometry for mutualistic and selfish herds: the limited domain of danger.J Theor Biol. 2004 May 7;228(1):107-13. doi: 10.1016/j.jtbi.2003.12.005. J Theor Biol. 2004. PMID: 15064086
-
Limited interactions in flocks: relating model simulations to empirical data.J R Soc Interface. 2011 Feb 6;8(55):301-4. doi: 10.1098/rsif.2010.0397. Epub 2010 Sep 8. J R Soc Interface. 2011. PMID: 20826476 Free PMC article.
-
Collective Motion as an Ultimate Effect in Crowded Selfish Herds.Sci Rep. 2019 Apr 29;9(1):6618. doi: 10.1038/s41598-019-43179-6. Sci Rep. 2019. PMID: 31036873 Free PMC article.
-
Information transfer in moving animal groups.Theory Biosci. 2008 Jun;127(2):177-86. doi: 10.1007/s12064-008-0040-1. Epub 2008 May 6. Theory Biosci. 2008. PMID: 18458976 Review.
-
Dynamical aspects of animal grouping: swarms, schools, flocks, and herds.Adv Biophys. 1986;22:1-94. doi: 10.1016/0065-227x(86)90003-1. Adv Biophys. 1986. PMID: 3551519 Review.
Cited by
-
The impact of individual perceptual and cognitive factors on collective states in a data-driven fish school model.PLoS Comput Biol. 2022 Mar 2;18(3):e1009437. doi: 10.1371/journal.pcbi.1009437. eCollection 2022 Mar. PLoS Comput Biol. 2022. PMID: 35235565 Free PMC article.
-
Computational and robotic modeling reveal parsimonious combinations of interactions between individuals in schooling fish.PLoS Comput Biol. 2020 Mar 16;16(3):e1007194. doi: 10.1371/journal.pcbi.1007194. eCollection 2020 Mar. PLoS Comput Biol. 2020. PMID: 32176680 Free PMC article.
-
The role of space availability and affiliation in shaping equine social distances and dynamics.Sci Rep. 2025 Mar 25;15(1):10273. doi: 10.1038/s41598-025-92943-4. Sci Rep. 2025. PMID: 40133443 Free PMC article.
-
Randomness in the choice of neighbours promotes cohesion in mobile animal groups.R Soc Open Sci. 2022 Mar 23;9(3):220124. doi: 10.1098/rsos.220124. eCollection 2022 Mar. R Soc Open Sci. 2022. PMID: 35345437 Free PMC article.
References
-
- Reynolds CW (1987) Flocks, herds and schools: A distributed behavioral model. Comput Graph 21: 25–34.
-
- Okubo A (1986) Dynamical aspects of animal grouping: swarms, schools, flocks, and herds. Advances in biophysics 22: 1–94. - PubMed
-
- Warburton K, Lazarus J (1991) Tendency-distance models of social cohesion in animal groups. Journal of Theoretical Biology 150: 473–488. - PubMed
-
- Gueron S, Levin SA, Rubenstein DI (1996) The Dynamics of Herds: From Individuals to Aggregations. Journal of Theoretical Biology 182: 85–98.
-
- Hildenbrandt H, Carere C, Hemelrijk CK (2010) Self-organized aerial displays of thousands of starlings: a model. Behavioral Ecology 21: 1349–1359.
Publication types
MeSH terms
LinkOut - more resources
Full Text Sources
Other Literature Sources
