. 2014 Apr 30;5(8):2208-20.
doi: 10.18632/oncotarget.1893.

Anti-vascular endothelial growth factor therapy-induced glioma invasion is associated with accumulation of Tie2-expressing monocytes

Affiliations

Anti-vascular endothelial growth factor therapy-induced glioma invasion is associated with accumulation of Tie2-expressing monocytes

Konrad Gabrusiewicz et al. Oncotarget. .

Abstract

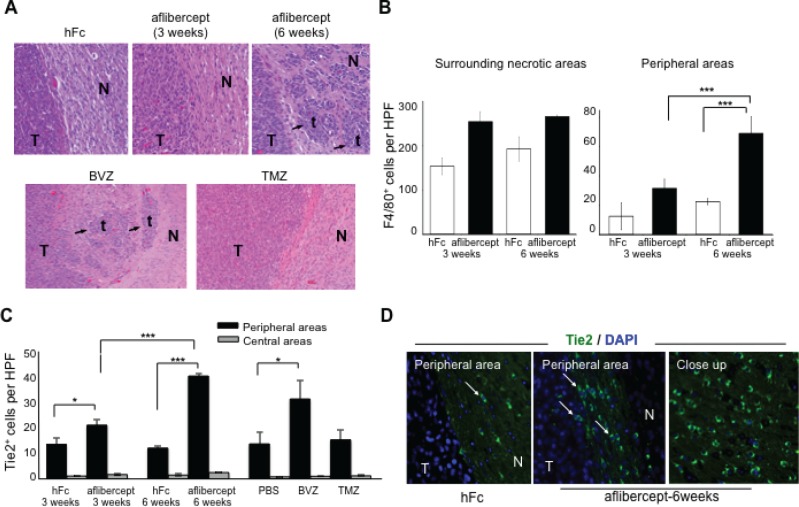
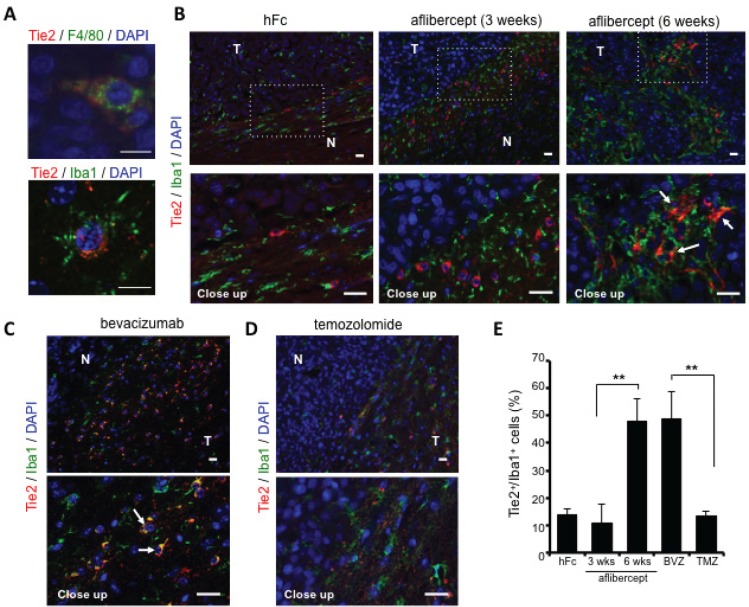
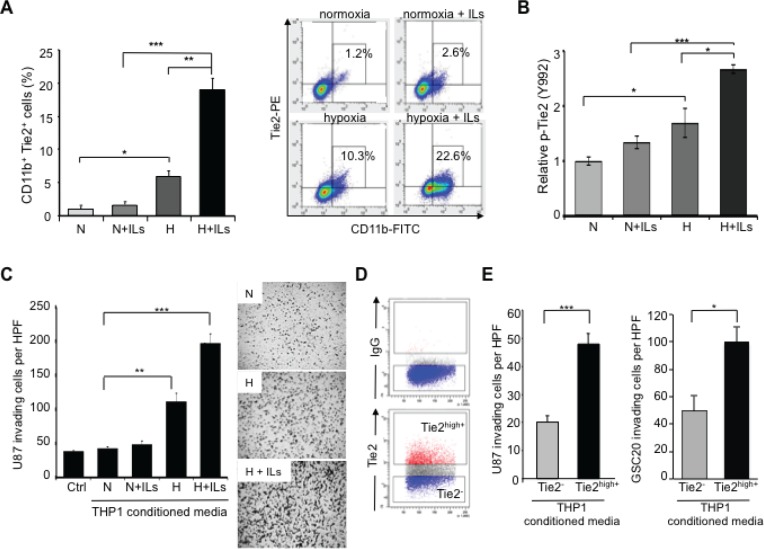
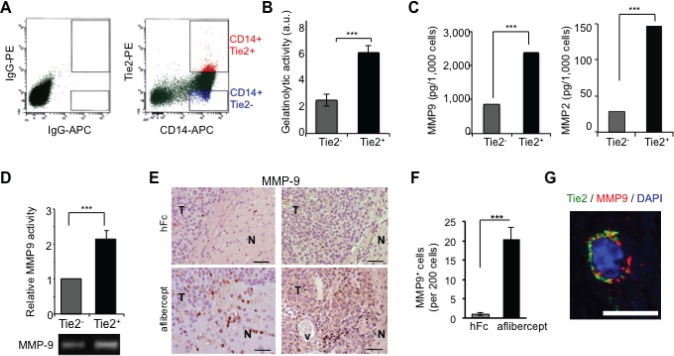
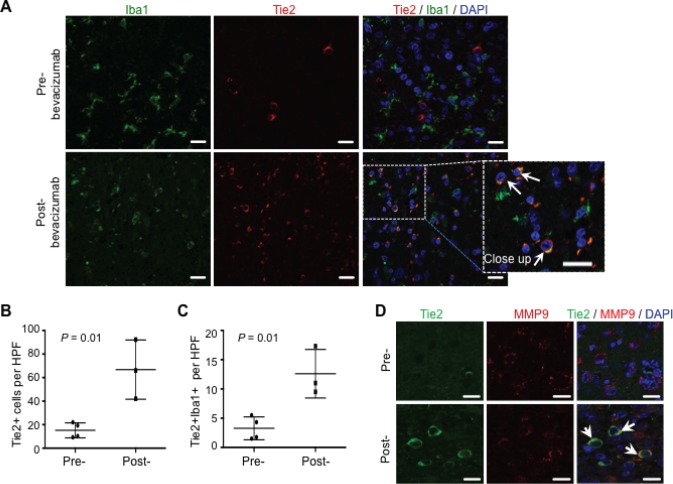
The addition of anti-angiogenic therapy to the few treatments available to patients with malignant gliomas was based on the fact that these tumors are highly vascularized and on encouraging results from preclinical and clinical studies. However, tumors that initially respond to this therapy invariably recur with the acquisition of a highly aggressive and invasive phenotype. Although several myeloid populations have been associated to this pattern of recurrence, a specific targetable population has not been yet identified. Here, we present evidence for the accumulation of Tie2-expressing monocytes/macrophages (TEMs) at the tumor/normal brain interface of mice treated with anti-VEGF therapies in regions with heightened tumoral invasion. Furthermore, we describe the presence of TEMs in malignant glioma surgical specimens that recurred after bevacizumab treatment. Our studies showed that TEMs enhanced the invasive properties of glioma cells and secreted high levels of gelatinase enzymatic proteins. Accordingly, Tie2⁺MMP9⁺ monocytic cells were consistently detected in the invasive tumor edge upon anti-VEGF therapies. Our results suggest the presence of a specific myeloid/monocytic subpopulation that plays a pivotal role in the mechanism of escape of malignant gliomas from anti-VEGF therapies and therefore constitutes a new cellular target for combination therapies in patients selected for anti-angiogenesis treatment.


Figures

Figure 1
Figure 1. Accumulation of tumor-infiltrating microglia/macrophages and Tie2+ cells at the tumor edge of intracranial U-87 MG glioma-bearing mice after anti-VEGF treatment
(A) Anti-angiogenic treatment induced invasive tumor outgrowth in the malignant glioma model. Tumor sections from mice treated, as indicated in Methods section, with hFc (control), aflibercept (for 3 weeks or 6 weeks), bevacizumab (BVZ), or TMZ were stained with Harris hematoxylin and eosin. Arrows point to tumor nodules and satellitosis in sections from tumor-bearing mice that received aflibercept for 6 weeks or bevacizumab. No invasive glioma features (N, normal brain; T, tumor; t, tumor nodule) were observed in animals treated with hFc, aflibercept for 3 weeks, or TMZ. Magnification: upper row (20x), lower row (10x). (B) Quantification of F4/80+ cells in surrounding necrotic tumor areas and in peripheral tumor/normal brain edges in mice treated with hFc or aflibercept as indicated. F4/80+ cells were counted with a high-power field (HPF) (200x). Data are presented as mean ± SD (n = 4-5 animals per group). *** P < 0.001. (C) Quantification of Tie2+ cells at glioma tumor edge and at the tumor center from mice treated with hFc for 3 weeks or 6 weeks, aflibercept for 3 weeks or 6 weeks, phosphate-buffered saline (PBS; a control), bevacizumab, or TMZ. Tie2+ cells were counted with a high-power field (HPF) (200x). Data are presented as mean ± SD (n = 4-5 animals per group). * P < 0.05; *** P < 0.001. (D) Representative images of Tie2 staining of sections from mice treated with hFc or aflibercept (6 weeks). Pictures show merged fluorescent Tie2 (green) and DAPI (blue). Arrows indicate Tie2+ cells. N, normal tissue; T, tumor. Magnification: 200x; closeup, 400x.
Figure 2
Figure 2. Over-representation of TEMs at the invasive front of tumors treated with anti-VEGF agents
(A) Double immunofluorescence revealed co-localization of Tie2 (red) and F4/80 (green, top) or Iba1 (green, bottom) using confocal microscopy. DAPI was used for nuclear staining (blue). Scale bar = 10 μm. (B) Representative fluorescence images of Tie2 (red) and Iba1 (green) staining in brains of U-87 MG-bearing mice that received hFc or aflibercept (3 weeks or 6 weeks). DAPI was used for nuclear staining (blue). White arrows point to Tie2+Iba1+ cells. N, normal brain; T, tumor. Scale bar = 20 μm for both top and bottom rows. (C-D) Representative pictures of Tie2/Iba1 immunofluorescence on brain tumor slides from animals treated with bevacizumab (C) or TMZ (D). White arrows indicate Tie2+Iba1+ cells. DAPI was used for nuclear staining (blue). Scale bar = 20 μm for both top and bottom rows. (E) Quantification of percentage of Tie2+/Iba1+ cells at tumor periphery of mice treated with hFc, aflibercept (3 weeks or 6 weeks), bevacizumab (BVZ), or TMZ. Data are presented as percentage ± SD of Tie2+/Iba1+ cells among Iba1+cells (n = 3-4 animals per group). ** P < 0.01.
Figure 3
Figure 3. TEMs induce an invasive glioma cell phenotype
(A) Quantification of CD11b+Tie2+ subpopulations in THP-1 monocytic cells exposed to normoxia alone (N), hypoxia (H) alone, or co-stimulated with IL4 and IL13 (ILs). Left panel: Data are presented as mean ± SD from three independent experiments. *P < 0.05, **P < 0.01, ***P < 0.001. Right panel: Representative dot plot illustrating the percentage of Tie2+CD11b+ cells after the indicated culture treatments. (B) Determination of Tie2 phosphorylation levels in THP-1 monocytic cells exposed to normoxia alone, hypoxia alone, or co-stimulated with ILs. Data represent relative fluorescence determined by normalizing phospho-Tie2 fluorescence unit levels to the total Tie2 fluorescence unit levels. *P < 0.05, ***P < 0.001. (C) Invasion assay highlighted the role of TEMs in the invasive phenotype of gliomas. Conditioned medium was collected from THP-1 cells subjected to normoxia or hypoxia in the presence or absence of ILs and placed in the bottom well of a modified Boyden chamber. U-87 MG cells were plated in the top Matrigel-coated transwells. Left panel: Data are presented as mean ± SD of invading U-87 MG cells per HPF (200x). **P < 0.01, ***P < 0.001. Right panel: Representative images of crystal violet–stained U-87 MG cells that invaded the Matrigel layer (magnification, 50x). (D) Representative dot plot analysis for the identification of Tie2+ and Tie2- cell populations from THP-1 monocytic cells that were exposed to hypoxia and ILs. Selected populations were sorted and conditioned medium was collected. (E) U-87 MG and GSC20 invasion properties were measured using a modified Boyden chamber assay as explained in (C), where conditioned media were obtained from sorted Tie2+ and Tie2- THP-1 cultures. Data are presented as mean ± SD number of invading glioma cells per microscopic field (200x) from three independent experiments. *** P < 0.001, * P < 0.05.
Figure 4
Figure 4. TEMs are a major source of gelatinase activity and MMP9 secretion
(A) Enriched monocyte population isolated from PBMCs of healthy donors was doubly stained for CD14 and Tie2 and sorted as Tie2+ (CD14+Tie2+) cells or Tie2- (CD14+Tie2-) cells using FACS. Shown is a representative dot plot analysis. (B) Quantification of gelatinolytic activity present in conditioned medium of sorted CD14+ Tie2+ and CD14+ Tie2- cells obtained from the enriched monocytic population present in PBMCs. Data are represented as mean ± SD from three independent experiments. *** P < 0.001. (C) Quantification of MMP9 and MMP2 levels present in conditioned medium of sorted CD14+Tie2+ and CD14+Tie2- cells obtained from the enriched monocytic population present in PBMCs. Data are presented as mean ± SD from three independent experiments. *** P < 0.001. (D) Conditioned medium from Tie2+ and Tie2- monocytic subsets analyzed by zymography revealed higher MMP9 activity in conditioned medium from Tie2+ monocytic cultures than in Tie2- monocytic cultures sorted from THP1 cultures. Data represent mean ± SD from three independent experiments. *** P < 0.001. (E) MMP9 detection in sections of brains from U-87 MG xenograft-bearing mice treated with aflibercept (6-week schedule). Note the presence of MMP9 immunoreactivity in infiltrative areas of tumors from mice treated with the anti-VEGF agent. N, normal tissue; T, tumor; v, vessel. Scale bar = 50 μm. (F) Quantification of MMP9 positive cells in sections of brains from U-87 MG xenograft-bearing mice treated with aflibercept (6-week schedule). Data are represented as mean ± SD of MMP9+ cells per 200 cells. (G) Confocal z-stack image of Tie2 (green) and MMP9 (red) double immunofluorescence in sections from U-87 MG xenografts treated with aflibercept (6 weeks). DAPI was used for nuclear staining (blue). Scale bar = 10 μm.
Figure 5
Figure 5. TEMs can be detected in human surgical glioblastoma specimens after bevacizumab therapy
(A) Glioblastoma specimens after treatment with standard chemotherapy (pre-) or with bevacizumab (post-) were analyzed for Iba1 (green) and Tie2 (red) expression. DAPI was used for nuclear staining (blue). Scale bars = 20 μm. Note the over-representation of TEMs (Tie2+Iba1+ cells) in the post-bevacizumab tumor. White arrows indicate the presence of Tie2+Iba1+ cells. Scale bars = 20 μm. (B) Quantification of Tie2+ cells in surgical human glioblastoma recurring after standard therapy (Pre-; n = 4) or after bevacizumab (Post-; n = 3). Data are represented as mean ± SD of Tie2+ cells present in a HPF. (C) Quantification of Tie2+Iba1+ double positive cells in surgical human glioblastoma recurring after standard therapy (Pre-; n = 4) or after bevacizumab (Post-; n = 3). Data are represented as mean ± SD of Tie2+ cells present in a HPF. (D) Tie2+ cells overexpressed MMP9, as indicated with the double immunofluorescence for Tie2 (green) and MMP9 (red) expression. DAPI was used for nuclear staining (blue). White arrows indicate the presence of Tie2+MMP9+ cells. Scale bar = 20 μm.

References

    1. Dolecek TA, Propp JM, Stroup NE, Kruchko C. CBTRUS statistical report: primary brain and central nervous system tumors diagnosed in the United States in 2005-2009. Neuro Oncol. 2012;14(Suppl 5):v1–49. - PMC - PubMed
    1. Van Meir EG, Hadjipanayis CG, Norden AD, Shu HK, Wen PY, Olson JJ. Exciting new advances in neuro-oncology: the avenue to a cure for malignant glioma. CA Cancer J Clin. 2010;60:166–193. - PMC - PubMed
    1. Wen PY, Kesari S. Malignant gliomas in adults. N Engl J Med. 2008;359:492–507. - PubMed
    1. Kreisl TN, Kim L, Moore K, Duic P, Royce C, Stroud I, Garren N, Mackey M, Butman JA, Camphausen K, Park J, Albert PS, Fine HA. Phase II trial of single-agent bevacizumab followed by bevacizumab plus irinotecan at tumor progression in recurrent glioblastoma. J Clin Oncol. 2009;27:740–745. - PMC - PubMed
    1. Friedman HS, Prados MD, Wen PY, Mikkelsen T, Schiff D, Abrey LE, Yung WK, Paleologos N, Nicholas MK, Jensen R, Vredenburgh J, Huang J, Zheng M, Cloughesy T. Bevacizumab alone and in combination with irinotecan in recurrent glioblastoma. J Clin Oncol. 2009;27:4733–4740. - PubMed

Publication types

MeSH terms