

A long non-coding RNA signature to improve prognosis prediction of colorectal cancer
- PMID: 24809982
- PMCID: PMC4039159
- DOI: 10.18632/oncotarget.1895
A long non-coding RNA signature to improve prognosis prediction of colorectal cancer
Abstract
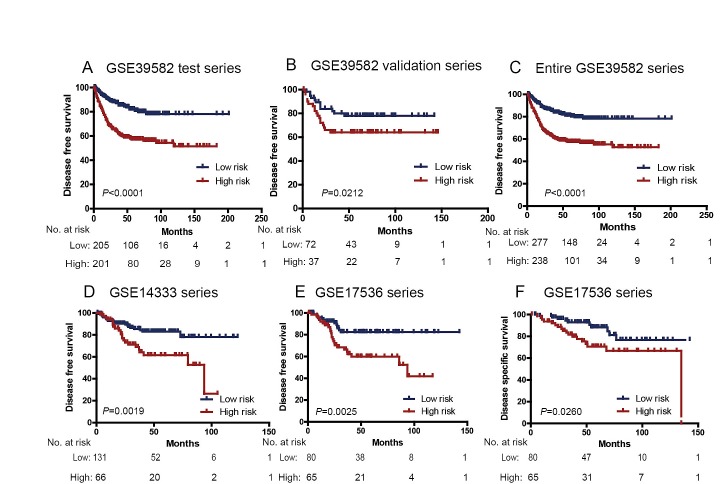
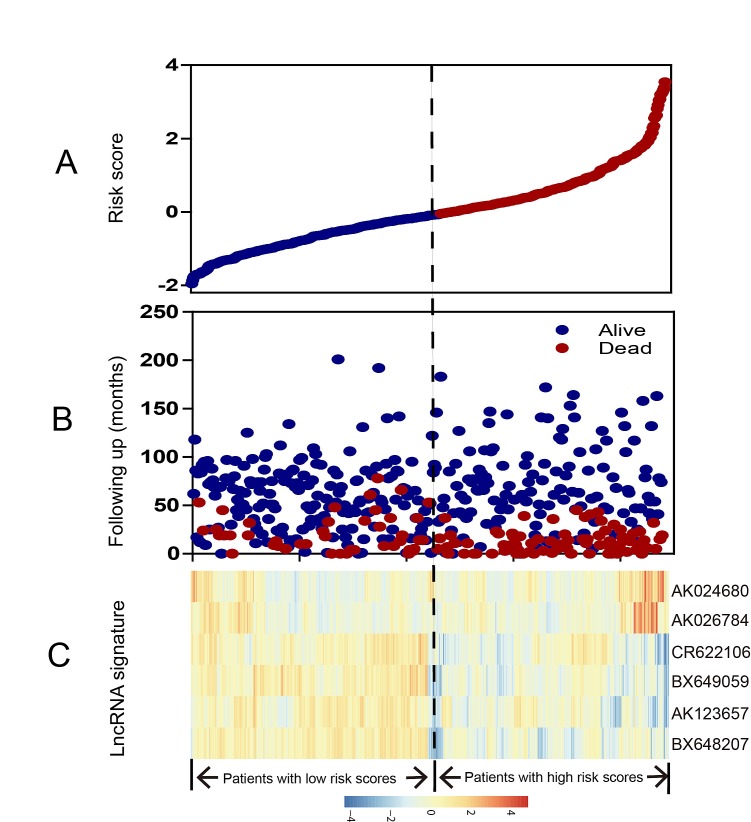
Increasing evidence suggests long non-coding RNAs (lncRNAs) are frequently aberrantly expressed in cancers, however, few related lncRNA signatures have been established for prediction of cancer prognosis. We aimed to develop a lncRNA signature to improve prognosis prediction of colorectal cancer (CRC). Using a lncRNA-mining approach, we performed lncRNA expression profiling in large CRC cohorts from Gene Expression Ominus (GEO), including GSE39582 test series(N=436), internal validation series (N=117); and two independent validation series GSE14333 (N=197) and GSE17536(N=145). We established a set of six lncRNAs that were significantly correlated with the disease free survival (DFS) in the test series. Based on this six-lncRNA signature, the test series patients could be classified into high-risk and low-risk subgroups with significantly different DFS (HR=2.670; P<0.0001). The prognostic value of this six-lncRNA signature was confirmed in the internal validation series and another two independent CRC sets. Gene set enrichment analysis (GSEA) analysis suggested that risk score positively correlated with several cancer metastasis related pathways. Functional experiments demonstrated three dysregulated lncRNAs, AK123657, BX648207 and BX649059 were required for efficient invasion and proliferation suppression in CRC cell lines. Our results might provide an efficient classification tool for clinical prognosis evaluation of CRC.
Conflict of interest statement
None of the authors declare conflicts of interest.
Figures


Similar articles
-
A long non-coding RNA signature to improve prognosis prediction of gastric cancer.Mol Cancer. 2016 Sep 20;15(1):60. doi: 10.1186/s12943-016-0544-0. Mol Cancer. 2016. PMID: 27647437 Free PMC article.
-
Discovery of a novel six-long non-coding RNA signature predicting survival of colorectal cancer patients.J Cell Biochem. 2018 Apr;119(4):3574-3585. doi: 10.1002/jcb.26548. Epub 2018 Jan 15. J Cell Biochem. 2018. PMID: 29227531
-
A Six-LncRNA Expression Signature Associated with Prognosis of Colorectal Cancer Patients.Cell Physiol Biochem. 2018;50(5):1882-1890. doi: 10.1159/000494868. Epub 2018 Nov 5. Cell Physiol Biochem. 2018. PMID: 30396175
-
Identification and Validation of Six Autophagy-related Long Non-coding RNAs as Prognostic Signature in Colorectal Cancer.Int J Med Sci. 2021 Jan 1;18(1):88-98. doi: 10.7150/ijms.49449. eCollection 2021. Int J Med Sci. 2021. PMID: 33390777 Free PMC article.
-
A three-lncRNA signature predicts overall survival and disease-free survival in patients with esophageal squamous cell carcinoma.BMC Cancer. 2018 Feb 6;18(1):147. doi: 10.1186/s12885-018-4058-6. BMC Cancer. 2018. PMID: 29409459 Free PMC article.
Cited by
-
Somatic gene copy number alterations in colorectal cancer: new quest for cancer drivers and biomarkers.Oncogene. 2016 Apr 21;35(16):2011-9. doi: 10.1038/onc.2015.304. Epub 2015 Aug 10. Oncogene. 2016. PMID: 26257062 Review.
-
Co-expression analysis identifies long noncoding RNA SNHG1 as a novel predictor for event-free survival in neuroblastoma.Oncotarget. 2016 Sep 6;7(36):58022-58037. doi: 10.18632/oncotarget.11158. Oncotarget. 2016. PMID: 27517149 Free PMC article.
-
Prediction of Recurrence in Cervical Cancer Using a Nine-lncRNA Signature.Front Genet. 2019 Apr 3;10:284. doi: 10.3389/fgene.2019.00284. eCollection 2019. Front Genet. 2019. PMID: 31001325 Free PMC article.
-
A long non-coding RNA signature for predicting survival in patients with colorectal cancer.Oncotarget. 2017 Dec 19;9(31):21687-21695. doi: 10.18632/oncotarget.23431. eCollection 2018 Apr 24. Oncotarget. 2017. PMID: 29774095 Free PMC article.
-
Silencing of WWP2 inhibits adhesion, invasion, and migration in liver cancer cells.Tumour Biol. 2016 May;37(5):6787-99. doi: 10.1007/s13277-015-4547-z. Epub 2015 Dec 10. Tumour Biol. 2016. PMID: 26662306
References
-
- Ferlay J, Shin HR, Bray F, Forman D, Mathers C, Parkin DM. Estimates of worldwide burden of cancer in 2008: GLOBOCAN 2008. International journal of cancer Journal international du cancer. 2010;127(12):2893–2917. - PubMed
-
- Marisa L, de Reynies A, Duval A, Selves J, Gaub MP, Vescovo L, Etienne-Grimaldi MC, Schiappa R, Guenot D, Ayadi M, Kirzin S, Chazal M, Flejou JF, Benchimol D, Berger A, Lagarde A, et al. Gene expression classification of colon cancer into molecular subtypes: characterization, validation, and prognostic value. PLoS medicine. 2013;10(5):e1001453. - PMC - PubMed
-
- O'Connell JB, Maggard MA, Ko CY. Colon cancer survival rates with the new American Joint Committee on Cancer sixth edition staging. Journal of the National Cancer Institute. 2004;96(19):1420–1425. - PubMed
-
- Fu Y, Li J, Lee AS. GRP78/BiP inhibits endoplasmic reticulum BIK and protects human breast cancer cells against estrogen starvation-induced apoptosis. Cancer research. 2007;67(8):3734–3740. - PubMed
-
- Chang W, Gao X, Han Y, Du Y, Liu Q, Wang L, Tan X, Zhang Q, Liu Y, Zhu Y, Yu Y, Fan X, Zhang H, Zhou W, Wang J, Fu C, et al. Gene expression profiling-derived immunohistochemistry signature with high prognostic value in colorectal carcinoma. Gut. 2013 - PubMed
Publication types
MeSH terms
Substances
Associated data
- Actions
- Actions
- Actions
- Actions
LinkOut - more resources
Full Text Sources
Other Literature Sources
Medical
