

Combined PDK1 and CHK1 inhibition is required to kill glioblastoma stem-like cells in vitro and in vivo
- PMID: 24810059
- PMCID: PMC4047898
- DOI: 10.1038/cddis.2014.188
Combined PDK1 and CHK1 inhibition is required to kill glioblastoma stem-like cells in vitro and in vivo
Abstract
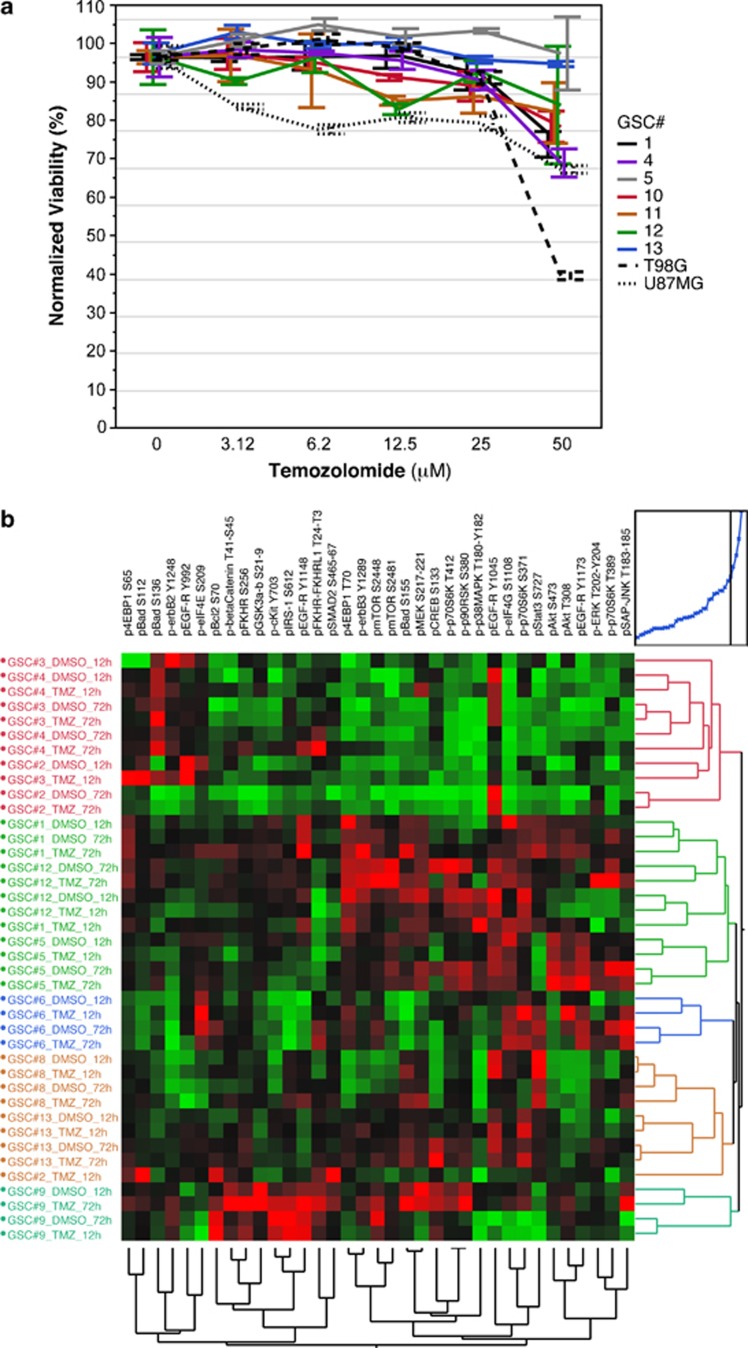
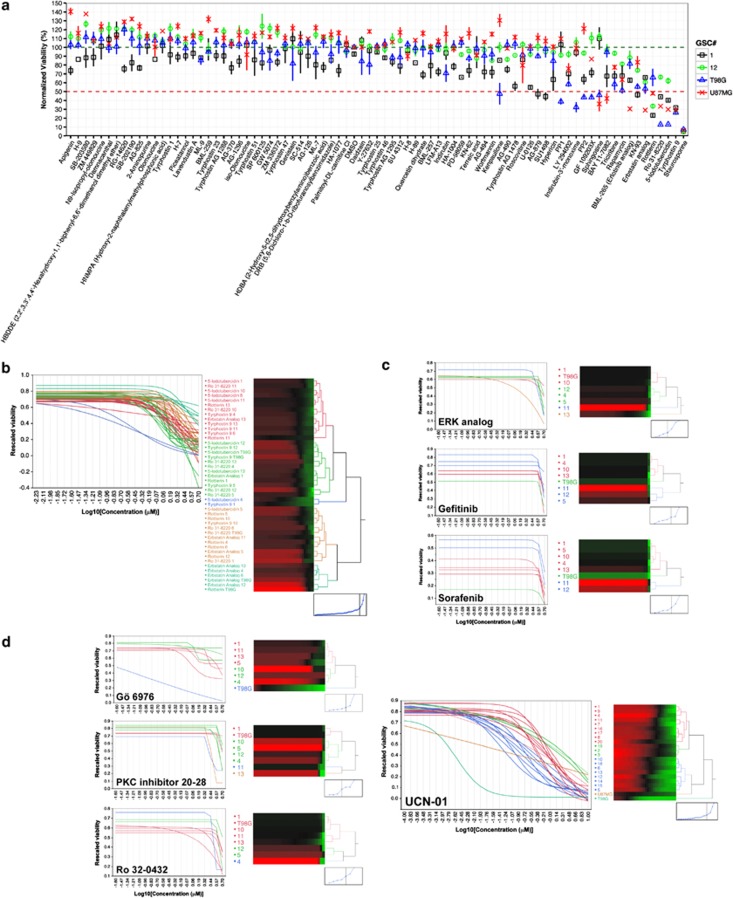
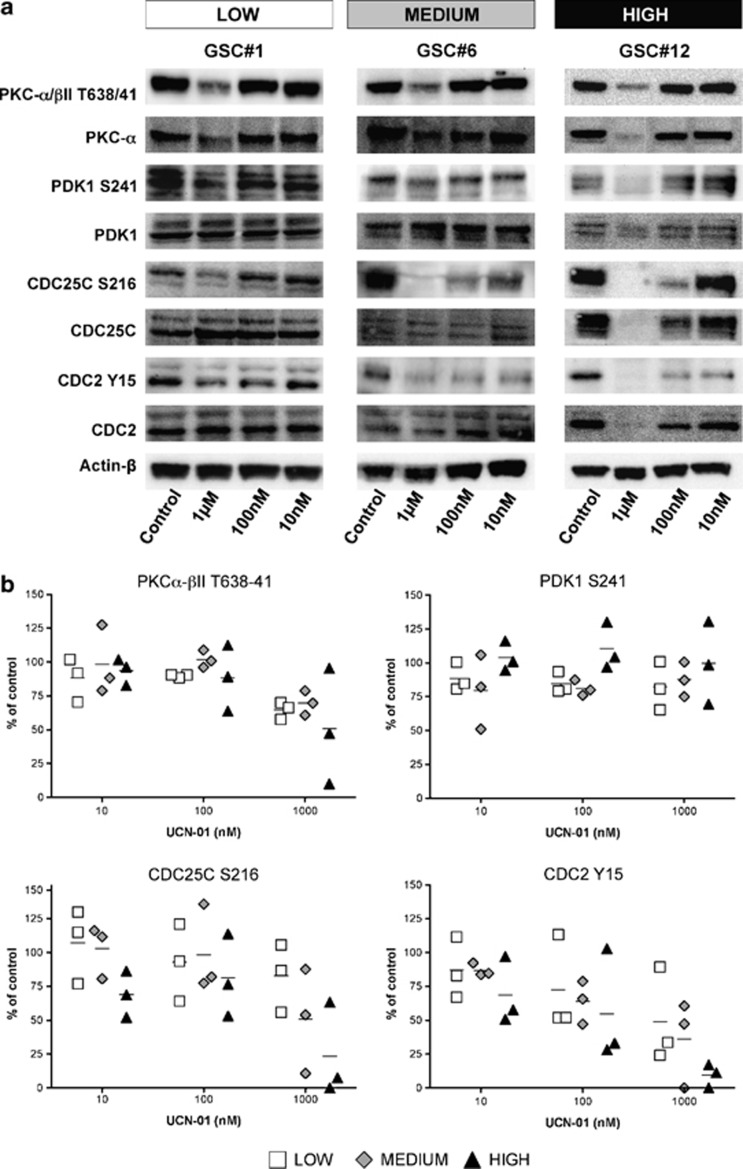
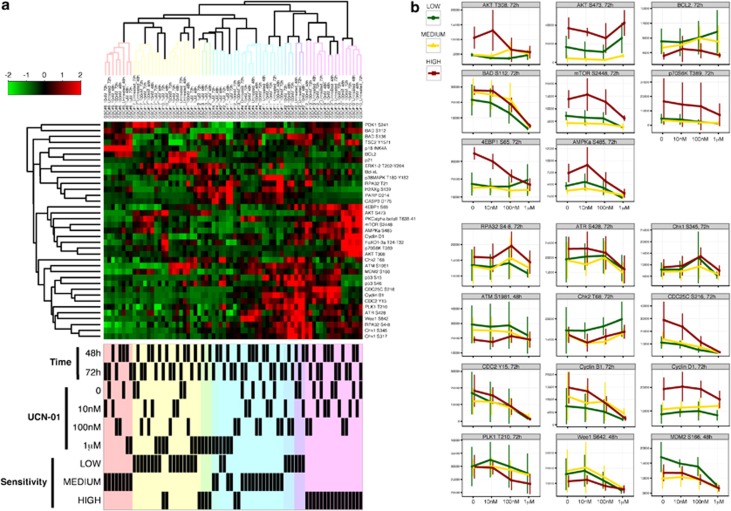
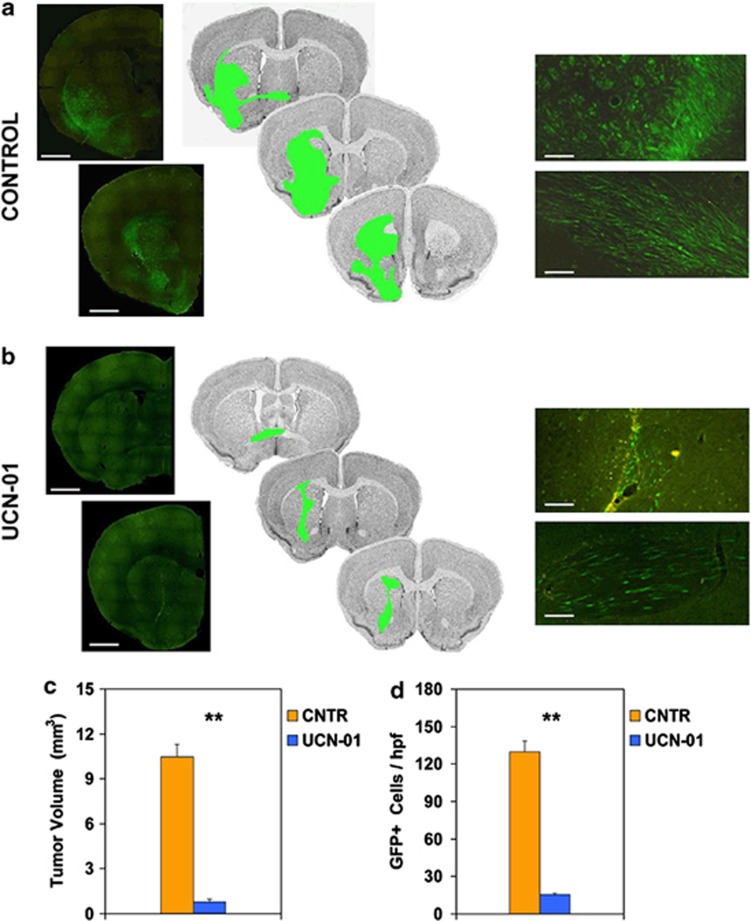
Glioblastoma (GBM) is the most common and deadly adult brain tumor. Despite aggressive surgery, radiation, and chemotherapy, the life expectancy of patients diagnosed with GBM is ∼14 months. The extremely aggressive nature of GBM results from glioblastoma stem-like cells (GSCs) that sustain GBM growth, survive intensive chemotherapy, and give rise to tumor recurrence. There is accumulating evidence revealing that GSC resilience is because of concomitant activation of multiple survival pathways. In order to decode the signal transduction networks responsible for the malignant properties of GSCs, we analyzed a collection of GSC lines using a dual, but complementary, experimental approach, that is, reverse-phase protein microarrays (RPPMs) and kinase inhibitor library screening. We treated GSCs in vitro with clinically relevant concentrations of temozolomide (TMZ) and performed RPPM to detect changes in phosphorylation patterns that could be associated with resistance. In addition, we screened GSCs in vitro with a library of protein and lipid kinase inhibitors to identify specific targets involved in GSC survival and proliferation. We show that GSCs are relatively insensitive to TMZ treatment in terms of pathway activation and, although displaying heterogeneous individual phospho-proteomic profiles, most GSCs are resistant to specific inhibition of the major signaling pathways involved in cell survival and proliferation. However, simultaneous multipathway inhibition by the staurosporin derivative UCN-01 results in remarkable inhibition of GSC growth in vitro. The activity of UCN-01 on GSCs was confirmed in two in vivo models of GBM growth. Finally, we used RPPM to study the molecular and functional effects of UCN-01 and demonstrated that the sensitivity to UCN-01 correlates with activation of survival signals mediated by PDK1 and the DNA damage response initiated by CHK1. Taken together, our results suggest that a combined inhibition of PDK1 and CHK1 represents a potentially effective therapeutic approach to reduce the growth of human GBM.
Figures

Similar articles
-
Identification of GSK3β inhibitor kenpaullone as a temozolomide enhancer against glioblastoma.Sci Rep. 2019 Jul 11;9(1):10049. doi: 10.1038/s41598-019-46454-8. Sci Rep. 2019. PMID: 31296906 Free PMC article.
-
A novel drug conjugate, NEO212, targeting proneural and mesenchymal subtypes of patient-derived glioma cancer stem cells.Cancer Lett. 2016 Feb 28;371(2):240-50. doi: 10.1016/j.canlet.2015.11.040. Epub 2015 Dec 9. Cancer Lett. 2016. PMID: 26683773
-
Dual mTORC1/2 blockade inhibits glioblastoma brain tumor initiating cells in vitro and in vivo and synergizes with temozolomide to increase orthotopic xenograft survival.Clin Cancer Res. 2014 Nov 15;20(22):5756-67. doi: 10.1158/1078-0432.CCR-13-3389. Epub 2014 Oct 14. Clin Cancer Res. 2014. PMID: 25316808
-
The Importance of Tumor Stem Cells in Glioblastoma Resistance to Therapy.Int J Mol Sci. 2021 Apr 8;22(8):3863. doi: 10.3390/ijms22083863. Int J Mol Sci. 2021. PMID: 33917954 Free PMC article. Review.
-
Hunting glioblastoma recurrence: glioma stem cells as retrospective targets.Am J Physiol Cell Physiol. 2025 Mar 1;328(3):C1045-C1061. doi: 10.1152/ajpcell.00344.2024. Epub 2025 Jan 16. Am J Physiol Cell Physiol. 2025. PMID: 39818986 Review.
Cited by
-
UCN-01 enhances cytotoxicity of irinotecan in colorectal cancer stem-like cells by impairing DNA damage response.Oncotarget. 2016 Jul 12;7(28):44113-44128. doi: 10.18632/oncotarget.9859. Oncotarget. 2016. PMID: 27286453 Free PMC article.
-
Multicellular biomarkers of drug resistance as promising targets for glioma precision medicine and predictors of patient survival.Cancer Drug Resist. 2022 Jun 2;5(2):511-533. doi: 10.20517/cdr.2021.145. eCollection 2022. Cancer Drug Resist. 2022. PMID: 35800363 Free PMC article.
-
Inhibition of autophagy increases susceptibility of glioblastoma stem cells to temozolomide by igniting ferroptosis.Cell Death Dis. 2018 Aug 6;9(8):841. doi: 10.1038/s41419-018-0864-7. Cell Death Dis. 2018. PMID: 30082680 Free PMC article.
-
Human mesenchymal stromal cells inhibit tumor growth in orthotopic glioblastoma xenografts.Stem Cell Res Ther. 2017 Mar 9;8(1):53. doi: 10.1186/s13287-017-0516-3. Stem Cell Res Ther. 2017. PMID: 28279193 Free PMC article.
-
The clinical value of patient-derived glioblastoma tumorspheres in predicting treatment response.Neuro Oncol. 2017 Aug 1;19(8):1097-1108. doi: 10.1093/neuonc/now304. Neuro Oncol. 2017. PMID: 28204560 Free PMC article.
References
-
- Schwartzbaum JA, Fisher JL, Aldape KD, Wrensch M.Epidemiology and molecular pathology of glioma Nat Clin Pract Neurol 20062494–503.quiz 491 p following 516. - PubMed
-
- Tanaka S, Louis DN, Curry WT, Batchelor TT, Dietrich J. Diagnostic and therapeutic avenues for glioblastoma: no longer a dead end. Nat Rev Clin Oncol. 2013;10:14–26. - PubMed
-
- Eramo A, Ricci-Vitiani L, Zeuner A, Pallini R, Lotti F, Sette G, et al. Chemotherapy resistance of glioblastoma stem cells. Cell Death Differ. 2006;13:1238–1241. - PubMed
-
- Weller M, Stupp R, Hegi M, Wick W. Individualized targeted therapy for glioblastoma: fact or fiction. Cancer J. 2012;18:40–44. - PubMed
-
- Singh SK, Hawkins C, Clarke ID, Squire JA, Bayani J, Hide T, et al. Identification of human brain tumour initiating cells. Nature. 2004;432:396–401. - PubMed
Publication types
MeSH terms
Substances
LinkOut - more resources
Full Text Sources
Other Literature Sources
Medical
Molecular Biology Databases
Research Materials
Miscellaneous
