Trypanosoma brucei TIF2 suppresses VSG switching by maintaining subtelomere integrity
- PMID: 24810301
- PMCID: PMC4085761
- DOI: 10.1038/cr.2014.60
Trypanosoma brucei TIF2 suppresses VSG switching by maintaining subtelomere integrity
Abstract
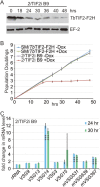
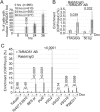
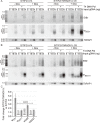
Subtelomeres consist of sequences adjacent to telomeres and contain genes involved in important cellular functions, as subtelomere instability is associated with several human diseases. Balancing between subtelomere stability and plasticity is particularly important for Trypanosoma brucei, a protozoan parasite that causes human African trypanosomiasis. T. brucei regularly switches its major variant surface antigen, variant surface glycoprotein (VSG), to evade the host immune response, and VSGs are expressed exclusively from subtelomeres in a strictly monoallelic fashion. Telomere proteins are important for protecting chromosome ends from illegitimate DNA processes. However, whether they contribute to subtelomere integrity and stability has not been well studied. We have identified a novel T. brucei telomere protein, T. brucei TRF-Interacting Factor 2 (TbTIF2), as a functional homolog of mammalian TIN2. A transient depletion of TbTIF2 led to an elevated VSG switching frequency and an increased amount of DNA double-strand breaks (DSBs) in both active and silent subtelomeric bloodstream form expression sites (BESs). Therefore, TbTIF2 plays an important role in VSG switching regulation and is important for subtelomere integrity and stability. TbTIF2 depletion increased the association of TbRAD51 with the telomeric and subtelomeric chromatin, and TbRAD51 deletion further increased subtelomeric DSBs in TbTIF2-depleted cells, suggesting that TbRAD51-mediated DSB repair is the underlying mechanism of subsequent VSG switching. Surprisingly, significantly more TbRAD51 associated with the active BES than with the silent BESs upon TbTIF2 depletion, and TbRAD51 deletion induced much more DSBs in the active BES than in the silent BESs in TbTIF2-depleted cells, suggesting that TbRAD51 preferentially repairs DSBs in the active BES.
Figures


Similar articles
-
Trypanosoma brucei TIF2 and TRF Suppress VSG Switching Using Overlapping and Independent Mechanisms.PLoS One. 2016 Jun 3;11(6):e0156746. doi: 10.1371/journal.pone.0156746. eCollection 2016. PLoS One. 2016. PMID: 27258069 Free PMC article.
-
Trypanosoma brucei RAP1 maintains telomere and subtelomere integrity by suppressing TERRA and telomeric RNA:DNA hybrids.Nucleic Acids Res. 2017 Jun 2;45(10):5785-5796. doi: 10.1093/nar/gkx184. Nucleic Acids Res. 2017. PMID: 28334836 Free PMC article.
-
Telomere and Subtelomere R-loops and Antigenic Variation in Trypanosomes.J Mol Biol. 2020 Jul 10;432(15):4167-4185. doi: 10.1016/j.jmb.2019.10.025. Epub 2019 Nov 2. J Mol Biol. 2020. PMID: 31682833 Free PMC article. Review.
-
Suppression of subtelomeric VSG switching by Trypanosoma brucei TRF requires its TTAGGG repeat-binding activity.Nucleic Acids Res. 2014 Nov 10;42(20):12899-911. doi: 10.1093/nar/gku942. Epub 2014 Oct 13. Nucleic Acids Res. 2014. PMID: 25313155 Free PMC article.
-
Regulation of Antigenic Variation by Trypanosoma brucei Telomere Proteins Depends on Their Unique DNA Binding Activities.Pathogens. 2021 Jul 30;10(8):967. doi: 10.3390/pathogens10080967. Pathogens. 2021. PMID: 34451431 Free PMC article. Review.
Cited by
-
Immunoprecipitation of RNA-DNA hybrid interacting proteins in Trypanosoma brucei reveals conserved and novel activities, including in the control of surface antigen expression needed for immune evasion by antigenic variation.Nucleic Acids Res. 2023 Nov 10;51(20):11123-11141. doi: 10.1093/nar/gkad836. Nucleic Acids Res. 2023. PMID: 37843098 Free PMC article.
-
TbRAP1 has an unusual duplex DNA binding activity required for its telomere localization and VSG silencing.Sci Adv. 2020 Sep 18;6(38):eabc4065. doi: 10.1126/sciadv.abc4065. Print 2020 Sep. Sci Adv. 2020. PMID: 32948591 Free PMC article.
-
DNA double strand break position leads to distinct gene expression changes and regulates VSG switching pathway choice.PLoS Pathog. 2021 Nov 12;17(11):e1010038. doi: 10.1371/journal.ppat.1010038. eCollection 2021 Nov. PLoS Pathog. 2021. PMID: 34767618 Free PMC article.
-
In vivo architecture of the telomerase RNA catalytic core in Trypanosoma brucei.Nucleic Acids Res. 2021 Dec 2;49(21):12445-12466. doi: 10.1093/nar/gkab1042. Nucleic Acids Res. 2021. PMID: 34850114 Free PMC article.
-
Transcriptional Regulation of Telomeric Expression Sites and Antigenic Variation in Trypanosomes.Curr Genomics. 2018 Feb;19(2):119-132. doi: 10.2174/1389202918666170911161831. Curr Genomics. 2018. PMID: 29491740 Free PMC article. Review.
References
-
- Gabriels J, Beckers MC, Ding H, et al. Nucleotide sequence of the partially deleted D4Z4 locus in a patient with FSHD identifies a putative gene within each 3.3 kb element. Gene. 1999;236:25–32. - PubMed
-
- van der Maarel SM, Frants RR, Padberg GW. Facioscapulohumeral muscular dystrophy. Biochim Biophys Acta. 2007;1772:186–194. - PubMed
-
- DeScipio C. The 6p subtelomere deletion syndrome. Am J Med Genet C Semin Med Genet. 2007;145C:377–382. - PubMed
-
- Stewart DR, Kleefstra T. The chromosome 9q subtelomere deletion syndrome. Am J Med Genet C Semin Med Genet. 2007;145C:383–392. - PubMed
-
- Trask BJ, Friedman C, Martin-Gallardo A, et al. Members of the olfactory receptor gene family are contained in large blocks of DNA duplicated polymorphically near the ends of human chromosomes. Hum Mol Genet. 1998;7:13–26. - PubMed
Publication types
MeSH terms
Substances
Grants and funding
LinkOut - more resources
Full Text Sources
Other Literature Sources

