. 2014 Apr 30;5(8):2276-92.
doi: 10.18632/oncotarget.1902.

Long noncoding RNA ANRIL indicates a poor prognosis of gastric cancer and promotes tumor growth by epigenetically silencing of miR-99a/miR-449a

Affiliations

Long noncoding RNA ANRIL indicates a poor prognosis of gastric cancer and promotes tumor growth by epigenetically silencing of miR-99a/miR-449a

Er-bao Zhang et al. Oncotarget. .

Abstract

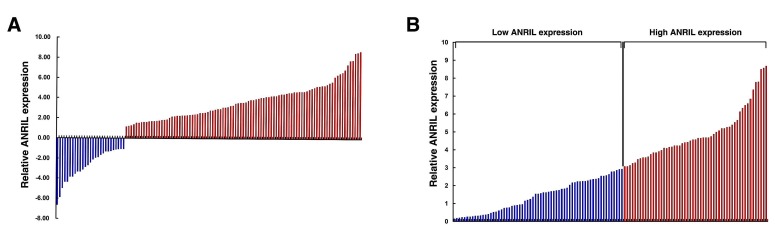
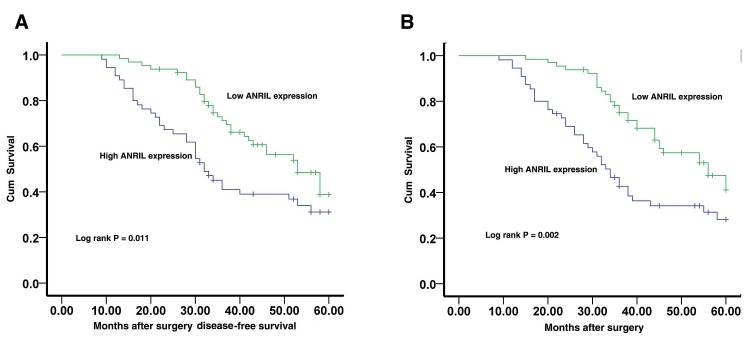
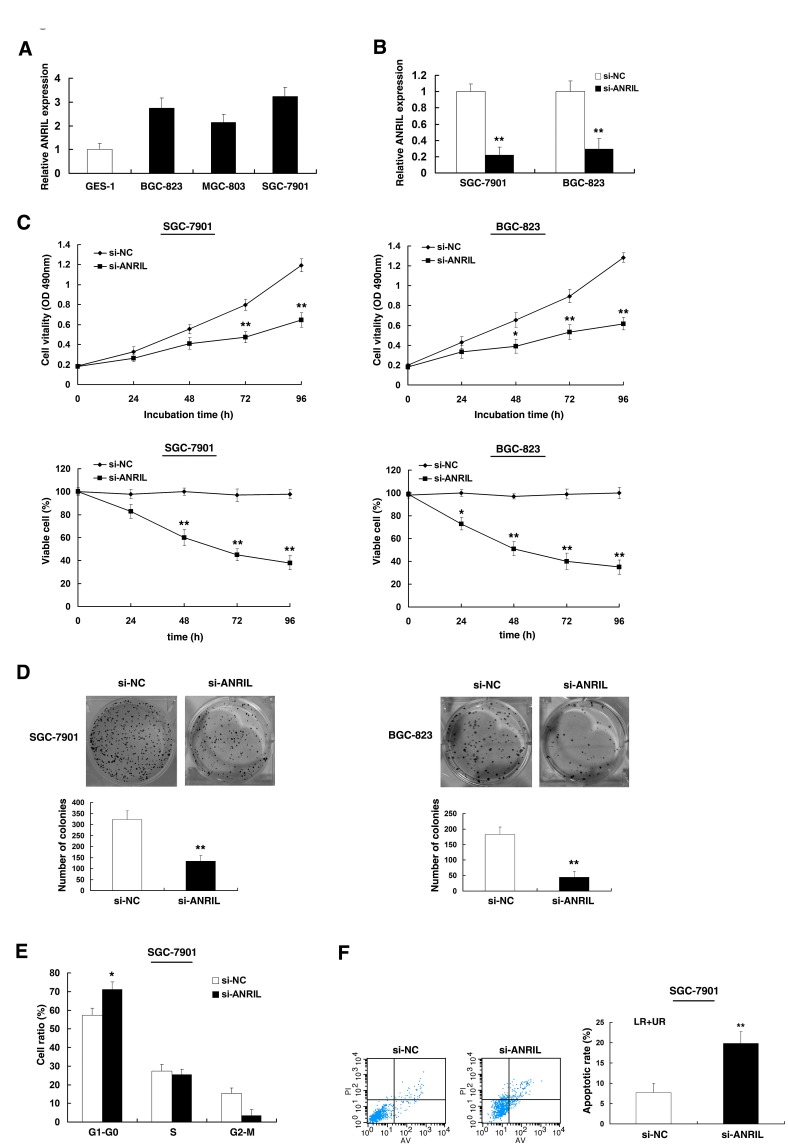
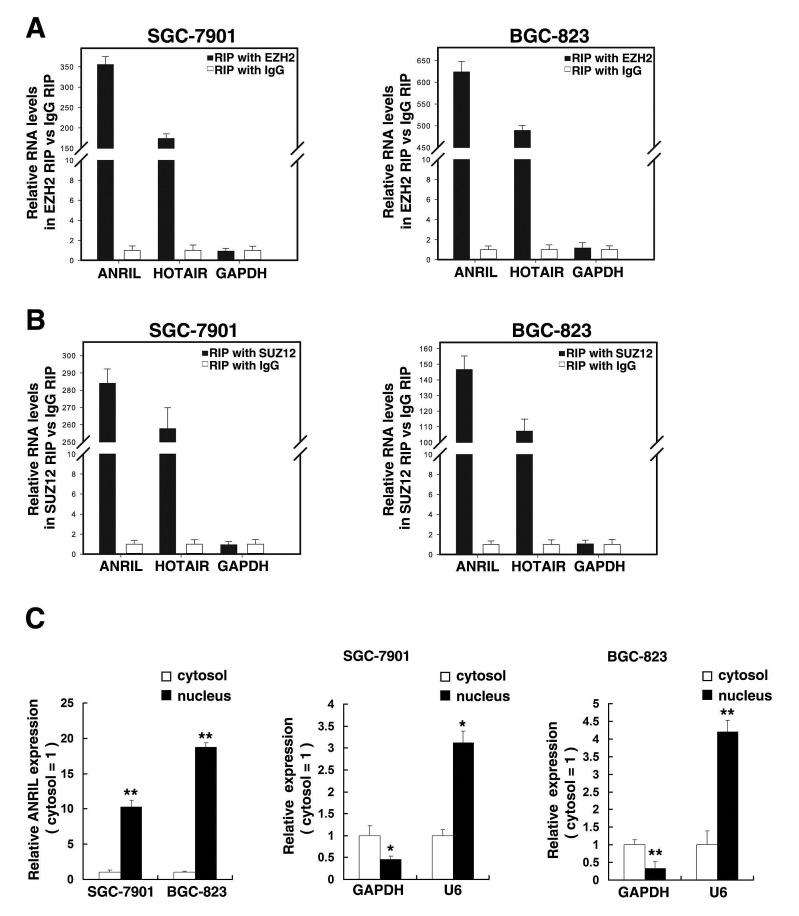
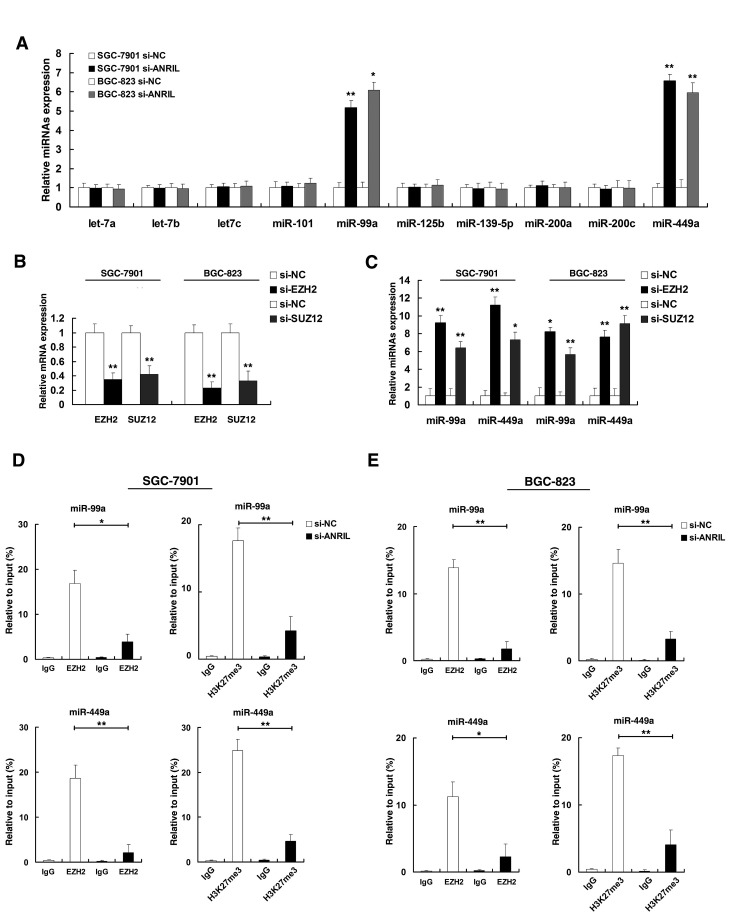
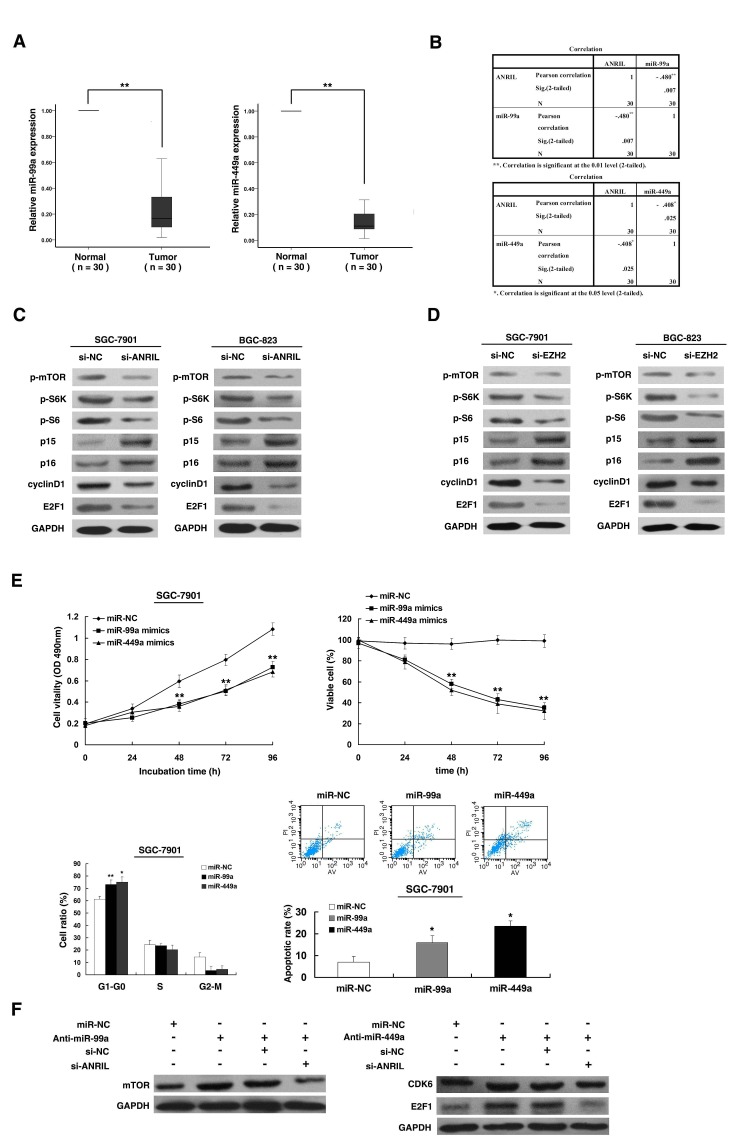
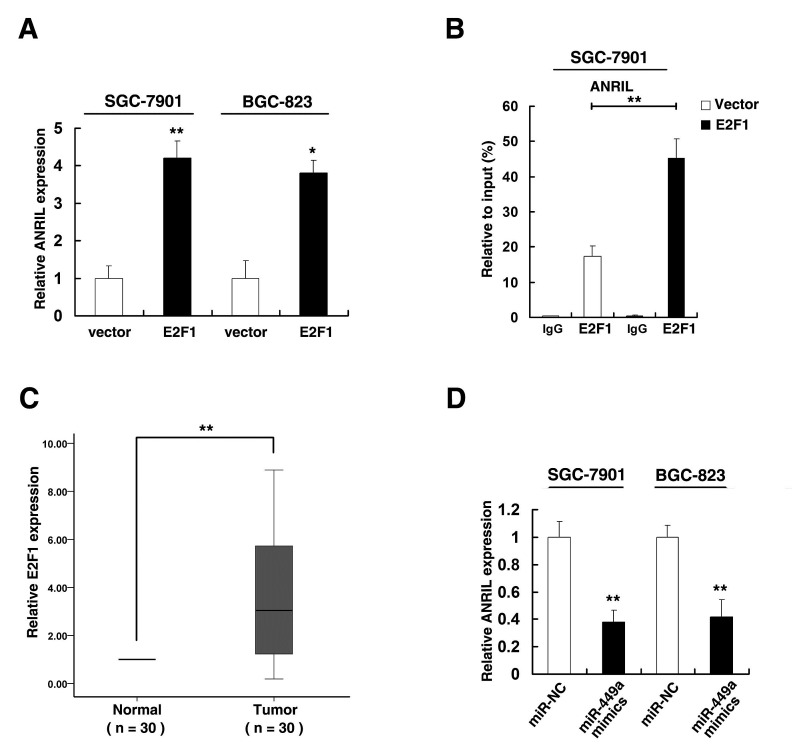
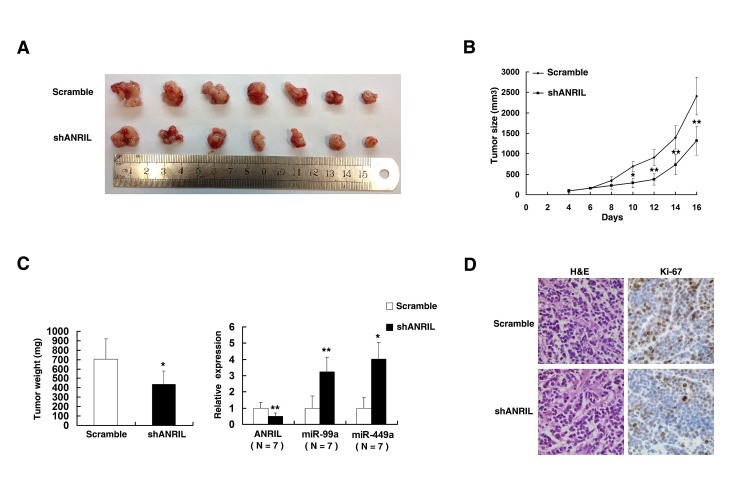
Long noncoding RNAs are involved in diseases including cancer. Here, we reported that ANRIL (CDKN2B-AS1), a 3.8-kb long noncoding RNA, recruiting and binding to PRC2, was generally upregulated in human gastric cancer (GC) tissues. In a cohort of 120 GC patients, the higher expression of ANRIL was significantly correlated with a higher TNM stage (P=0.041) and tumor size (P=0.001). Multivariate analyses revealed that ANRIL expression served as an independent predictor for overall survival (P=0.036). Further experiments revealed that ANRIL knockdown significantly repressed the proliferation both in vitro and in vivo. We also showed that E2F1 could induce ANRIL and ANRIL-mediated growth promotion is in part due to epigenetic repression of miR-99a/miR-449a in Trans (controlling the targets--mTOR and CDK6/E2F1 pathway) by binding to PRC2, thus forming a positive feedback loop, continuing to promote GC cell proliferation. To our knowledge, this is the first report showed that the role of ANRIL in the progression of GC and ANRIL could crosstalk with microRNAs in epigenetic level. Our results suggest that ANRIL, as a growth regulator, may serve as a candidate prognostic biomarker and target for new therapies in human gastric cancer.


Figures

Figure 1
Figure 1. Relative ANRIL expression in human gastric cancer tissues
(A) Relative expression of ANRIL in GC tissues (N = 120) compared with corresponding non-tumor tissues (N = 120). ANRIL expression was examined by qPCR and normalized to GAPDH expression. Results are presented as the fold-change in tumor tissues relative to normal tissues. (B) ANRIL expression was classified into two groups
Figure 2
Figure 2. The correlation between ANRIL expression and the DFS or OS of gastric cancer patients
Kaplan–Meier analysis of disease-free survival (A) or overall survival (B) was analyzed according to ANRIL expression levels.
Figure 3
Figure 3. Effect of ANRIL on gastric cell growth in vitro
(A) Analysis of ANRIL expression levels in GC cell lines (BGC-823, MGC-803, and SGC-7901) compared with the normal gastric epithelium cell line (GES-1) by qRT-PCR. (B) The relative expression level of ANRIL in SGC-7901 and BGC-823 cells, transfected with si-NC or si-ANRIL, was tested by qPCR. (C) MTT and trypan blue assays were performed to determine the cell viability and cell proliferation of SGC-7901 and BGC-823 cells. (D) Representative results of colony formation of SGC-7901 and BGC-823 cells transfected with si-NC or si-ANRIL. (E) At 48h after transfection, cell cycle of SGC-7901 was analyzed by flow cytometry. The bar chart represents the percentage of cells in G1–G0, S, or G2–M phase, as indicated. (F) 48 hours after transfection, SGC-7901 cells were stained and analyzed by flow cytometry. LR, early apoptotic cells. UR, terminal apoptotic cells. Error bars indicate means ± standard errors of the mean. *, P < 0.05, **, P < 0.01.
Figure 4
Figure 4. ANRIL could bind to PRC2, and subcellular fractionation location of ANRIL
(A) RIP experiments were performed in SGC-7901 and BGC-823 cells and the coprecipitated RNA was subjected to qRT-PCR for ANRIL. HOTAIR was used as a positive control. The fold enrichment of ANRIL in EZH2 RIP is relative to its matching IgG control RIP. (B) The fold enrichment of ANRIL in SUZ12 RIP is relative to its matching IgG control RIP in SGC-7901 and BGC-823 cells. (C) ANRIL nuclear localization, as identified using qRT-PCR in fractionated SGC-7901 and BGC-823 cells. After nuclear and cytosolic separation, RNA expression levels in SGC-7901 and BGC-823 cells were measured by qRT-PCR. GAPDH was used as a cytosol marker and U6 was used as a nucleus marker. *, P < 0.05, **, P < 0.01.
Figure 5
Figure 5. ANRIL is required to target PRC2 occupancy and activity to epigenetically regulate the expression of miR-99a/miR-449a in Trans
(A) qRT-PCR was performed to detect miRNAs expression after ANRIL knockdown. (B) The relative expression level in SGC-7901 and BGC-823 cells, after knockdown EZH2 and SUZ12, was tested by qPCR. (C) The expression of miR-99a/miR-449a in SGC-7901 and BGC-823 cells, after knockdown EZH2 and SUZ12. (D) And (E) ChIP-qPCR of H3K27me3 and EZH2 of the promoter region of miR-99a/miR-449a locus after siRNA treatment targeting si-NC or si-ANRIL in SGC-7901 and BGC-823 cells, Antibody enrichment was quantified relative to the amount of input DNA. Antibody directed against IgG was used as a negative control.
Figure 6
Figure 6. ANRIL could control target genes of miR-99a/miR-449a, thus regulating gastric cancer cell proliferation
(A) The level of miR-99a and miR-449a was downregulated in 30 pairs GC tissues. (B) The level of miR-99a and miR-449a in GC tissues showed a statistically inverse correlation with the relative level of ANRIL expression (N = 30). (C) Western blot assays of p-mTOR/p-S6K/p-S6/p15/p16/cyclinD1/E2F1 after si-ANRIL transfection. (D) Western blot assays of p-mTOR/p-S6K/p-S6/p15/p16/cyclinD1/E2F1 after si-EZH2 transfection. (E) SGC-7901 cells were transfected with miR-99a/miR-449a mimics or miR-NC. MTT and trypan blue assays were performed to determine the cell viability and cell proliferation. Flow cytometry was performed to determine the cell cycle and apoptosis. (F) Western blot assays were performed to detect the protein level after transfection of miR-99a/miR-449a inhibitors and transfected with inhibitors followed by transfection with si-ANRIL.
Figure 7
Figure 7. The released E2F1 activates ANRIL expression
(A) qRT-PCR was performed to detect ANRIL expression after E2F1 overexpression. (B) Enrichment of E2F1 in the ANRIL promoter after E2F1 overexpression. E2F1 was immunoprecipitated and the promoter region containing E2F1-binding sequences were quantified by qRT-PCR. Control IgG immunoprecipitation was used as negative control. (C) qRT-PCR was performed to detect E2F1 expression in 30 pairs GC tissues. (D) After SGC-7901 and BGC-823 cells transfected with miR-NC or miR-449a mimics, qRT-PCR was uesd to detect ANRIL expression.
Figure 8
Figure 8. The impact of ANRIL on tumorigenesis in vivo
(A) And (B) scramble or shANRIL was transfected into SGC-7901 cells, which were injected in the nude mice (n=7), respectively. Tumor volumes were calculated after injection every two days. Bars indicate SD. (C) Tumor weights are represented as means of tumor weights ±SD. qRT-PCR was performed to detect the average expression of ANRIL/miR-99a/miR-449a in xenograft tumors (n=7). (D) The tumor sections were under H&E staining and IHC staining using antibodies against Ki-67. Error bars indicate means ± standard errors of the mean. *, P < 0.05, **, P < 0.01.

References

    1. Herszenyi L, Tulassay Z. Epidemiology of gastrointestinal and liver tumors. Eur Rev Med Pharmacol Sci. 2010;14(4):249–258. - PubMed
    1. Catalano V, Labianca R, Beretta GD, Gatta G, de Braud F, Van Cutsem E. Gastric cancer. Crit Rev Oncol Hematol. 2009;71(2):127–164. - PubMed
    1. Carninci P, Kasukawa T, Katayama S, Gough J, Frith MC, Maeda N, Oyama R, Ravasi T, Lenhard B, Wells C, Kodzius R, Shimokawa K, Bajic VB, Brenner SE, Batalov S, Forrest AR, et al. The transcriptional landscape of the mammalian genome. Science. 2005;309(5740):1559–1563. - PubMed
    1. Amaral PP, Mattick JS. Noncoding RNA in development. Mamm Genome. 2008;19(7-8):454–492. - PubMed
    1. Blackshaw S, Harpavat S, Trimarchi J, Cai L, Huang H, Kuo WP, Weber G, Lee K, Fraioli RE, Cho SH, Yung R, Asch E, Ohno-Machado L, Wong WH, Cepko CL. Genomic analysis of mouse retinal development. PLoS Biol. 2004;2(9):E247. - PMC - PubMed

Publication types

MeSH terms