Review
. 2014 Aug;23(8):999-1012.
doi: 10.1002/pro.2485. Epub 2014 Jun 2.

The DAN family: modulators of TGF-β signaling and beyond

Affiliations
Review

The DAN family: modulators of TGF-β signaling and beyond

Kristof Nolan et al. Protein Sci. 2014 Aug.

Abstract

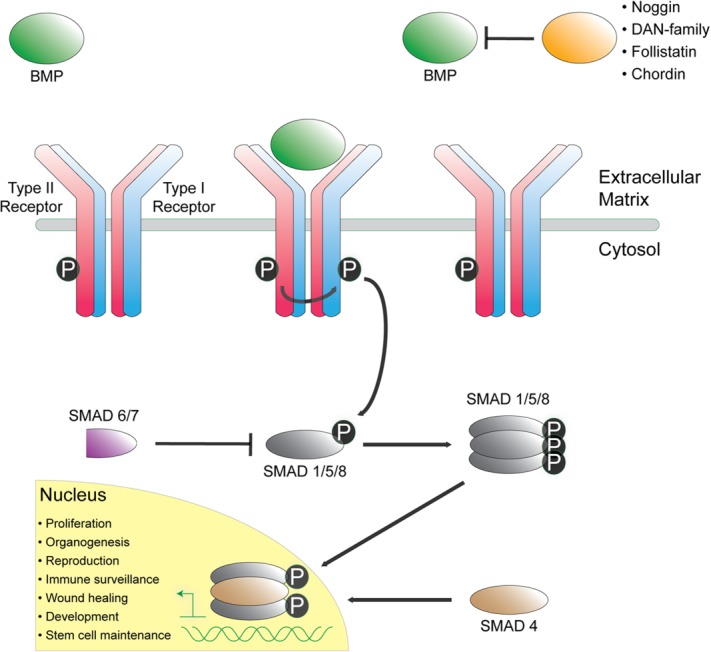
Extracellular binding proteins or antagonists are important factors that modulate ligands in the transforming growth factor (TGF-β) family. While the interplay between antagonists and ligands are essential for developmental and normal cellular processes, their imbalance can lead to the pathology of several disease states. In particular, recent studies have implicated members of the differential screening-selected gene in neuroblastoma (DAN) family in disease such as renal fibrosis, pulmonary arterial hypertension, and reactivation of metastatic cancer stem cells. DAN family members are known to inhibit the bone morphogenetic proteins (BMP) of the TGF-β family. However, unlike other TGF-β antagonist families, DAN family members have roles beyond ligand inhibition and can modulate Wnt and vascular endothelial growth factor (VEGF) signaling pathways. This review describes recent structural and functional advances that have expanded our understanding of DAN family proteins with regards to BMP inhibition and also highlights their emerging roles in the modulation of Wnt and VEGF signaling pathways.

Keywords: BMP; Keywords DAN; TGF-β; VEGF; Wnt; extracellular antagonists.


Figures

Figure 1
Figure 1
Overview of BMP/ TGF-β signaling. Secreted ligands (green) signal by binding and activating two of each Type I (blue) and Type II (red) receptors. Upon binding, the Type I receptor is phosphorylated by the Type II receptor, leading to Type I kinase domain activation and subsequent phosphorylation of intracellular SMAD transcription factors (gray). Activated SMAD molecules oligomerize and accumulate in the nucleus to combine with coactivators and corepressors to regulate gene expression. Several structurally diverse extracellular antagonists (orange) bind and sequester ligands to inhibit and block ligand–receptor interaction and activation.
Figure 2
Figure 2
Structure of TGF-β ligands and their associated complexes. A: Representative structure of a TGF-β ligand monomer (Myostatin from PDB 3HH2). Intramolecular disulfide bonds are shown as sticks. Labels indicate various β-stands in the ligand as well as identify the finger-wrist-finger architecture of the ligands. B: Structure of the mature TGF-β ligand homodimer (PDB 3HH2) with one monomer colored in light green and another in gray. The monomers are linked via an intermolecular disulfide bond. This architecture exposes extended convex and concave surfaces on the protein, which have a strong hydrophobic character and define the ability of the protein to interact with its cognate receptors. C: Structure of TGF-β ligands bound to their Type I and Type II receptors (PDB 2PJY). The ligand is represented in ribbon (green, gray) with the receptors represented in both surface and ribbon representation (pink, blue). The receptors for the TGF-β subclass (top) come into contact during binding since the Type I receptors binds more towards the fingertips of the ligand while those for the BMP subclass (bottom) do not, where the Type I receptor binds more significantly to the exposed convex epitope of BMP ligands (PDB 2GOO). D: Representative structures of various BMP-antagonist complexes. Ligands are indicated by ribbon diagrams (green, gray), while antagonists are shown as rainbow colored ribbons (one half) and orange surface representations. (left) FS-Myostatin complex (PDB 3HH2). Labels indicate various domains of FS. (middle) Noggin-BMP7 complex (PDB 1M4U). (right) CV2-BMP2 complex (PDB 3BK3). A single VWC domain was solved in complex from the larger multidomain CV2 protein.
Figure 3
Figure 3
DAN-family of protein antagonists. A: Phylogenetic tree based upon amino acid conservation across the family. The family can be separated into three groups based upon extended amino acid and cysteine conservation. Different colors (red, yellow, blue) indicate the different subgroups. Numbers indicate the number of cysteines within each group of proteins. B: Overall DAN family architecture. Different colors represent the different regions found in DAN-family proteins. SS is the signal sequence (gray), NT is the N-terminus (brown), DAN/CRD is the functional DAN-domain or cystine-rich domain (green), and CT is the C-terminus (yellow). Orange circles represent the conserved eight cysteines in all family members that help define conservation within the family as well as their core cystine-knot and fold. Purple boxes indicate the location of variable cysteines. Numbers below the diagram represent the range of amino acids found in these varying regions across the family. For example, in the NT, DAN only contains 18 amino acids while Cerberus has 144. These numbers help to show that the family maintains the majority of its conservation within the DAN domain while exhibiting a large amount of variability outside of this domain. C: Amino acid sequence identity table. Identity of only the DAN domain is in parentheses. Numbers in bold represent the highest scores across the family, occurring between (1) PRDC and Gremlin and (2) SOST and USAG-1.
Figure 4
Figure 4
Structures of DAN-family antagonists. A: NMR Structure of SOST (PDB 2K8P) represented in ribbon diagram (pink). Disulfide bonds are shown as sticks and the finger-wrist-finger architecture of the proteins are labeled, showing each finger and the wrist region. B: (top) Crystal structure of one PRDC monomer (PDB 4JPH) represented in ribbon (green). (bottom) Overlay of the SOST and PRDC monomer structures. The N-terminal helix of PRDC is faded to ease comparison of the core DAN domains. As can be seen, there is substantially more secondary structural content, in the form of β-strands, in the wrist region of PRDC as compared to SOST. These β-strands in PRDC help form the dimer interface of the protein. C: (top) Structure of the PRDC dimer. The opposing monomer chains are shown in different colors (green, gray) with labels indicating the β-strands involved in dimerization and dashed lines showing hydrogen bonds. (bottom) Zoomed in view of the cystine-knot of PRDC near its free, unbound, cysteine. Disulfide bonds that form the cystine-knot are colored yellow and circled. The 9th or unpaired cysteines of PRDC are colored pink. D: (top) Crystal structure of the Norrin dimer (PDB 4MY2). The opposing monomer chains are shown in different colors (blue, gray) with labels indicating the finger-wrist-finger architecture and the β-strands and hydrogen bonds important for stabilizing the dimer fold. (bottom) Zoomed in view of the cystine-knot of Norrin near its intermolecular disulfide bonds. The cystine-knot is annotated as above. Norrin forms three intermolecular disulfide bonds; two that are adjacent to the CK and in similar locations to the free cysteine in PRDC (pink) and one in the C-terminus (teal).
Figure 5
Figure 5
DAN-family protein multiple sequence alignment. Members of the DAN-family were aligned using ClustalW. Numbers on the right of the alignment indicated the amino acid number at that position for the corresponding protein (with amino acid 1 being the first translated from the signal sequence). Brackets above the alignment dictate various regions in the proteins, blue being the N-terminus, green being Finger 1, orange being the Wrist, red being Finger 2, and purple being the C-terminus. The black cylinders (helices) and arrows (β-strands) represent secondary structure content based upon the crystal structure of PRDC. Yellow filled boxes show the 8 conserved cysteines throughout the family while those in orange filled boxes are additional cysteines dictated for specific family members. Solid black lines between cysteines indicated disulfide bonds forming the cystine-knot in the DAN-domain while a dotted line represents the disulfide bond linking Finger 1 to Finger 2. Purple filled boxes represent those amino acids identified in PRDC to be important for BMP binding while those in purple outlined boxes are seemingly conserved for certain family members. Blue-filled boxes represent amino acids identified for SOST to be important for heparin binding while those in blue outlined boxes represent those amino acids that are conserved across the remaining DAN-family. The bold green text in the sequence of SOST represents the linear motif identified to be important for binding to the Wnt coreceptors LRP5 and LRP6.,
Figure 6
Figure 6
DAN-family electrostatic surface potentials. Surface potentials for several different DAN-family members are shown using top, side, and bottom views. Potentials were calculated using APBS and are colored on a scale of −6 to 6 kbT/ec (red to white to blue). Red indicates a negative surface potential while blue represents a positive surface potential. PRDC surface representation is based upon the crystal structure of the dimer. Coco, Cerberus, and Nbl1 were modeled using SwisProt2.0 using PRDC (PDB 4JPH) as an input structure., These members are plotted as dimers, where Nbl1 is known to exist as a dimer and speculated for Coco and Cerberus. SOST surface potential is based upon the NMR solution of the protein (PDB 2K8P) and is shown as a monomer. Beneath the protein surfaces are numbers indicating the pI (black) of each DAN-family protein, the number of positive residues (blue; lysines and arginines), and the number of negative residues (red; glutamates and aspartates) per monomer of each full-length antagonist.
Figure 7
Figure 7
VEGF binding to the VEGFR2 receptor and comparison to PRDC. (top left) Structure of the VEGF-C dimer shown in ribbon representation with one monomer colored green and the opposing colored gray (PDB 2X1X). (bottom left) Structure of the PRDC dimer shown in ribbon representation with one monomer colored green and the opposing colored gray. For both PRDC and VEGF-C, sticks are shown to represent disulfide bonds. Numbers and lines indicate the length of the proteins from one end to the other. Regions highlighted in red indicated the wrist regions of these proteins. (right) The second and third extracellular domains of VEGFR2 are shown in ribbon and surface representation, colored light and dark blue, respectively. The dotted lines indicate that a substantial portion of the protein is not included in this model (extracellular domains 4–7). For VEGF-C, the wrist region (shown in red) folds out of the when binding to VEGFR2 and is important for mediating the interaction and affinity with this receptor. Number represents the approximate distance between opposing VEGFR2 receptors.

References

    1. Hogan BL. Bone morphogenetic proteins in development. Curr Opin Genet Dev. 1996;6:432–438. - PubMed
    1. Bragdon B, Moseychuk O, Saldanha S, King D, Julian J, Nohe A. Bone morphogenetic proteins: a critical review. Cell Signal. 2011;23:609–620. - PubMed
    1. Rider CCC, Mulloy BB. Bone morphogenetic protein and growth differentiation factor cytokine families and their protein antagonists. Biochem J. 2010;429:1–12. - PubMed
    1. Walsh DW, Godson C, Brazil DP, Martin F. Extracellular BMP-antagonist regulation in development and disease: tied up in knots. Trends Cell Biol. 2010;20:244–256. - PubMed
    1. Gao H, Chakraborty G, Lee-Lim AP, Mo Q, Decker M, Vonica A, Shen R, Brogi E, Brivanlou AH, Giancotti FG. The BMP inhibitor Coco reactivates breast cancer cells at lung metastatic sites. Cell. 2012;150:764–779. - PMC - PubMed

MeSH terms

LinkOut - more resources