

U-251 revisited: genetic drift and phenotypic consequences of long-term cultures of glioblastoma cells
- PMID: 24810477
- PMCID: PMC4303149
- DOI: 10.1002/cam4.219
U-251 revisited: genetic drift and phenotypic consequences of long-term cultures of glioblastoma cells
Abstract
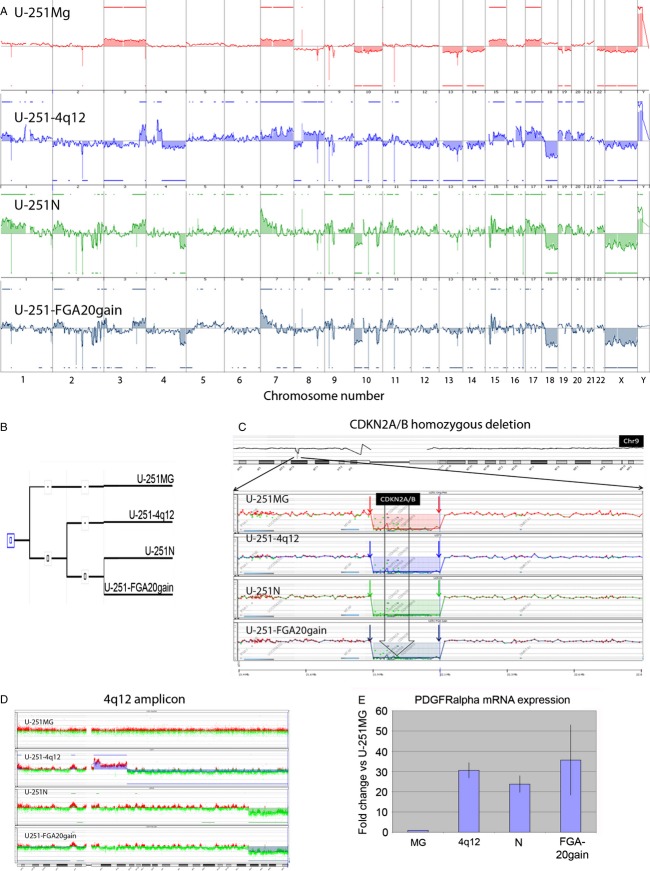
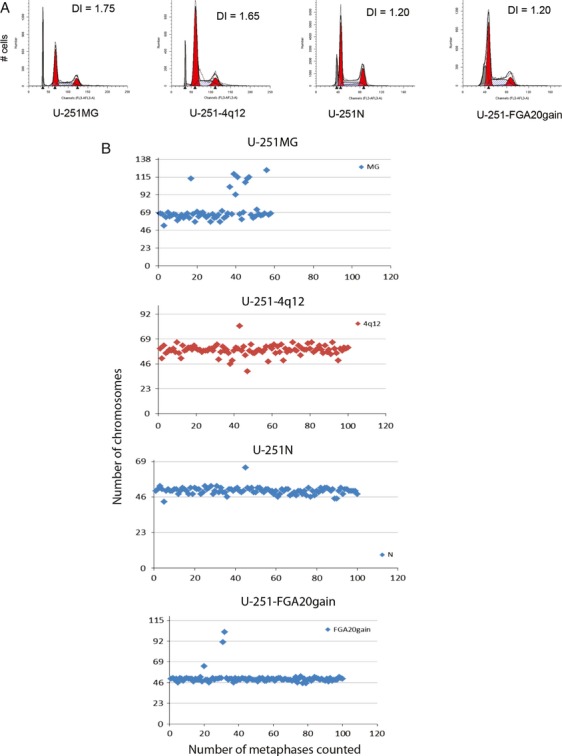
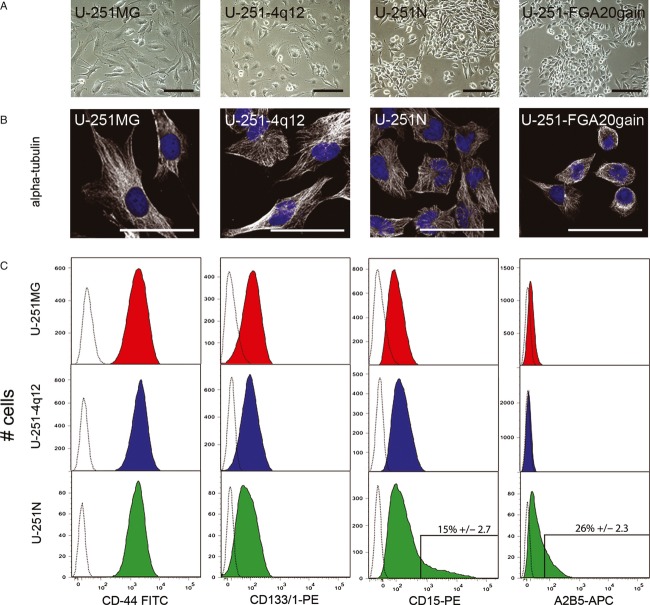
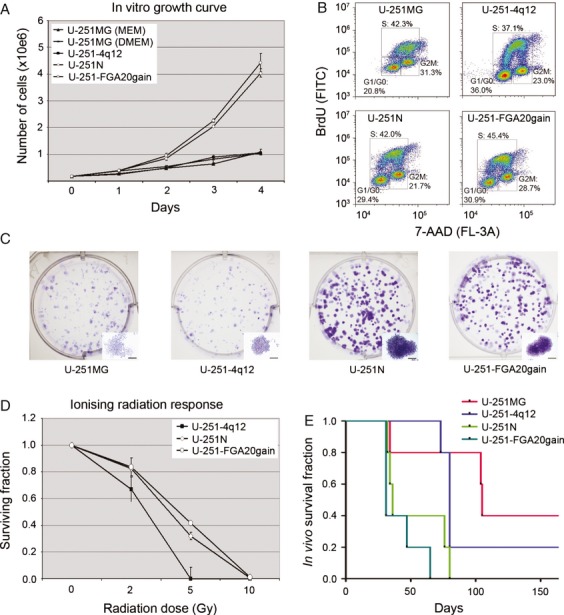
It is well known that in vitro subculture represents a selection pressure on cell lines, and over time this may result in a genetic drift in the cancer cells. In addition, long-term cultures harbor the risk of cross-contamination with other cell lines. The consequences may have major impact on experimental results obtained in various laboratories, where the cell lines no longer reflect the original tumors that they are supposed to represent. Much neglected in the scientific community is a close monitoring of cell cultures by regular phenotypic and genetic characterization. In this report, we present a thorough characterization of the commonly used glioblastoma (GBM) model U-251, which in numerous publications has been wrongly identified as U-373, due to an earlier cross-contamination. In this work, the original U-251 and three subclones of U-251, commonly referred to as U-251 or U-373, were analyzed with regard to their DNA profile, morphology, phenotypic expression, and growth pattern. By array comparative genomic hybridization (aCGH), we show that only the original low-passaged U-251 cells, established in the 1960s, maintain a DNA copy number resembling a typical GBM profile, whereas all long-term subclones lost the typical GBM profile. Also the long-term passaged subclones displayed variations in phenotypic marker expression and showed an increased growth rate in vitro and a more aggressive growth in vivo. Taken together, the variations in genotype and phenotype as well as differences in growth characteristics may explain different results reported in various laboratories related to the U-251 cell line.
Keywords: GBM; STR; U251; U373; aCGH; cell lines; cross-contamination; in vitro models.
© 2014 The Authors. Cancer Medicine published by John Wiley & Sons Ltd.
Figures
References
-
- Ponten J. Westermark B. Properties of human malignant glioma cells in vitro. Med. Biol. 1978;56:184–193. - PubMed
-
- Westermark B, Ponten J. Hugosson R. Determinants for the establishment of permanent tissue culture lines from human gliomas. Acta Pathol. Microbiol. Scand. A. 1973;81:791–805. - PubMed
-
- Ponten J. Macintyre EH. Long term culture of normal and neoplastic human glia. Acta Pathol. Microbiol. Scand. 1968;74:465–486. - PubMed
-
- Nister M, Libermann TA, Betsholtz C, Pettersson M, Claesson-Welsh L, Heldin CH, et al. Expression of messenger RNAs for platelet-derived growth factor and transforming growth factor-alpha and their receptors in human malignant glioma cell lines. Cancer Res. 1988;48:3910–3918. - PubMed
Publication types
MeSH terms
LinkOut - more resources
Full Text Sources
Other Literature Sources
Research Materials
