

Identification and expression of troponin T, a new marker on the surface of cultured tumor endothelial cells by aptamer ligand
- PMID: 24810801
- PMCID: PMC4303150
- DOI: 10.1002/cam4.260
Identification and expression of troponin T, a new marker on the surface of cultured tumor endothelial cells by aptamer ligand
Abstract
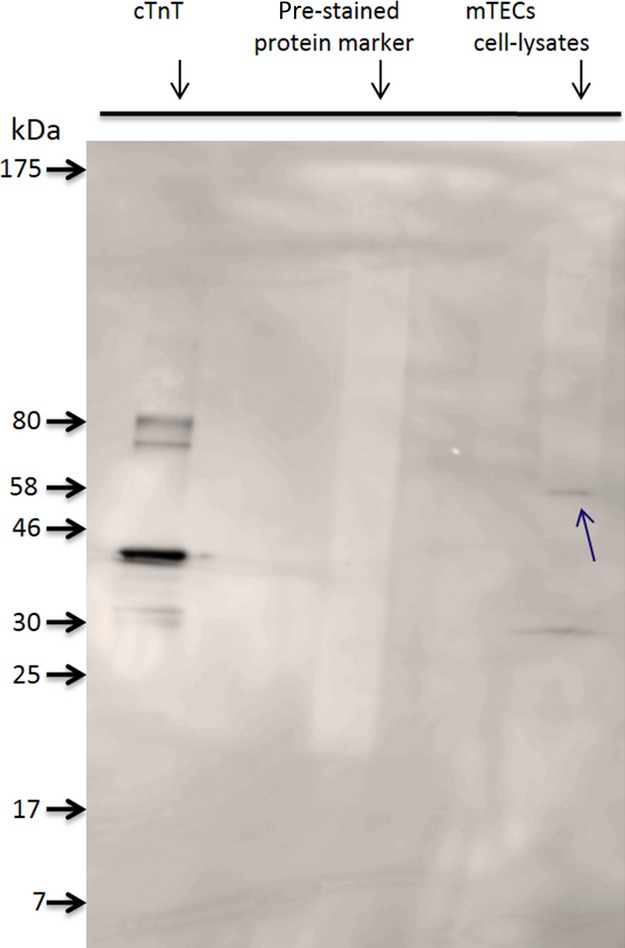
The identification of a specific biomarker involves the development of new clinical diagnostic tools, and an in-depth understanding of the disease at the molecular level. When new blood vessels form in tumor cells, endothelial cell production is induced, a process that plays a key role in disease progression and metastasis to distinct organs for solid tumor types. The present study reports on the identification of a new biomarker on primary cultured mouse tumor endothelial cells (mTECs) using our recently developed high-affinity DNA aptamer AraHH001 (Kd = 43 nmol/L) assisted proteomics approach. We applied a strategy involving aptamer-facilitated biomarker discovery. Biotin-tagged AraHH001 was incubated with lysates of mTECs and the aptamer-proteins were then conjugated with streptavidin magnetic beads. Finally, the bound proteins were separated by sodiumdodecyl sulfate polyacrylamide gel electrophoresis (SDS-PAGE) with silver staining. We identified troponin T via matrix assisted laser desorption ionization-time of flight (MALDI-TOF) mass spectrometry, the molecular target of aptamer AraHH001, and its presence was confirmed by measuring mRNA, protein levels, western blot, immunostaining, a gel shift assay of AraHH001 with troponin T. We first report here on the discovery of troponin T on mTECs, a promising and interesting diagnostic tool in the development of antiangiogenic therapy techniques the involves the targeting of the tumor vasculature.
Keywords: Biomarker; DNA aptamer; MALDI-TOF-mass spectroscopy; mTECs; troponin T.
© 2014 The Authors. Cancer Medicine published by John Wiley & Sons Ltd.
Figures


References
-
- Ozier O, Amin N. Ideker T. Global architecture of genetic interactions on the protein network. Nat. Biotechnol. 2003;21:490–491. - PubMed
-
- Wu CC. Yates JR. The application of mass spectrometry to membrane proteomics. Nat. Biotechnol. 2003;21:262–267. - PubMed
-
- Rifai N, Gillette MA. Carr SA. Protein biomarker discovery and validation: the long and uncertain path to clinical utility. Nat. Biotechnol. 2006;2:971–983. - PubMed
-
- Srinivas PR, Kramer BS. Srivastava S. Trends in biomarker search for cancer detection. Lancet Oncol. 2001;2:698–704. - PubMed
-
- Folkman J. Tumor angiogenesis, therapeutic implications. New Engl. J. Med. 1971;285:1182–1186. - PubMed
Publication types
MeSH terms
Substances
LinkOut - more resources
Full Text Sources
Other Literature Sources
