

Epigenetic silencing of EYA2 in pancreatic adenocarcinomas promotes tumor growth
- PMID: 24810906
- PMCID: PMC4058028
- DOI: 10.18632/oncotarget.1842
Epigenetic silencing of EYA2 in pancreatic adenocarcinomas promotes tumor growth
Abstract
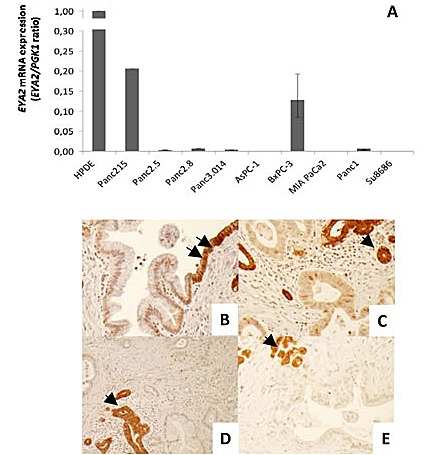
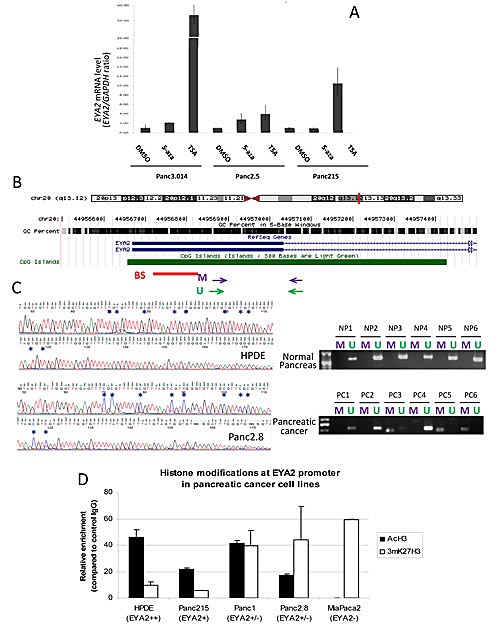
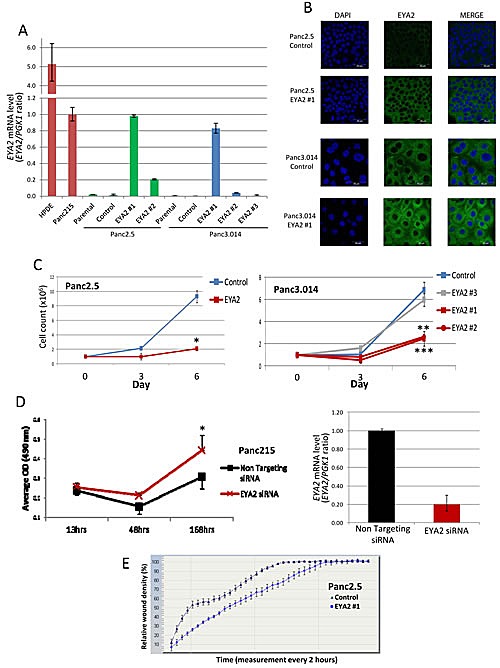
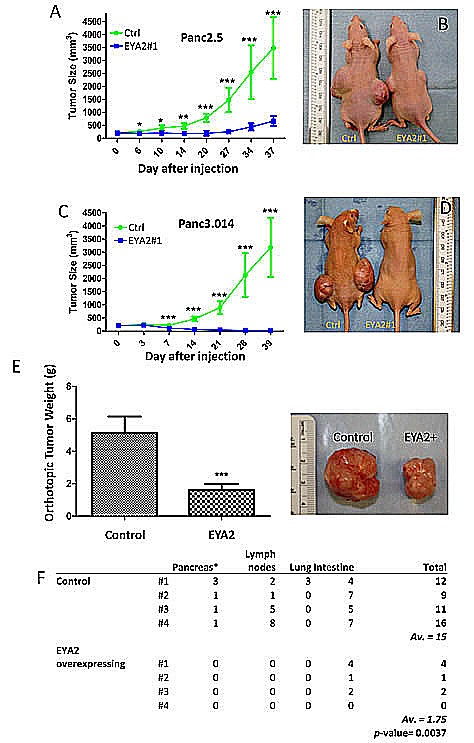
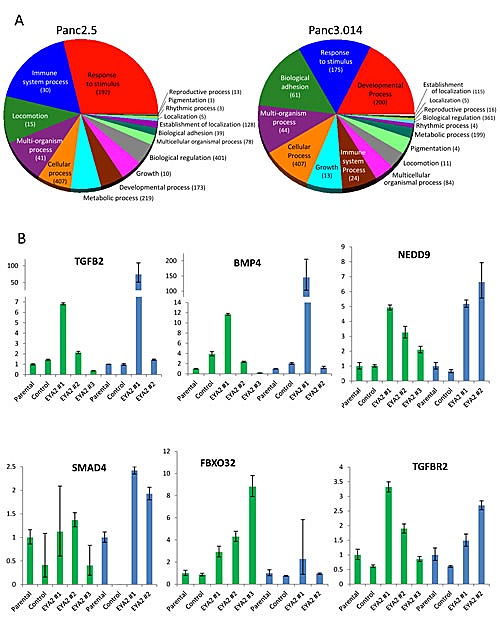
To identify potentially important genes dysregulated in pancreatic cancer, we analyzed genome-wide transcriptional analysis of pancreatic cancers and normal pancreatic duct samples and identified the transcriptional coactivator, EYA2 (Drosophila Eyes Absent Homologue-2) as silenced in the majority of pancreatic cancers. We investigated the role of epigenetic mechanisms of EYA2 gene silencing in pancreatic cancers, performed in vitro and in vivo proliferation and migration assays to assess the effect of EYA2 silencing on tumor cell growth and metastasis formation, and expression analysis to identify genes transcriptionally regulated by EYA2. We found loss of tumoral Eya2 expression in 63% of pancreatic cancers (120/189 cases). Silencing of EYA2 expression in pancreatic cancer cell lines correlated with promoter methylation and histone deacetylation and was reversible with DNA methyltransferase and HDAC inhibitors. EYA2 knockdown in pancreatic cancer cell lines increased cell proliferation. Compared to parental pancreatic cancer cells, pancreatic cancers stably-expressing EYA2 grew more slowly and had fewer metastases in orthotopic models. The transcriptional changes after stable expression of EYA2 in pancreatic cancer cells included induction of genes in the TGFbeta pathway. Epigenetic silencing of EYA2 is a common event in pancreatic cancers and stable expression EYA2 limits the growth and metastases of pancreatic adenocarcinoma.
Figures
Similar articles
-
The SIX1-EYA transcriptional complex as a therapeutic target in cancer.Expert Opin Ther Targets. 2015 Feb;19(2):213-25. doi: 10.1517/14728222.2014.978860. Epub 2015 Jan 2. Expert Opin Ther Targets. 2015. PMID: 25555392 Free PMC article. Review.
-
Aberrant hypomethylation and overexpression of the eyes absent homologue 2 suppresses tumor cell growth of human lung adenocarcinoma cells.Oncol Rep. 2015 Nov;34(5):2333-42. doi: 10.3892/or.2015.4245. Epub 2015 Sep 2. Oncol Rep. 2015. PMID: 26329363
-
Silencing pancreatic adenocarcinoma upregulated factor (PAUF) increases the sensitivity of pancreatic cancer cells to gemcitabine.Tumour Biol. 2016 Jun;37(6):7555-64. doi: 10.1007/s13277-015-4641-2. Epub 2015 Dec 18. Tumour Biol. 2016. PMID: 26684804
-
Overexpression of PD2 leads to increased tumorigenicity and metastasis in pancreatic ductal adenocarcinoma.Oncotarget. 2016 Jan 19;7(3):3317-31. doi: 10.18632/oncotarget.6580. Oncotarget. 2016. PMID: 26689992 Free PMC article.
-
Epigenetic regulation of protein tyrosine phosphatases: potential molecular targets for cancer therapy.Cancer Gene Ther. 2005 Aug;12(8):665-72. doi: 10.1038/sj.cgt.7700828. Cancer Gene Ther. 2005. PMID: 15803146 Free PMC article. Review.
Cited by
-
The SIX1-EYA transcriptional complex as a therapeutic target in cancer.Expert Opin Ther Targets. 2015 Feb;19(2):213-25. doi: 10.1517/14728222.2014.978860. Epub 2015 Jan 2. Expert Opin Ther Targets. 2015. PMID: 25555392 Free PMC article. Review.
-
The retinal determination gene network: from developmental regulator to cancer therapeutic target.Oncotarget. 2016 Aug 2;7(31):50755-50765. doi: 10.18632/oncotarget.9394. Oncotarget. 2016. PMID: 27203207 Free PMC article. Review.
-
Eya3 promotes breast tumor-associated immune suppression via threonine phosphatase-mediated PD-L1 upregulation.J Clin Invest. 2018 Jun 1;128(6):2535-2550. doi: 10.1172/JCI96784. Epub 2018 May 14. J Clin Invest. 2018. PMID: 29757193 Free PMC article.
-
EYA1 expression and subcellular localization in neuroblastoma and its association with prognostic markers.J Cancer Res Ther (Manch). 2016 Jun;4(2):11-18. doi: 10.14312/2052-4994.2016-3. Epub 2016 May 5. J Cancer Res Ther (Manch). 2016. PMID: 28713571 Free PMC article.
-
Pancreatic cancer: optimizing treatment options, new, and emerging targeted therapies.Drug Des Devel Ther. 2015 Jul 7;9:3529-45. doi: 10.2147/DDDT.S60328. eCollection 2015. Drug Des Devel Ther. 2015. PMID: 26185420 Free PMC article. Review.
References
-
- Jones S, Zhang X, Parsons DW, Lin JC, Leary RJ, Angenendt P, Mankoo P, Carter H, Kamiyama H, Jimeno A, Hong SM, Fu B, Lin MT, Calhoun ES, Kamiyama M, Walter K, et al. Core signaling pathways in human pancreatic cancers revealed by global genomic analyses. Science. 2008;321(5897):1801–1806. Epub 2008 Sep 1804. - PMC - PubMed
-
- Biankin AV, Waddell N, Kassahn KS, Gingras MC, Muthuswamy LB, Johns AL, Miller DK, Wilson PJ, Patch AM, Wu J, Chang DK, Cowley MJ, Gardiner BB, Song S, Harliwong I, Idrisoglu S, et al. Pancreatic cancer genomes reveal aberrations in axon guidance pathway genes. Nature. 2012;491(7424):399–405. - PMC - PubMed
Publication types
MeSH terms
Substances
Grants and funding
LinkOut - more resources
Full Text Sources
Other Literature Sources
Medical
Molecular Biology Databases
Research Materials
