

Protein-protein interactions in dilute to concentrated solutions: α-chymotrypsinogen in acidic conditions
- PMID: 24810917
- PMCID: PMC4051245
- DOI: 10.1021/jp412301h
Protein-protein interactions in dilute to concentrated solutions: α-chymotrypsinogen in acidic conditions
Abstract
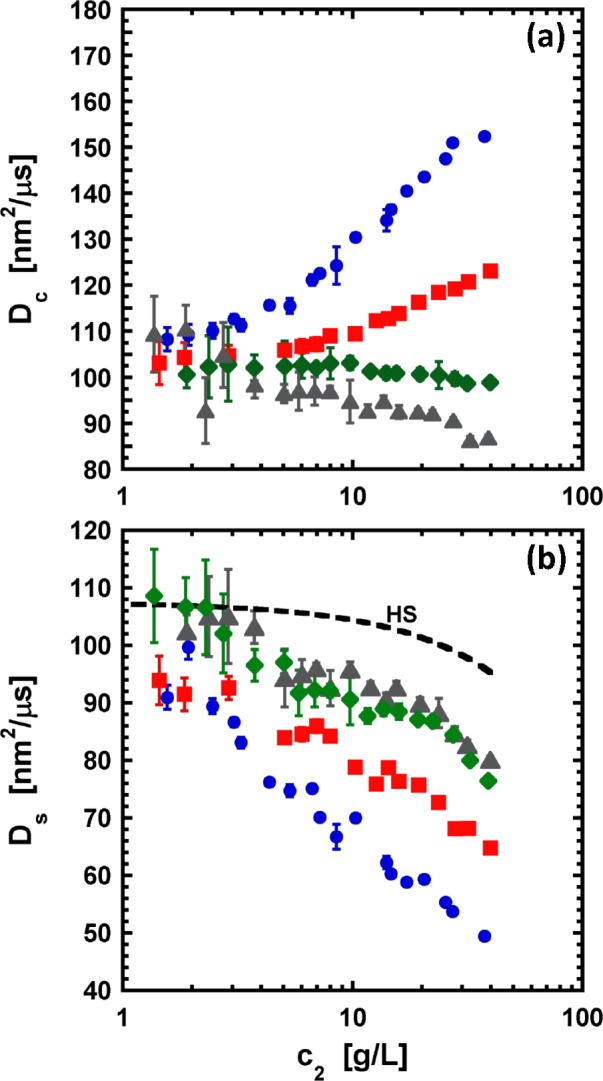
Protein-protein interactions were investigated for α-chymotrypsinogen by static and dynamic light scattering (SLS and DLS, respectively), as well as small-angle neutron scattering (SANS), as a function of protein and salt concentration at acidic conditions. Net protein-protein interactions were probed via the Kirkwood-Buff integral G22 and the static structure factor S(q) from SLS and SANS data. G22 was obtained by regressing the Rayleigh ratio versus protein concentration with a local Taylor series approach, which does not require one to assume the underlying form or nature of intermolecular interactions. In addition, G22 and S(q) were further analyzed by traditional methods involving fits to effective interaction potentials. Although the fitted model parameters were not always physically realistic, the numerical values for G22 and S(q → 0) were in good agreement from SLS and SANS as a function of protein concentration. In the dilute regime, fitted G22 values agreed with those obtained via the osmotic second virial coefficient B22 and showed that electrostatic interactions are the dominant contribution for colloidal interactions in α-chymotrypsinogen solutions. However, as protein concentration increases, the strength of protein-protein interactions decreases, with a more pronounced decrease at low salt concentrations. The results are consistent with an effective "crowding" or excluded volume contribution to G22 due to the long-ranged electrostatic repulsions that are prominent even at the moderate range of protein concentrations used here (<40 g/L). These apparent crowding effects were confirmed and quantified by assessing the hydrodynamic factor H(q → 0), which is obtained by combining measurements of the collective diffusion coefficient from DLS data with measurements of S(q → 0). H(q → 0) was significantly less than that for a corresponding hard-sphere system and showed that hydrodynamic nonidealities can lead to qualitatively incorrect conclusions regarding B22, G22, and static protein-protein interactions if one uses only DLS to assess protein interactions.
Figures


References
-
- Gavin A. C.; Bosche M.; Krause R.; Grandi P.; Marzioch M.; Bauer A.; Schultz J.; Rick J. M.; Michon A. M.; Cruciat C. M.; et al. Functional Organization of the Yeast Proteome by Systematic Analysis of Protein Complexes. Nature 2002, 415, 141–147. - PubMed
-
- Williams D. H.; Stephens E.; O’Brien D. P.; Zhou M. Understanding Noncovalent Interactions: Ligand Binding Energy and Catalytic Efficiency from Ligand-Induced Reductions in Motion within Receptors and Enzymes. Angew. Chem. 2004, 43, 6596–6616. - PubMed
-
- Pawson T. Specificity in Signal Transduction: From Phosphotyrosine–SH2 Domain Interactions to Complex Cellular Systems. Cell 2004, 116, 191–203. - PubMed
-
- Carroll M. C. The Complement System in Regulation of Adaptive Immunity. Nat. Immunol. 2004, 5, 981–986. - PubMed
-
- Wang W. Protein Aggregation and Its Inhibition in Biopharmaceutics. Int. J. Pharm. 2005, 289, 1–30. - PubMed
Publication types
MeSH terms
Substances
Grants and funding
LinkOut - more resources
Full Text Sources
Other Literature Sources
