. 2014 May 15;5(9):2436-49.
doi: 10.18632/oncotarget.1610.

WT1 regulates angiogenesis in Ewing Sarcoma

Affiliations

WT1 regulates angiogenesis in Ewing Sarcoma

Varalakshmi Katuri et al. Oncotarget. .

Abstract

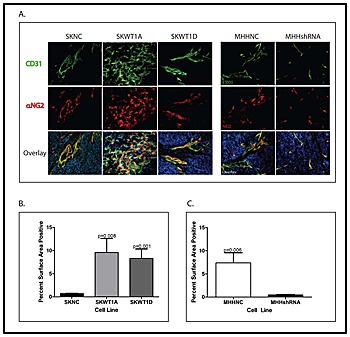
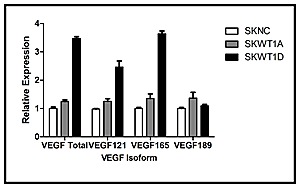
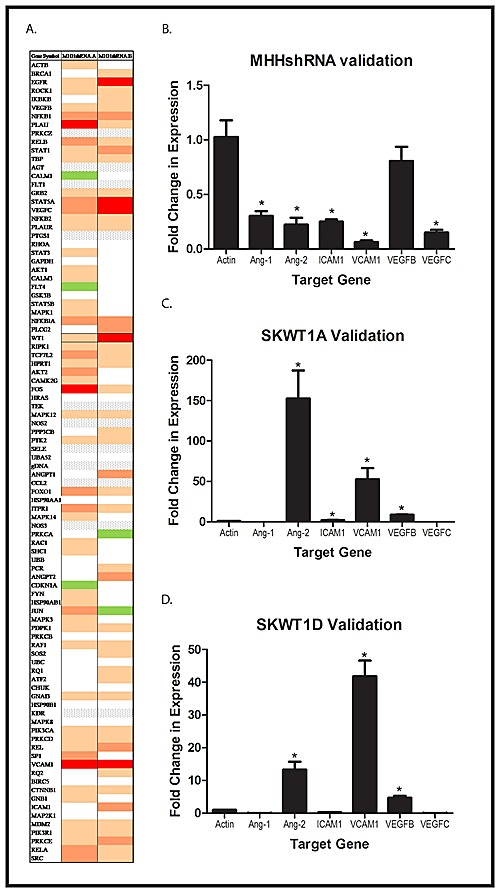
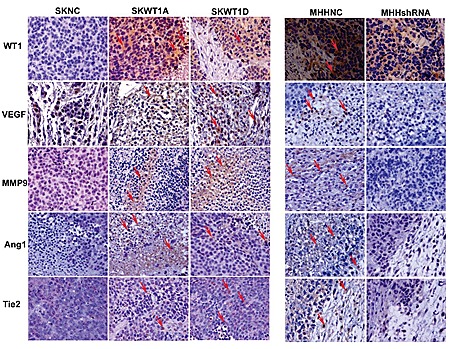
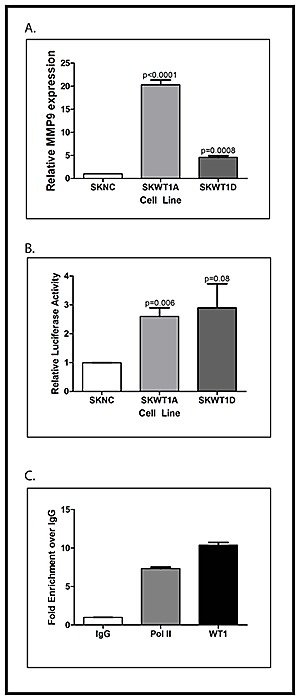
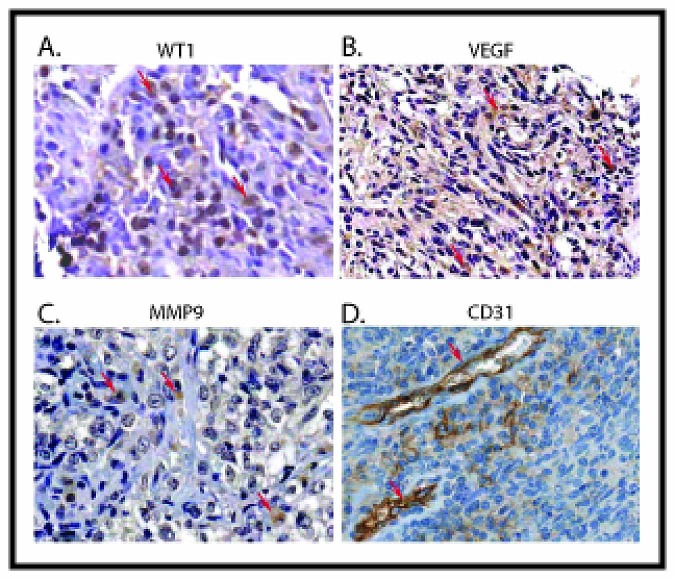
Angiogenesis is required for tumor growth. WT1, a protein that affects both mRNA transcription and splicing, has recently been shown to regulate expression of vascular endothelial growth factor (VEGF), one of the major mediators of angiogenesis. In the present study, we tested the hypothesis that WT1 is a key regulator of tumor angiogenesis in Ewing sarcoma. We expressed exogenous WT1 in the WT1-null Ewing sarcoma cell line, SK-ES-1, and we suppressed WT1 expression using shRNA in the WT1-positive Ewing sarcoma cell line, MHH-ES. Suppression of WT1 in MHH-ES cells impairs angiogenesis, while expression of WT1 in SK-ES-1 cells causes increased angiogenesis. Different WT1 isoforms result in vessels with distinct morphologies, and this correlates with preferential upregulation of particular VEGF isoforms. WT1-expressing tumors show increased expression of pro-angiogenic molecules such as VEGF, MMP9, Ang-1, and Tie-2, supporting the hypothesis that WT1 is a global regulator of angiogenesis. We also demonstrate that WT1 regulates the expression of a panel of pro-angiogenic molecules in Ewing sarcoma cell lines. Finally, we found that WT1 expression is correlated with VEGF expression, MMP9 expression, and microvessel density in samples of primary Ewing sarcoma. Thus, our results demonstrate that WT1 expression directly regulates tumor angiogenesis by controlling the expression of a panel of pro-angiogenic genes.


Figures

Figure 1
Figure 1. Creation of stably transfected cell lines A: RNA was isolated from SK-ES-1 cells transfected with an empty expression vector (Lane 1) or vectors directing expression of WT1A (Lane 2) or WT1D (Lane 3)
The WT1-expressing cell line MHH-ES was used as a positive control (Lane 4). RNA was analyzed by RT-PCR for expression of WT1 using primers that span exon 5. The ribosomal RNA 36B4 was used as a loading control. B: Total protein was isolated from SKNC, SKWT1A and SKWT1D cell lines, as well as from MHH-ES cells, and Western blotting was performed with an antibody against WT1 (top panel) or GAPDH as a loading control (bottom panel). Lane 1: MHH-ES; Lane 2: SKNC; Lane 3: SKWT1A; Lane 4: SKWT1D. C: The WT1-expressing Ewing sarcoma cell line MHH-ES was transfected with either a WT1-specific shRNA or a scrambled control. RNA was isolated from the indicated cell lines and relative expression of WT1 mRNA was determined by quantitative RT-PCR. The signal obtained from the MHHNC cell line was arbitrarily assigned a value of 1.0, and signals were compared to this using the ΔΔCt method. Inset: Total protein was isolated from MHHNC (Lane 1) and MHHshRNA (Lane 2) cells, and western blotting was performed with an antibody against either WT1 (top panel) or GAPDH (lower panel) as a loading control.
Figure 2
Figure 2. Effect of WT1 on tumor angiogenesis
A: Mice xenografted with the indicated cell line were perfused with 4% paraformaldehyde, the tumors fixed, and paraffin-embedded slices stained with antibody against CD31 (green) and α-NG2 (red). Nuclei are counterstained with DAPI (blue). B: Total CD31 staining was quantified in SKNC, SKWT1A and SKWT1D xenografts from 10 fields from each group (10x objective), by position pixel algorithm using ImageJ software (NIH). Significance of the differences in CD31 staining were determined using Student's t test, and the p values are indicated. C: Total CD31 staining was quantified in MHHNC and MHHshRNA xenografts from 10 fields from each group (10x objective), by position pixel algorithm using ImageJ software (NIH). Differences in CD31 staining were evaluated using Student's t test, and the p values are indicated. All images are 200x.
Figure 3
Figure 3. Effect of WT1 on VEGF isoform expression
Total RNA was isolated from the indicated cell lines and analyzed for VEGF isoform expression using TaqMan RT-PCR. The signal obtained from the SKNC cell line was arbitrarily assigned a value of 1.0, and signals were compared to this using the ΔΔCt method. Bars indicate relative mRNA expression and error bars are the standard error of the mean of triplicate samples. This experiment was performed 3 times with similar results.
Figure 4
Figure 4. Global Effect of WT1 on Angiogenic Molecules
A: Total RNA was isolated from 2 independently derived MHH-ES cell lines expressing a WT1 shRNA and from a MHH-ES cell line transfected with a scramble control. RNA was reverse transcribed, and the resulting cDNA analyzed using an angiogenesis PCR array as described. A heatmap of the results is presented. Red rectangles represent genes decreased by >75%, and varying shades of tan/orange represent less profound decreases. White indicates no difference, grey indicates no expression, and green represents > 1.3x increased expression. An independent RNA prep from (A) MHH shRNA and MHHNC, (B) SKWT1A and SKNC, and (C) SKWT1D and SKNC cells was reverse transcribed, and expression of each of the indicated target genes was assessed by qRT-PCR. Student's t test was used to assess differences for statistical significance, and the * indicates a p value < 0.05
Figure 5
Figure 5. WT1 enhances expression of pro-angiogenic molecules
Immunohistochemical analysis of tumors derived from the indicated xenografts. Serial sections of formalin- fixed, paraffin-embedded tumors were stained with the following antibodies: a mouse monoclonal WT1, a rabbit polyclonal VEGF, a rabbit polyclonal MMP9, a goat polyclonal Ang-1, and a goat monoclonal Tie-2. Signals were developed with DAB chromogen (brown) and counterstained with hematoxylin. Positive staining is shown with arrows. All images are 200x.
Figure 6
Figure 6. WT1 directly regulates MMP9
A. RNA was isolated from the indicated cell lines and relative expression of WT1 mRNA was determined by quantitative RT-PCR. The signal obtained from the SKNC cell line was arbitrarily assigned a value of 1.0, and signals were compared to this using the ΔΔCt method. Error bars represent standard error of the mean of experiments done in triplicate. Statistical significance was determined using Student's t test, with the indicated p values obtained. B: NIH3T3 cells were transfected with the MMP9 promoter-luciferase reporter construct and either the empty pCB6 expression vector or pCB6 containing the cDNA for the indicated WT1 isoform. Fold change is shown on Y-axis. Error bars represent standard error of the mean of experiments done in triplicate. Statistical significance was determined using Student's t test, with the indicated p values obtained. All experiments were repeated a minimum of three times. C: Chromatin from MHH-ES cells was immunoprecipitated with nonspecific IgG, or antibodies against RNA polymerase II (Pol II) or WT1. Co-precipitated DNA was analyzed by quantitative PCR using primers that flank the WT1 binding sites in the MMP9 promoter. The graph shows the fold enrichment in DNA immunoprecipitated by the indicated antibody compared with the control IgG.
Figure 7
Figure 7. Effect of WT1 on Xenograft Growth
A: The indicated cells were xenografted into NSG mice as described. Mice were euthanized when tumors in the largest group averaged 2,000 mm3. Data are the mean and SEM of cohorts of 5 mice. The difference is statistically significant with p < 0.0001. B: The indicated cells were xenografted into NSG mice as described. Mice were euthanized when tumors in the largest group averaged 2,000 mm3. Data are the mean and SEM of cohorts of 5 mice. Differences between SKWT1A and control and between SKWT1D and control are statistically significant at a p value of 0.08
Figure 8
Figure 8. Correlation between the expression of WT1, VEGF, MMP9 and CD31 in Ewing sarcoma
Ewing sarcoma tumor samples were immunostained with antibody to WT1 (A), VEGF (B), MMP9 (C), and CD31 (D). Signals were developed with DAB chromogen (brown) and counterstained with hematoxylin. Example of strong staining of corresponding antibody is illustrated. Positive expression is shown with arrows. All images are 200x.

References

    1. Carpentieri DF, Nichols K, Chou PM, Matthews M, Pawel B, Huff D. The expression of WT1 in the differentiation of rhabdomyosarcoma from other pediatric small round blue cell tumors. Mod Pathol. 2002;15(10):1080–1086. - PubMed
    1. Inoue K, Ogawa H, Sonoda Y, Kimura T, Sakabe H, Oka Y, Miyake S, Tamaki H, Oji Y, Yamagami T, Tatekawa T, Soma T, Kishimoto T, Sugiyama H. Aberrant overexpression of the Wilms tumor gene (WT1) in human leukemia. Blood. 1997;89(4):1405–1412. - PubMed
    1. Loeb DM, Evron E, Patel CB, Sharma PM, Niranjan B, Buluwela L, Weitzman SA, Korz D, Sukumar S. Wilms' tumor suppressor gene (WT1) is expressed in primary breast tumors despite tumor-specific promoter methylation. Cancer Res. 2001;61(3):921–925. - PubMed
    1. Miwa H, Beran M, Saunders GF. Expression of the Wilms' tumor gene (WT1) in human leukemias. Leukemia. 1992;6(5):405–409. - PubMed
    1. Miyoshi Y, Ando A, Egawa C, Taguchi T, Tamaki Y, Tamaki H, Sugiyama H, Noguchi S. High expression of Wilms' tumor suppressor gene predicts poor prognosis in breast cancer patients. Clin Cancer Res. 2002;8(5):1167–1171. - PubMed

Publication types

MeSH terms