. 2014 Jun 24;8(6):5494-514.
doi: 10.1021/nn5014484. Epub 2014 May 15.

A nanoparticle carrying the p53 gene targets tumors including cancer stem cells, sensitizes glioblastoma to chemotherapy and improves survival

Affiliations

A nanoparticle carrying the p53 gene targets tumors including cancer stem cells, sensitizes glioblastoma to chemotherapy and improves survival

Sang-Soo Kim et al. ACS Nano. .

Abstract

Temozolomide (TMZ)-resistance in glioblastoma multiforme (GBM) has been linked to upregulation of O(6)-methylguanine-DNA methyltransferase (MGMT). Wild-type (wt) p53 was previously shown to down-modulate MGMT. However, p53 therapy for GBM is limited by lack of efficient delivery across the blood brain barrier (BBB). We have developed a systemic nanodelivery platform (scL) for tumor-specific targeting (primary and metastatic), which is currently in multiple clinical trials. This self-assembling nanocomplex is formed by simple mixing of the components in a defined order and a specific ratio. Here, we demonstrate that scL crosses the BBB and efficiently targets GBM, as well as cancer stem cells (CSCs), which have been implicated in recurrence and treatment resistance in many human cancers. Moreover, systemic delivery of scL-p53 down-modulates MGMT and induces apoptosis in intracranial GBM xenografts. The combination of scL-p53 and TMZ increased the antitumor efficacy of TMZ with enhanced survival benefit in a mouse model of highly TMZ-resistant GBM. scL-p53 also sensitized both CSCs and bulk tumor cells to TMZ, increasing apoptosis. These results suggest that combining scL-p53 with standard TMZ treatment could be a more effective therapy for GBM.


Figures
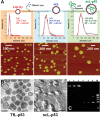
Figure 1
Figure 1
Self-assembly of scL-p53. After rupture of cationic liposomal complexes by contact with a negatively charged substrate, the resulting circular lipid patches were imaged by fluid AFM. (A) Size distribution of Liposome only (Lip), TfRscFv-Liposome (scL) and TfrscFv-Liposome-p53 plasmid DNA nanocomplex (scL-p53). Open circles represent a log-normal distribution fit to the multipoint averaged AFM data (upper panel). AFM images of circular patches of lipid remaining after rupture of liposomes and complex (lower panel). (B) CryoEM images of TfL-p53 (left panel) reprinted with permission from ref (21). Intact scL-p53 nanocomplexes adsorbed onto the substrate and imaged by AFM under dry conditions (right panel). Scale bars = 100 nm. (C) Agarose gel mobility shift assay to assess plasmid DNA encapsulation efficiency of the scL nanocomplex. Lanes 1–3 = scL-p53 nanocomplex prepared with p53 plasmid DNA at 0.5, 1.0, and 1.0 μg, respectively; lanes 4–6 = p53 plasmid DNA alone at 5, 10, and 50 ng, respectively; lane M = λ DNA/Hind III marker.
Figure 2
Figure 2
scL nanocomplex crosses the BBB. Mice with intracranially established U87 tumors were systemically injected with scL delivered ODN, fluorescently labeled with either Cy5- or 6FAM-, as a model payload to assess the targeting of brain tumors in vivo. (A) Representative images of brains bearing U87 tumors captured 24 h after a single i.v. injection with scL-Cy5-ODN (25 μg Cy5-ODN/mouse) using the Maestro in vivo fluorescence imaging system. The intensity of Cy5 fluorescence signal was shown in a color map. Dark red and blue colors indicate stronger and weaker fluorescence signals, respectively. Untreated, uncomplexed free Cy5-ODN, and unliganded Lip-Cy5-ODN served as controls. (B) Quantitative analysis of the intensity of Cy5 fluorescence signal, representing uptake of Cy5-ODN, in brain tumors using Maestro 2.10.0 software. Signal intensity is expressed as photons/cm2/second. (C) FACS analysis of Cy5-ODN uptake in the tumor cells isolated from U87 tumors after imaging in A. Cy5-ODN uptake in unselected (top panel) and stem cell marker (CD133 and SSEA-1)-positive populations (center and bottom panels) was also analyzed by FACS. (D) Coronal slices of brain from mice treated with scL-Cy5-ODN in A (indicted by asterisk) were further imaged with Maestro. Blue: normal brain. Red: Cy5. N: normal brain. T: tumor. (E) Fluorescence images of an intracranial U87 tumor 24 h after a single i.v. injection with scL-6FAM-ODN (100 μg 6FAM-ODN/mouse). Tumor-bearing brain slices were stained with H&E (upper left) or DAPI. The DAPI stained slices were analyzed using confocal microscopy. High power image of the inset box in the merged image is shown on the right. Scale bars = 50 μm. (F) Tumor section described in E was further stained with an anti-CD133 antibody (red fluorescence) and analyzed using confocal microscopy. High power images of the inset boxes are shown (a, b, and c). Scale bars = 20 μm. (G) FACS analysis of Cy5-ODN uptake in the normal brain cells and tumor cells isolated from mice with established intracranial T98G tumors. Tissue was harvested 24 h after a single i.v. injection of scL-Cy5-ODN (25 μg Cy5-ODN/mouse). Cy5-ODN uptake in brain tumor cells (left panel) and normal brain cells (right panel) were analyzed by FACS.
Figure 2
Figure 2
scL nanocomplex crosses the BBB. Mice with intracranially established U87 tumors were systemically injected with scL delivered ODN, fluorescently labeled with either Cy5- or 6FAM-, as a model payload to assess the targeting of brain tumors in vivo. (A) Representative images of brains bearing U87 tumors captured 24 h after a single i.v. injection with scL-Cy5-ODN (25 μg Cy5-ODN/mouse) using the Maestro in vivo fluorescence imaging system. The intensity of Cy5 fluorescence signal was shown in a color map. Dark red and blue colors indicate stronger and weaker fluorescence signals, respectively. Untreated, uncomplexed free Cy5-ODN, and unliganded Lip-Cy5-ODN served as controls. (B) Quantitative analysis of the intensity of Cy5 fluorescence signal, representing uptake of Cy5-ODN, in brain tumors using Maestro 2.10.0 software. Signal intensity is expressed as photons/cm2/second. (C) FACS analysis of Cy5-ODN uptake in the tumor cells isolated from U87 tumors after imaging in A. Cy5-ODN uptake in unselected (top panel) and stem cell marker (CD133 and SSEA-1)-positive populations (center and bottom panels) was also analyzed by FACS. (D) Coronal slices of brain from mice treated with scL-Cy5-ODN in A (indicted by asterisk) were further imaged with Maestro. Blue: normal brain. Red: Cy5. N: normal brain. T: tumor. (E) Fluorescence images of an intracranial U87 tumor 24 h after a single i.v. injection with scL-6FAM-ODN (100 μg 6FAM-ODN/mouse). Tumor-bearing brain slices were stained with H&E (upper left) or DAPI. The DAPI stained slices were analyzed using confocal microscopy. High power image of the inset box in the merged image is shown on the right. Scale bars = 50 μm. (F) Tumor section described in E was further stained with an anti-CD133 antibody (red fluorescence) and analyzed using confocal microscopy. High power images of the inset boxes are shown (a, b, and c). Scale bars = 20 μm. (G) FACS analysis of Cy5-ODN uptake in the normal brain cells and tumor cells isolated from mice with established intracranial T98G tumors. Tissue was harvested 24 h after a single i.v. injection of scL-Cy5-ODN (25 μg Cy5-ODN/mouse). Cy5-ODN uptake in brain tumor cells (left panel) and normal brain cells (right panel) were analyzed by FACS.
Figure 3
Figure 3
Time-dependent changes in expression of MGMT and p53 related proteins after the treatment with the scL-p53 nanocomplex in vitro and in vivo. In vitro studies: (A) Western blot analysis of MGMT and GAPDH protein levels at 24 h post-treatment of TMZ-resistant T98G cells with either scL-p53 or scL-vec (7 μg of DNA/dish) (upper panel). Densitometric quantification of the Western blot is shown in the lower panel in which MGMT expression is compared to that of the untreated (UT) control cells. (B) Western blot analysis of MGMT and GAPDH protein levels at 16 and 24 h after transfection of T98G cells with scL-p53 (7 μg of DNA/dish) (upper panel). Densitometric quantification of the Western blot is shown in the lower panel in which MGMT expression is compared to that of the untreated (UT) control cells. In both panels A and B, the lane in the Western blot corresponds to the bar directly below it. In both panels expression of GAPDH protein was utilized as an internal control for protein loading. In vivo studies: Mice with either subcutaneously or intracranially established T98G xenograft tumors were systemically (i.v. tail vein) injected with the scL-p53 nanocomplex (30 μg of DNA/mouse/injection). (C) Western blot analysis of MGMT and GAPDH protein levels in subcutaneous T98G xenograft tumors at 16 and 24 h after the last i.v. tail vein injection. (D) Densitometric quantification of the Western blot shown in C. (E, F) Western blot analysis of two independent experiments assessing changes in p53, MGMT, p21, and cleaved PARP protein levels in intracranial T98G xenograft tumors over time after the single i.v. tail vein injection. In both experiments expression of GAPDH protein was utilized as an internal control for protein loading.
Figure 4
Figure 4
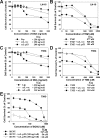
In vitro sensitization of human GBM cell lines to TMZ and BCNU by scL-p53. TMZ-resistant human GBM cell lines, LN-18 (A) and T98G (C) were transfected with increasing concentrations of scL-p53. For comparison, cells were also treated with lipid alone (Lip) or scL-vec, the nanocomplex carrying the empty plasmid vector. 96 h later, cell viability was measured by XTT assay. For chemosensitization studies, LN-18 (B) and T98G (D) were transfected with scL-p53 (100 ng of DNA/well, which is equivalent to 50 pg of DNA/cell) for 24 h and then treated with increasing concentrations of TMZ for an additional 72 h. For comparison, cells were also treated with TMZ alone. (E) Comparison of cytotoxic effects of BCNU alone and BCNU in combination with scL-p53 in T98G cells. Cells were treated with increasing concentrations of BCNU for 72 h, either alone or 24 h after transfection with the scL-p53 nanocomplex (either 100 or 200 ng of DNA/well, which are equivalent to either 50 or 100 pg of DNA/cell, respectively).
Figure 5
Figure 5
scL-p53-mediated enhancement of TMZ effect in highly TMZ-resistant human GBM cells. T98G cells were treated with the indicated concentrations of TMZ, either alone or after transfection with the scL-p53 nanocomplex (21 μg of DNA/dish, which is equivalent to 35 pg of DNA/cell) for 24 h. (A) Photomicrographs of representative area of the cell monolayer 3 days after TMZ treatment. Scale bar indicates 200 um. (B) Cell cycle profiles of T98G cells 3 and 6 days post-treatment with TMZ. The inset boxes indicate sub-G1 population. Numbers indicate the percentages of sub-G1 cells. (C) Quantification of the percent of cells in the sub-G1 population shown in B.
Figure 6
Figure 6
Enhanced tumor response and apoptosis in CSCs by the combination of TMZ and scL-p53 nanocomplex. Mice with subcutaneous T98G tumor xenografts were randomized to therapy with TMZ, either alone or in combination with scL-p53. Number of animals per treatment group = 4. (A) Treatment schedule. Mice received total 2 injections of scL-p53 and/or 5 injections of TMZ. (B) Comparison of tumor growth between different treatment groups. Arrow indicates the duration of the treatments. (C) Quantification of apoptotic cells in the tumor by Annexin V assay performed on day 9. The percentages of Annexin V positive cells in the tumors are shown. (D) Quantification of the apoptotic response represented by the percent of tumor cells in the sub-G1 population on day 9. The inset boxes indicate sub-G1 population. Numbers indicate the percentages of sub-G1 cells. (E) Quantification of apoptosis in the CD133+ CSCs and CD133 bulk tumor cells by TUNEL assay performed on day 9. Numbers indicate the percentages of TUNEL positive cells in tumors treated with TMZ plus scL-p53.
Figure 7
Figure 7
Enhanced tumor response by the combination of TMZ and scL-p53 nanocomplex in an orthotopic GBM model. Mice with intracranially established T98G xenograft tumors were randomized to groups and treated with TMZ in combination with scL-p53, or with either agent alone. (A) Treatment schedule. Mice received total 10 injections of scL-p53 and/or either 5 or 21 injections of TMZ. (B) MR imaging of intracranial T98G tumors. MR image was collected before the initiation of treatment (day 0) and during treatment (day 10 and day 22). Red lines indicate the outline of the brain tumors. Scale bar = 0.5 cm. Quantification of tumor volume from MRI measurement: (C) mice treated with 200 mg/m2 of body surface area of TMZ (5 days) or (D) mice treated with 100 mg/m2 of body surface area of TMZ (21 days). Number of animals per treatment group = 7–11. *P < 0.05.
Figure 8
Figure 8
Increased survival by combination of TMZ and scL-p53 nanocomplex in an orthotopic GBM model. Mice with intracranially established T98G xenograft tumors were randomized to groups and treated with TMZ in combination with scL-p53, or with either agent alone. (A) Single cycle treatment schedule. Mice received total 10 injections of scL-p53 and/or 21 injections of TMZ. (B) Kaplan–Meier survival curves. Number of animals per treatment group = 11–15. (C) Two cycle treatment schedule. Mice received 10 injections of scL-p53 and/or 21 injections of TMZ in each cycle. (D) Kaplan–Meier survival curves. Number of animals per treatment group = 11–15.

Similar articles

Cited by

References

    1. Nagasawa D. T.; Chow F.; Yew A.; Kim W.; Cremer N.; Yang I. Temozolomide and Other Potential Agents for the Treatment of Glioblastoma Multiforme. Neurosurg. Clin. North Am. 2012, 23, 307–322. - PubMed
    1. Vredenburgh J. J.; Desjardins A.; Herndon J. E. 2nd; Dowell J. M.; Reardon D. A.; Quinn J. A.; Rich J. N.; Sathornsumetee S.; Gururangan S.; Wagner M.; et al. Phase II Trial of Bevacizumab and Irinotecan in Recurrent Malignant Glioma. Clin. Cancer Res. 2007, 13, 1253–1259. - PubMed
    1. Hou L. C.; Veeravagu A.; Hsu A. R.; Tse V. C. Recurrent Glioblastoma Multiforme: a Review of Natural History and Management Options. Neurosurg. Focus 2006, 20, E5. - PubMed
    1. Johannessen T. C.; Bjerkvig R.; Tysnes B. B. DNA Repair and Cancer Stem-Like Cells—Potential Partners in Glioma Drug Resistance?. Cancer Treat. Rev. 2008, 34, 558–567. - PubMed
    1. Chamberlain M. C. Temozolomide: Therapeutic Limitations in the Treatment of Adult High-Grade Gliomas. Expert Rev. Neurother. 2010, 10, 1537–1544. - PubMed

Publication types

MeSH terms