. 2014 May 15;5(9):2499-512.
doi: 10.18632/oncotarget.1703.

A high-content morphological screen identifies novel microRNAs that regulate neuroblastoma cell differentiation

Affiliations

A high-content morphological screen identifies novel microRNAs that regulate neuroblastoma cell differentiation

Zhenze Zhao et al. Oncotarget. .

Abstract

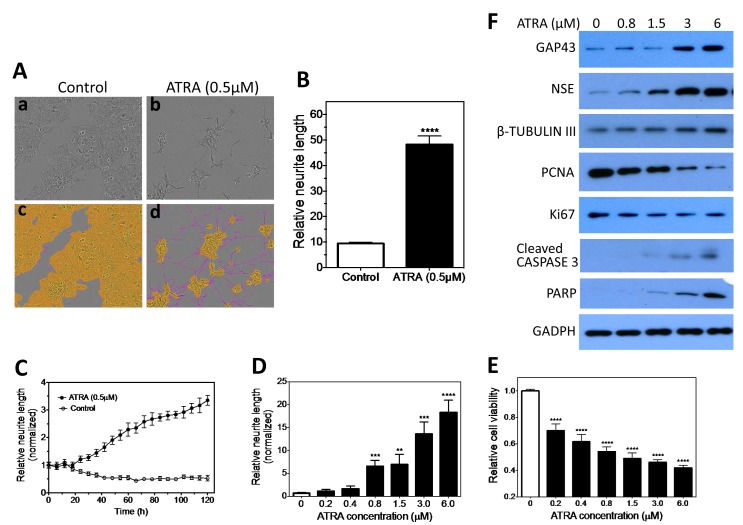
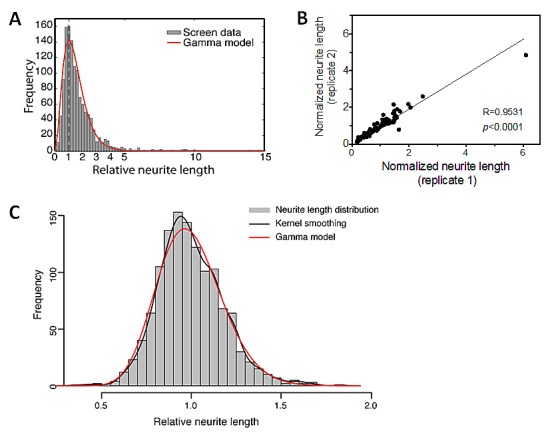
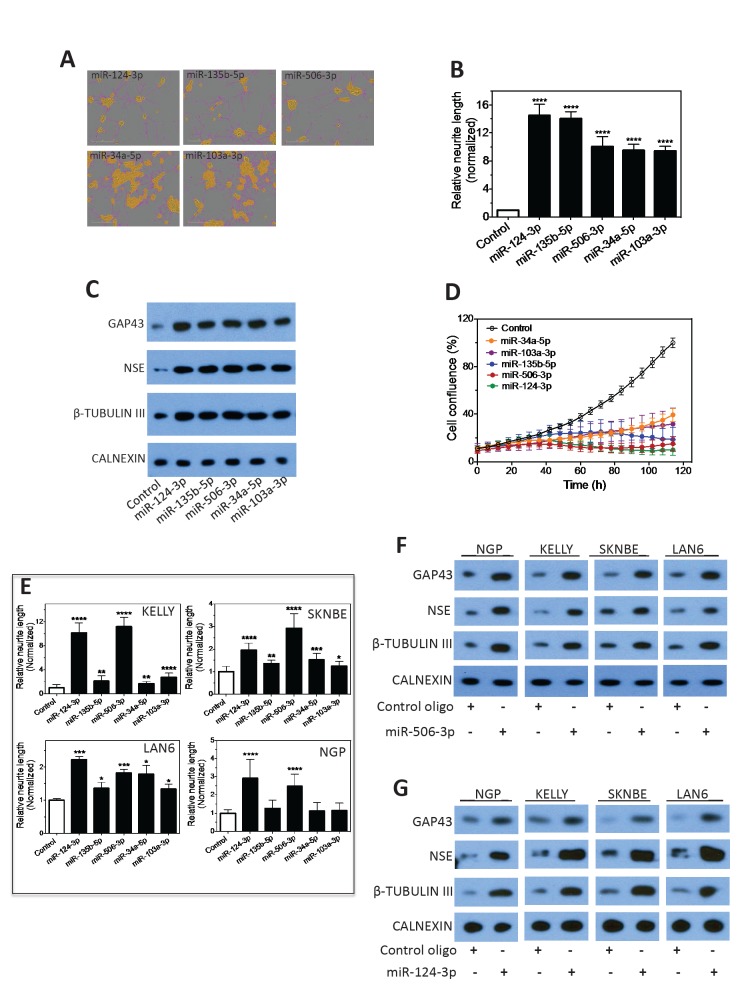
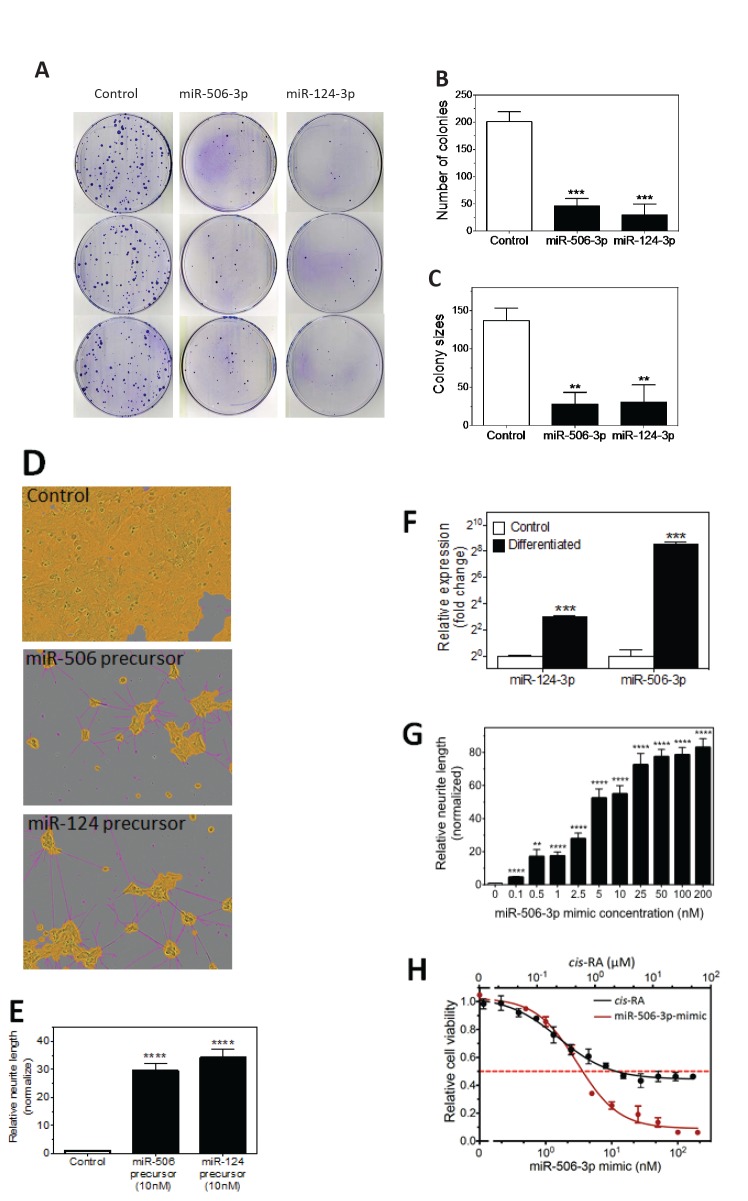
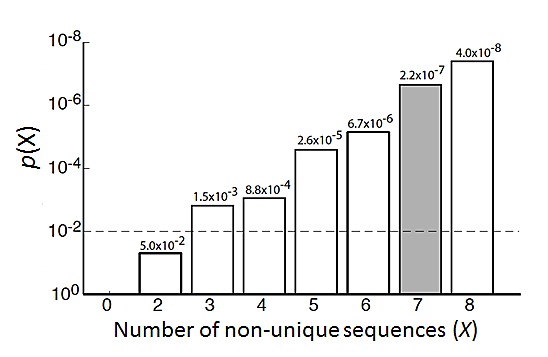
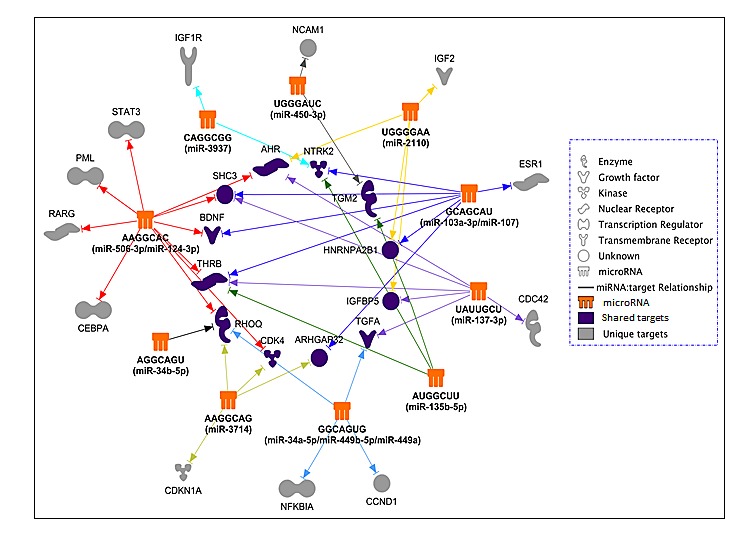
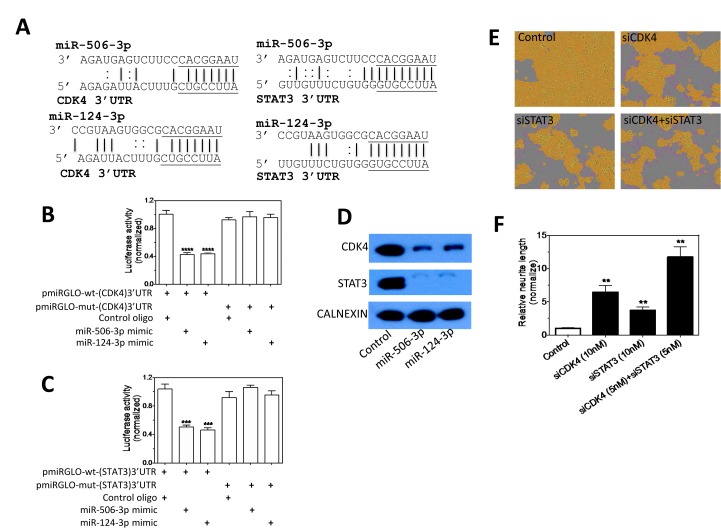
Neuroblastoma, the most common extracranial solid tumor of childhood, arises from neural crest cell precursors that fail to differentiate. Inducing cell differentiation is an important therapeutic strategy for neuroblastoma. We developed a direct functional high-content screen to identify differentiation-inducing microRNAs, in order to develop microRNA-based differentiation therapy for neuroblastoma. We discovered novel microRNAs, and more strikingly, three microRNA seed families that induce neuroblastoma cell differentiation. In addition, we showed that microRNA seed families were overrepresented in the identified group of fourteen differentiation-inducing microRNAs, suggesting that microRNA seed families are functionally more important in neuroblastoma differentiation than microRNAs with unique sequences. We further investigated the differentiation-inducing function of the microRNA-506-3p/microRNA-124-3p seed family, which was the most potent inducer of differentiation. We showed that the differentiation-inducing function of microRNA-506-3p/microRNA-124-3p is mediated, at least partially, by down-regulating expression of their targets CDK4 and STAT3. We further showed that expression of miR-506-3p, but not miR-124-3p, is dramatically upregulated in differentiated neuroblastoma cells, suggesting the important role of endogenous miR-506-3p in differentiation and tumorigenesis. Overall, our functional screen on microRNAs provided the first comprehensive analysis on the involvements of microRNA species in neuroblastoma cell differentiation and identified novel differentiation-inducing microRNAs. Further investigations are certainly warranted to fully characterize the function of the identified microRNAs in order to eventually benefit neuroblastoma therapy.


Figures

Figure 1
Figure 1. Neurite length is a quantifiable differentiation marker of BE(2)-C cells
2,500 cells were plated in 96-well plates and cultured overnight. Cells were then treated with ATRA or carrier (DMSO, control) and placed into the IncuCyte for detecting neurite outgrowth. 9 images were taken from each well to allow for statistical analysis. Relative neurite length is defined as neurite length per cell body area. A, ATRA induces neurite outgrowth. Shown are representative phase-contrast images for cells treated with (a) carrier or (b) ATRA for 5 days, and (c, d) the same images analyzed to define neurites (pink) and cell body areas (yellow). B, Quantification shows that ATRA significantly increases the relative neurite length compared to control. C, Relative neurite lengths increase in a time-dependent manner during ATRA-induced cell differentiation. Neurite lengths were normalized to the starting time point (0 h). D, Dose-dependent effect of ATRA on neurite outgrowth. Shown are the results after treating with ATRA for 5 days. E, Dose-dependent effect of ATRA on cell viability. Cells were treated with different concentrations of ATRA, and cell viability was determined after 5 days. F, Dose-dependent effect of ATRA on the protein expression levels of cell differentiation markers GAP43, NSE and β-TUBULIN III, cell proliferation markers Ki67 and PCNA, and apoptotic markers cleaved CASPASE 3 and PARP, with GAPDH protein levels used as a loading control. Cells were treated with ATRA as above, and protein levels were determined by Western blots after 5 days. **, p<0.01; ***, p<0.001; ****, p<0.0001.
Figure 2
Figure 2. HCS screening of miRNA mimics identifies miRNAs that induce neurite outgrowth in BE(2)-C cells
A-B, 2,500 cells were reverse-transfected with 25 nM miRNA mimics in 96-well plates. After 4 days of transfection, relative neurite lengths were quantified as above. A, The distribution of post-normalized neurite length measurements (grey histogram) for individual miRNA mimics from the screen and the fitted Gamma distribution curve (red line, α=3.27, β=0.444) generated by the method described in Suppl. Figure 3. B, Correlation between two independent neurite length measurements for one library plate. Cells were transfected with 25 nM mimics in two independent 96-well plates. Normalized neurite lengths were measured as above. Correlation of neurite length between the two plates was analyzed using two-tailed Pearson Correlation with p<0.05 considered significant. C, The distribution of the neurite lengths for untreated BE(2)-C cells. 2,500 Cells were plated into each well in 96 well plates. After 4 days, neurite lengths were analyzed as above. Shown are the neurite length distribution histogram (grey), the empirical density curve (black line), and the fitted Gamma distribution curve (red line, α=30.23, β=0.033). Using the P<0.05 threshold, Kolmogorov-Smirnov goodness-of-fit test for Gamma model validity did not reject the null hypothesis (p=0.16), which support that the neurite length distribution fits Gamma model.
Figure 3
Figure 3. Characterization of the effect of the top 5 neurite-inducing miRNA mimics on cell differentiation and growth in multiple neuroblastoma cell lines
A-B, Effects of the identified top 5 miRNA mimics on neurite outgrowth. BE(2)-C cells were transfected with 25 nM miRNA mimics or control for 4 days, and relative neurite lengths were quantified as above. Shown are representative cell images analyzed to define neurite and cell body areas (A) and neurite length quantifications (B). C, Effects of the 5 miRNA mimics on expression of differentiation markers, with CALNEXIN protein levels used as a loading control. BE(2)-C cells were transfected with 25 nM of the indicated miRNA mimics or control, and proteins levels were examined after 4 days. D, Effects of the 5 miRNA mimics on cell proliferation rate. E, Effect of the 5 miRNAs on neurite outgrowth in multiple cell lines. Cells were transfected with 25 nM miRNA mimics or control, and neurite lengths were quantified as above after 5 days. F-G, Effects of miR-506-3p (F) and miR-124-3p (G) mimics on expression of differentiation markers in multiple cell lines. *, p<0.05; **, p<0.01; ***, p<0.001; ****, p<0.0001.
Figure 4
Figure 4. Characterization of the tumor suppressive function of miR-506-3p/miR-124-3p family
A-C, Colony formation assay as a function of miR-124-3p and miR-506-3p mimics. BE(2)-C cells were transfected with the 25 nM of the indicated oligos and colony formation was examined as above. Shown are (A) plate images of colony formation and quantified colony numbers (B) and sizes (C). D-E, Effect of miR-124-3p and miR-506-3p precursors on neurite outgrowth. BE(2)-C cells were transfected with or without 10 nM miRNA precursors. Shown are (D) Representative images analyzed to define neurites and cell body areas after 4 days transfections and (E) quantification of relative neurite lengths. F, Effect of cell differentiation on endogenous expression of miR-506-3p and miR-124-3p in BE(2)-C cells. G, Dose-dependent effect of miR-506-3p mimic on neurite outgrowth in BE(2)-C cells. Cells were transfected with different concentrations of miR-506-3p mimic, and relative neurite lengths were quantified as above after 4 days. Neurite lengths were normalized to control (0 nM). H, Dose-dependent effect of miR-506-3p mimic and cis-RA on cell viability in BE(2)-C cells. Cells were transfected with different concentrations of miR-506-3p mimic for 4 days or treated with different concentrations of cis-RA for 5 days, and cell viability was determined as above. *, p<0.05; **, p<0.01; ***, p<0.001; ****, p<0.0001.
Figure 5
Figure 5. Enrichment analysis of seed families in a set of 14 miRNAs by random permutation
Grey bar shows the probability (p=2.2×10⁻⁷) that at least 7 non-unique seed sequences appear in a randomly selected set of 14 miRNAs.
Figure 6
Figure 6. The predicted differentiation-inducing targetome network for the identified 14 differentiation-inducing miRNAs
The 14 miRNAs were grouped into 10 seed-sequence groups. Predicted targets previously reported as involved in neuroblastoma differentiation were used to create the targetome network.
Figure 7
Figure 7. Validation of CDK4 and STAT3 as direct targets that mediate the differentiation-inducing function of miR-506-3p and miR-124-3p
A, The predicted interactions between miR-506-3p/miR-124-3p and the target sites in the 3'UTR of STAT3 and CDK4 mRNAs. The seed sequences are underlined. B-C, Validation of the target sites of miR-506-3p and miR-124-3p in the 3'UTRs of (B) CDK4 and (C) STAT3 by luciferase reporter assay. BE(2)-C cells were co-transfected with the indicated vectors and miRNA mimics or control oligo. After 72 h of transfection, cells were lysed and luciferase activity was measured. Shown are normalized luciferase activities of different treatment groups. D, miR-506-3p and miR-124-3p overexpression down-regulate endogenous CDK4 and STAT3 protein expression levels. Cells were transfected as above for 4 days, and protein levels were measured by Western blots. E-F, Effect of CDK4 and STAT3 knockdown on neurite outgrowth in BE(2)-C cells. Cells were transfected with the indicated oligos, and neurite lengths were measured as above after 4 days transfection. Shown are representative cell images analyzed to define neurites and cell body areas (G) and quantification of neurite length under the indicated treatment conditions (H). **, p<0.01; ***, p<0.001; ****, p<0.0001.

References

    1. Maris JM, Hogarty MD, Bagatell R, Cohn SL. Neuroblastoma. Lancet. 2007;369(9579):2106–2120. - PubMed
    1. Park JR, Eggert A, Caron H. Neuroblastoma: biology, prognosis, and treatment. Hematol Oncol Clin North Am. 2010;24(1):65–86. - PubMed
    1. Brodeur GM. Neuroblastoma: biological insights into a clinical enigma. Nat Rev Cancer. 2003;3(3):203–216. - PubMed
    1. Reynolds CP. Differentiating agents in pediatric malignancies: retinoids in neuroblastoma. Curr Oncol Rep. 2000;2(6):511–518. - PubMed
    1. Cruz FD, Matushansky I. Solid tumor differentiation therapy - is it possible? Oncotarget. 2012;3(5):559–567. - PMC - PubMed

Publication types

MeSH terms