. 2014 May 15;5(9):2761-77.
doi: 10.18632/oncotarget.1942.

Direct endothelial junction restoration results in significant tumor vascular normalization and metastasis inhibition in mice

Affiliations

Direct endothelial junction restoration results in significant tumor vascular normalization and metastasis inhibition in mice

Vijayendra Agrawal et al. Oncotarget. .

Abstract

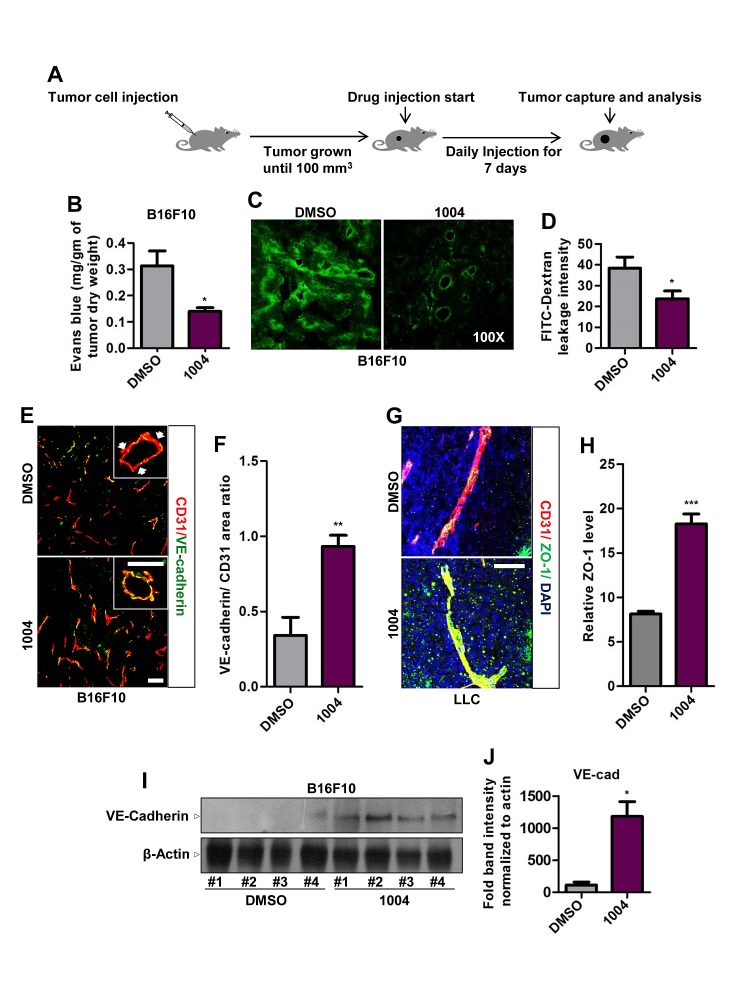
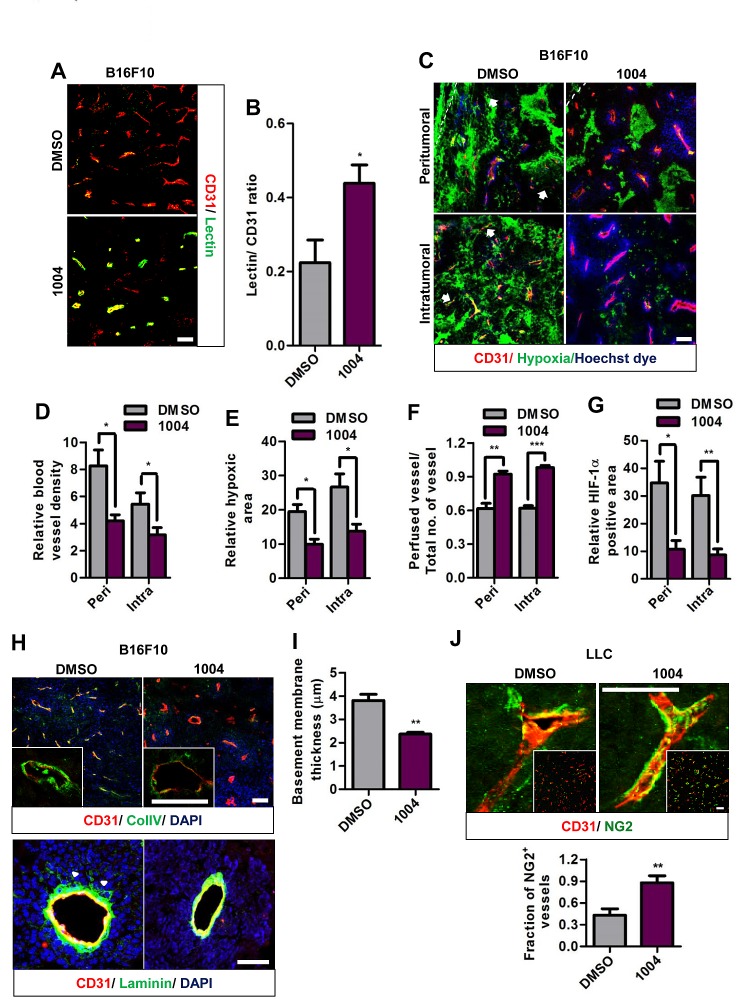
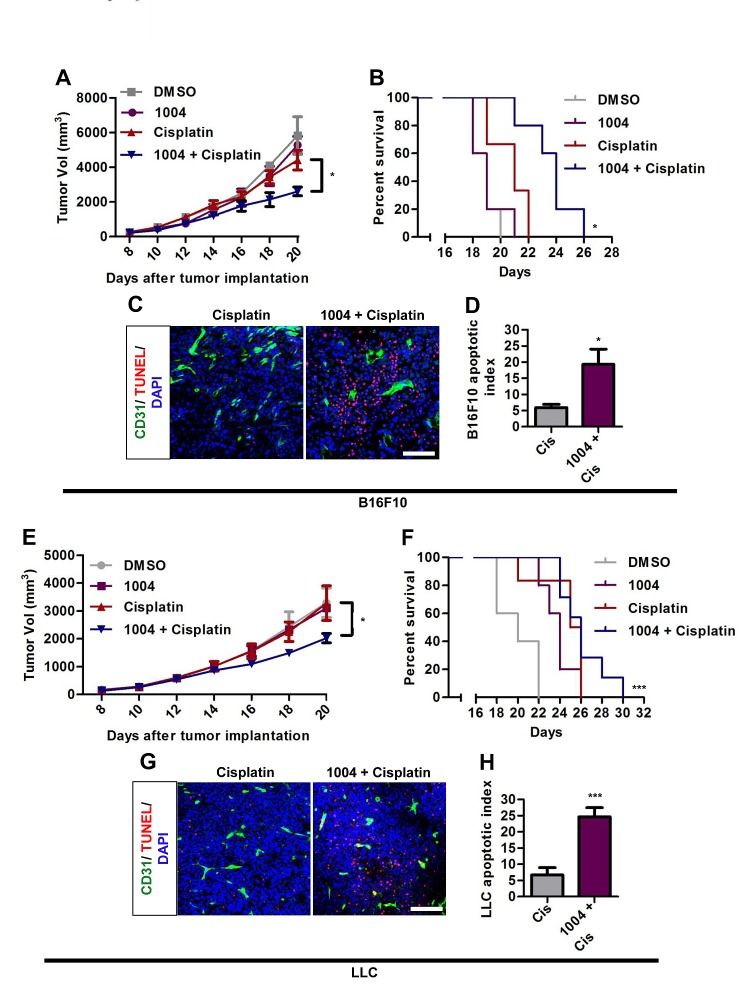
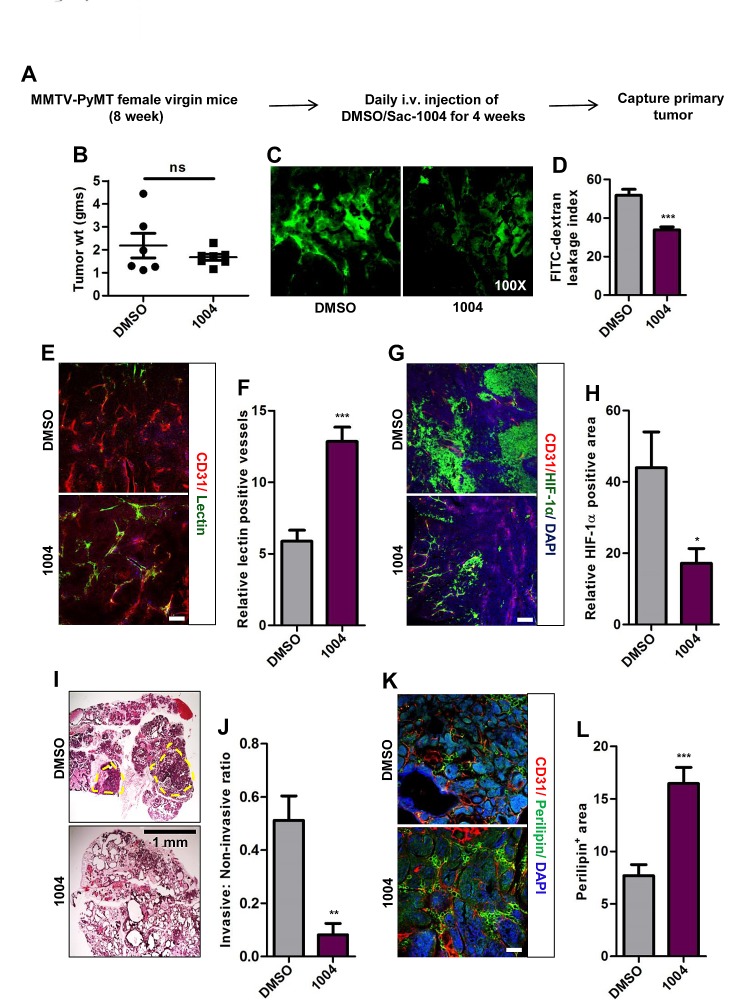
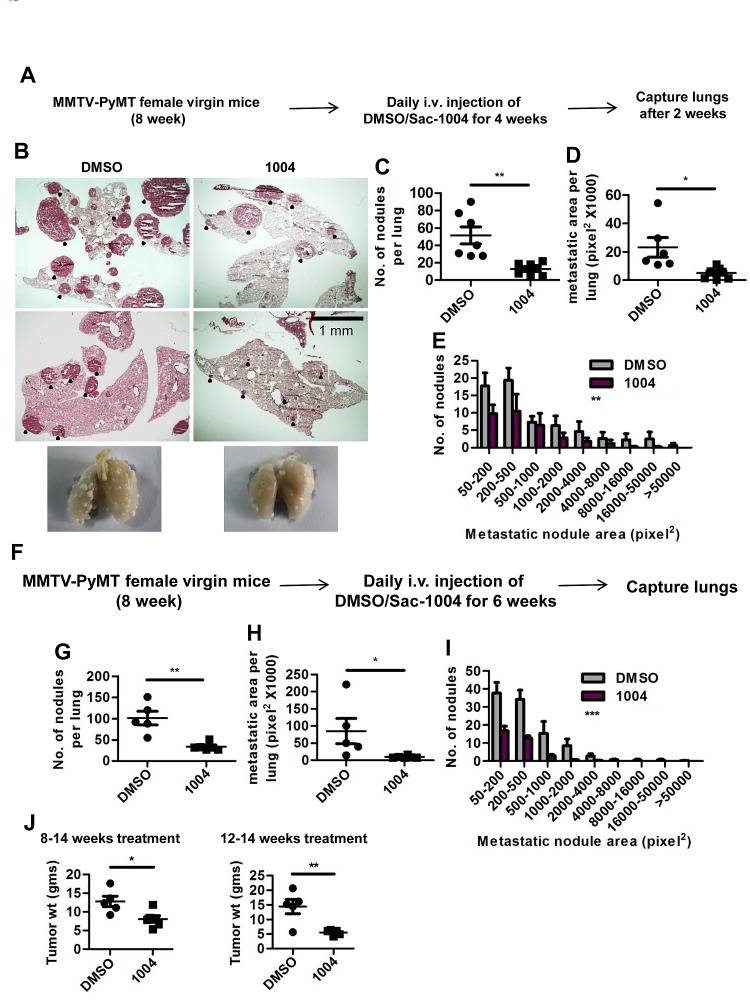
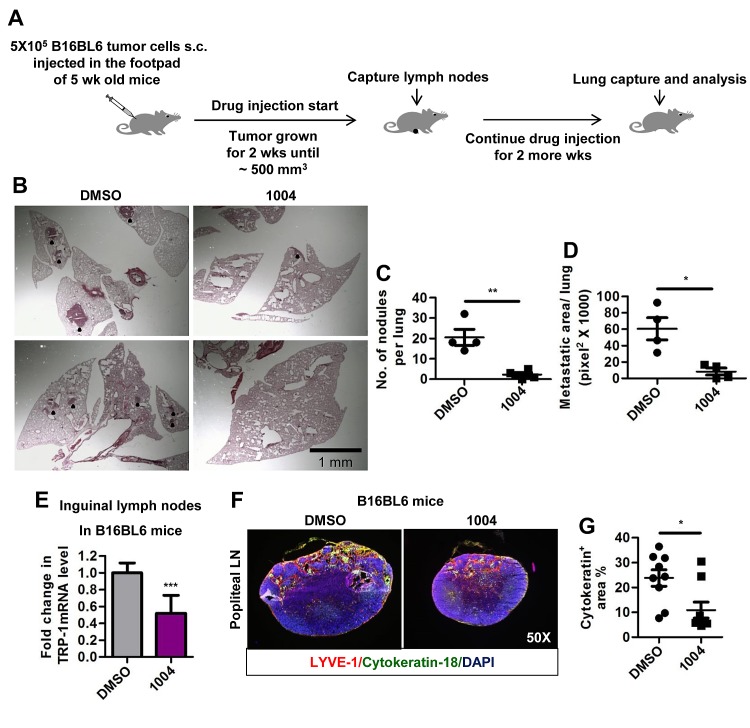
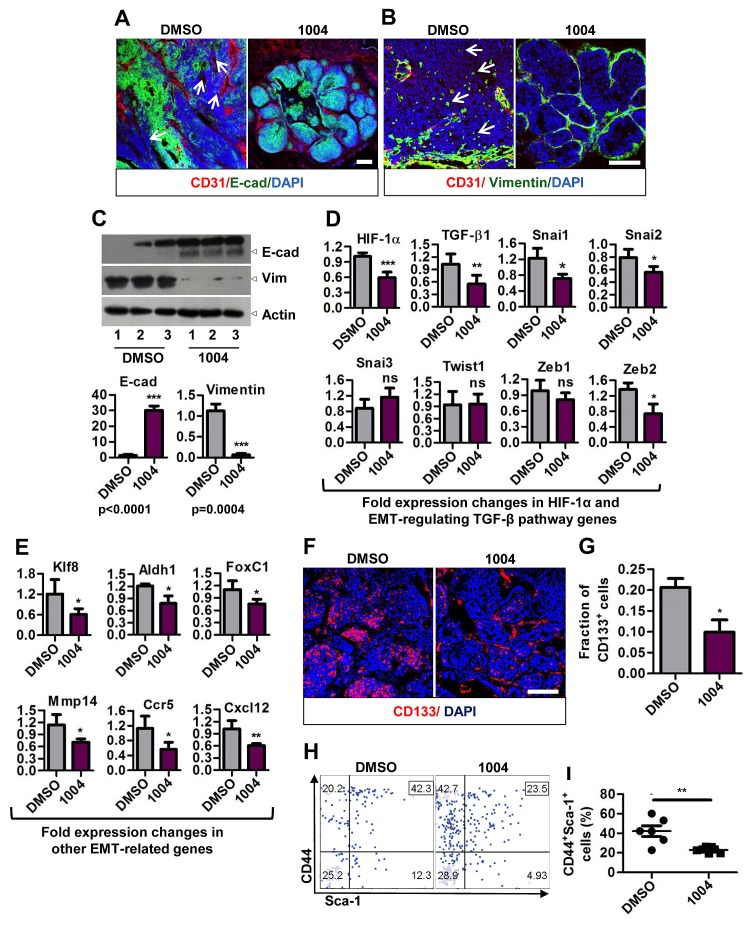
Tumor blood vessels are leaky and immature, which causes inadequate blood supply to tumor tissues resulting in hypoxic microenvironment and promotes metastasis. Here we have explored tumor vessel modulating activity of Sac-1004, a recently developed molecule in our lab, which directly potentiates VE-cadherin-mediated endothelial cell junction. Sac-1004 could enhance vascular junction integrity in tumor vessels and thereby inhibit vascular leakage and enhance vascular perfusion. Improved perfusion enabled Sac-1004 to have synergistic anti-tumor effect on cisplatin-mediated apoptosis of tumor cells. Interestingly, characteristics of normalized blood vessels namely reduced hypoxia, improved pericyte coverage and decreased basement membrane thickness were readily observed in tumors treated with Sac-1004. Remarkably, Sac-1004 was also able to inhibit lung and lymph node metastasis in MMTV and B16BL6 tumor models. This was in correlation with a reduction in epithelial-to-mesenchymal transition of tumor cells with considerable diminution in expression of related transcription factors. Moreover, cancer stem cell population dropped substantially in Sac-1004 treated tumor tissues. Taken together, our results showed that direct restoration of vascular junction could be a significant strategy to induce normalization of tumor blood vessels and reduce metastasis.


Conflict of interest statement

The authors declare no conflict of interest.

Figures

Figure 1
Figure 1. Sac-1004 reduces vascular leakage with concomitant increase in junction integrity in tumor blood vessels
(A) Schematic plan for the administration of Sac-1004 (indicated as 1004) or control (DMSO) to tumor-bearing mice. (B) B16F10 tumor-bearing mice (n = 5) were injected with Sac-1004 or control as in (A) and tumor vascular leakage was quantified by the Evans blue method. (C) Vascular leakage was assessed by FITC-dextran. (D) Iimages shown in (C) were quantified using ImageJ software. Three sections per tumor (100 μm apart) (n = 5) were photographed and quantified. (E) Immunofluorescence staining of B16F10 tumor sections, treated with Sac-1004 or control, for CD31 and VE-cadherin. Arrows indicate discontinuity in VE-cadherin staining. Scale bar, 100 μm (50 μm in inset). (F) Quantification of immunofluorescence images shown in (E) using Multi Gauge software (n = 5). (G) LLC tumor sections, treated with Sac-1004 or control were costained for CD31, ZO-1 and DAPI. Scale bar, 50 μm. (H) Images shown in (G) were quantified using ImageJ software (n = 5). (I) Western blot analysis of B16F10 tumors treated with Sac-1004 or control for VE-cadherin. (J) VE-cadherin and actin blots from (I) were quantified using ImageJ software. *P<0.05; **P<0.01; ***P<0.001 (Student's t-test). Data are represented as mean ± s.e.m.
Figure 2
Figure 2. Sac-1004 improves vascular perfusion, alleviates hypoxia and normalizes tumor blood vessels in tumors
(A) Immunofluorescence staining of B16F10 tumor sections (n = 5), treated with Sac-1004 or control, for CD31 and tomato lectin. Scale bar, 100 μm. (B) Images shown in (A) were quantified using ImageJ software. (C) Immunohistochemical analysis of B16F10 tumor sections (n = 5) for CD31, hypoxia, and vascular perfusion (Hoechst dye) in the peritumoral and intratumoral zone. Arrows indicate non-perfused vessels. Scale bar, 100 μm. (D-F) Quantification of immunofluorescence images shown in (C) with Multi Gauge software. (G) Quantification of HIF-1α positive area using Multi Gauge software. (H) B16F10 tumor sections (n = 5), treated with Sac-1004 or control, were stained for CD31 and ColIV (up)/ laminin (bottom). Scale bar, 100 μm (50 μm in insets). Arrowheads indicate the point of detachment between basement membrane and endothelial cells. Scale bar, 50 μm. (I) Quantification of basement membrane thickness in B16F10 tumor vessels shown in (H) using Multi Gauge software. (J) Immunofluorescence staining of LLC tumor sections (n = 5) for CD31 and NG2. Scale bar, 50 μm (100 μm in insets). Quantification was done using Multi Gauge software. *P<0.05; **P<0.01; ***P<0.001 (Student's t-test). Data are represented as mean ± s.e.m.
Figure 3
Figure 3. Sac-1004 augments the tumor-growth suppressing effect of cisplatin in tumor-bearing mice
B16F10 and LLC tumor-bearing mice were intravenously injected with Sac-1004 alone or in combination with cisplatin, and tumor volumes (A and E) were measured on alternate days for 2 weeks (n = 8 tumors per group from two independent experiments). Also survival of mice was monitored (B and F). Each point in Kaplan-Meier curve represents the percent of surviving mice. Mice with tumor size greater than 5000 mm3 were considered dead. The p values were calculated using log rank test (n = 8 mice per group). Immunofluorescence analysis of Sac-1004 and/or cisplatin-injected B16F10 (C) and LLC (G) tumors (two dose of Sac-1004 and a single dose of cisplatin as combination therapy) for TUNEL-positive cells (n = 5). Scale bar, 100 μm. (D) Quantification of apoptotic tumor cells as shown in (C) using ImageJ software. (H) Quantification of apoptotic tumor cells as shown in (G) using ImageJ software. *P<0.05; ***P<0.001 (Student's t-test except survival curve data). Data are represented as mean ± s.e.m.
Figure 4
Figure 4. Sac-1004 reduces vascular leakage, HIF-1α expression and malignancy of breast tumor in MMTV-PyMT mice model
(A) Schematic plan for the treatment of MMTV-PyMT female mice with Sac-1004. (B) Comparison of breast tumor weight of MMTV mice (n = 7) after treatment with Sac-1004. ns, not significant. (C) MMTV mice were injected with FITC-dextran before capture of tumor (n = 7). (D) FITC-dextran leakage from blood vessels as shown in (C) was quantified using ImageJ software. (E) Immunostaining of MMTV tumor sections (n = 7) for CD31 and lectin. (F) Quantitation of lectin positive vessels as shown in (E) using ImageJ software. (G) MMTV tumor sections were stained for CD31 and HIF-1α (n = 7 mice). (H) Quantitation of HIF-1α positive tumor area as shown in (G) using ImageJ software. (I) Hematoxylin and eosin staining of MMTV breast tumor sections (n = 7). Yellow circle denotes invasive zone. Scale bar, 1 mm. (J) Quantitation of ratio of invasive and non-invasive regions from figure shown in (I) using Multi Gauge software. (K) Immunohistochemical staining of MMTV tumor sections with CD31 and perilipin (n = 7 mice). (L) Quantitation of perilipin positive area from Figure shown in (K) using ImageJ software. Scale bar, 100 μm (in all images). *P<0.05; **P<0.01; ***P<0.001 (Student's t-test). Data are represented as mean ± s.e.m.
Figure 5
Figure 5. Sac-1004 reduces the extent of metastasis in MMTV-PyMT mice
(A) Schematic plan for the administration of Sac-1004 to MMTV mice for metastatic study. (B) Hematoxylin and eosin staining of lung sections from MMTV mice (n = 7). Black dots indicate metastatic nodules. Scale bar, 1 mm. (C-E) Quantitation of the number of nodules (C), metastatic area (D), and distribution of metastatic nodules (E) per lung based on the staining shown in (B) using Multi Gauge software. (F) Schematic plan for the long-term treatment of MMTV mice with Sac-1004. (G-I) Quantitation of the number of nodules (G), metastatic area (H), and distribution of metastatic nodules (I) per lung from mice receiving long-term treatment using Multi Gauge software (n = 7). (J) Comparison of breast tumor weight from mice receiving long-term treatment (8-14 weeks) or late treatment (12-14 weeks) of Sac-1004 (n = 7). *P<0.05; **P<0.01; ***P<0.001 (Student's t-test except for metastatic nodule distribution, which was analyzed by 2 way ANOVA). Data are represented as mean ± s.e.m.
Figure 6
Figure 6. Sac-1004 reduces lung and lymph node metastasis in B16BL6 foot-pad metastasis mice model
(A) Schematic plan for the administration of Sac-1004 and capture of lymph nodes and lungs from B16BL6 mice model. (B) Hematoxylin and eosin staining of lung sections (n = 5 mice). Black dots indicate metastatic nodules. Scale bar, 1 mm. (C and D) Quantitation of the number of nodules (C) and metastatic area (D) per lung from the sections stained in (B) using Multi Gauge software. (E) RNA samples from inguinal lymph nodes (n = 10) were used to quantitate the expression of TRP-1 using real-time PCR. (F) Sections of popliteal lymph nodes (n = 10) were immunostained for LYVE-1 and cytokeratin-18 (melanocyte marker). (G) Quantitation of cytokeratin positive area from the sections stained in (F) using Multi Gauge software. *P<0.05; **P<0.01; ***P<0.001 (Student's t-test). Data are represented as mean ± s.e.m.
Figure 7
Figure 7. Sac-1004 hinders epithelial-to-mesenchymal transition by affecting related genes and also reduces cancer stem cell population
(A) Immunostaining of control or drug-treated MMTV tumor sections (n = 7) for CD31 and E-cadherin. Arrows indicate the patches unstained with E-cadherin. (B) MMTV tumor sections (n = 7) were stained with CD31 and vimentin. Arrows indicate vimentin positive cells in the tumor mass. (C) Western blot of protein samples isolated from control and drug-treated MMTV tumors for E-cadherin and Vimentin (three individual experiments). Quantitation of the blots is shown below. (D and E) Real-time PCR analysis of RNA samples isolated from MMTV tumor (long-term treatment) to show the fold difference in expression of TGF-β pathway (D), and other (E) genes. All gene expressions were normalized to cyclophilin B. (F) Immunostaining of MMTV tumor sections (n = 7) for CD133+ cancer stem cells. (G) Quantitation of CD133+ cell fractions from the sections stained in (F) using ImageJ software. (H) FACS analysis of tumor cells isolated from MMTV tumors (n = 7; long-term treatment) for CD44+Sca-1+ cell fraction. (I) Quantitation of CD44+Sca-1+ cell fraction as shown in (H). Scale bar, 100 μm (in all images). *P<0.05; **P<0.01; ***P<0.001 (Student's t-test). Data are represented as mean ± s.e.m.

References

    1. Jain RK. Normalization of tumor vasculature: an emerging concept in antiangiogenic therapy. Science. 2005;307(5706):58–62. - PubMed
    1. Weis SM, Cheresh DA. Tumor angiogenesis: molecular pathways and therapeutic targets. Nat Med. 2011;17(11):1359–1370. - PubMed
    1. Fukumura D, Jain RK. Tumor microvasculature and microenvironment: targets for anti-angiogenesis and normalization. Microvasc Res. 2007;74(2-3):72–84. - PMC - PubMed
    1. Carmeliet P, Jain RK. Principles and mechanisms of vessel normalization for cancer and other angiogenic diseases. Nat Rev Drug Discov. 2011;10(6):417–427. - PubMed
    1. Haase VH. Oxygen regulates epithelial-to-mesenchymal transition: insights into molecular mechanisms and relevance to disease. Kidney international. 2009;76(5):492–499. - PMC - PubMed

Publication types

MeSH terms